FNGS - Ranking The Magnificent 7 Stocks And An ETF That Owns Them All (FNGS)
2023-12-31 08:08:17 ET
Summary
- The group of dominant businesses known as FAANG, renamed The Magnificent 7, had a successful year in 2023.
- Investors can gain exposure to the Magnificent 7 through the MicroSectors FANG+ ETN.
- The technical analysis of the Magnificent 7 stocks suggests that they may not lead the stock market higher in 2024.
What a year it was for the "Magnificent 7." And I am surely not talking about the 1960 or 2016 versions of the movie by that name. Somewhere along the way during the past year, the group of giant, dominant businesses known as FAANG were renamed The Magnificent 7. And that describes the 2023 experience for investors who owned that group, or even just a couple of them.
This seems like an ideal time look backward and forward regarding these market darlings, and also alert investors to a way they can use an ETF to plug into their portfolio what is essentially Magnificent 7 exposure in a single trade. More significantly, I'll use some of my 43 years of technical analysis experience to perform a simple technical and quantitative analysis of the "Mag 7" to see which of those stocks have the best chance to keep the rally going, and which ones could be the downside leaders if the market turns south in the coming months.
FNGS: a one-stop shop for Magnificent 7 fans
While investors have owned or traded those 7 stocks since the October 2022 market bottom have had a heck of a ride. But my guess is they didn't realize they could also have them in an equally-weighted basket, with 3 additional popular stocks, via the $190 million MicroSectors™ FANG+ ETN (FNGS). Its $480 billion average market cap across its 10 holdings speaks to the fact that these stocks were, in most cases, very large to begin with. But they've grown much bigger.
70% of FNGS is allocated to the Magnificent 7, which makes it a good proxy for owning those stocks individually. As the chart below shows, 2023 was classic evidence of how diversification, even with stocks that some assume move in sync, can work. FNGS was up 95% for the year through Thursday's close. Apple ( AAPL ), Microsoft ( MSFT ) and Alphabet ( GOOG ) (GOOGL), 3 of the "veteran" behemoths in the group of 7, lagged the other 4, and so FNGS would have lifted the return of an investor that avoid those.
So that's FNGS. Now, let's break down 7 of that very focused 10-stock ETF's holdings, the Magnificent 7. Before I zip through the charts, let's take a quick look at some ratings and statistics, starting with Seeking Alpha's Quant Factor Grades.
Magnificent 7: the opposite of cheap
Across the top we see the valuation grades. Let's put it this way: you hope your kid never comes home with a report card that looks like that!
The flip side of that issue is that these stocks are all sustainably profitable. And except for Apple, which has had 4 consecutive weak quarterly earnings and sales reports, and Microsoft, which may just have become too big to be a growth stock (yet pays a measly dividend), growth ratings are solid.
Momentum grades are the type of report card you want to see from "junior" unless of course this is the end of the line for those uptrends. We'll find out soon in 2024, and we will check the charts below to try to handicap what could happen.
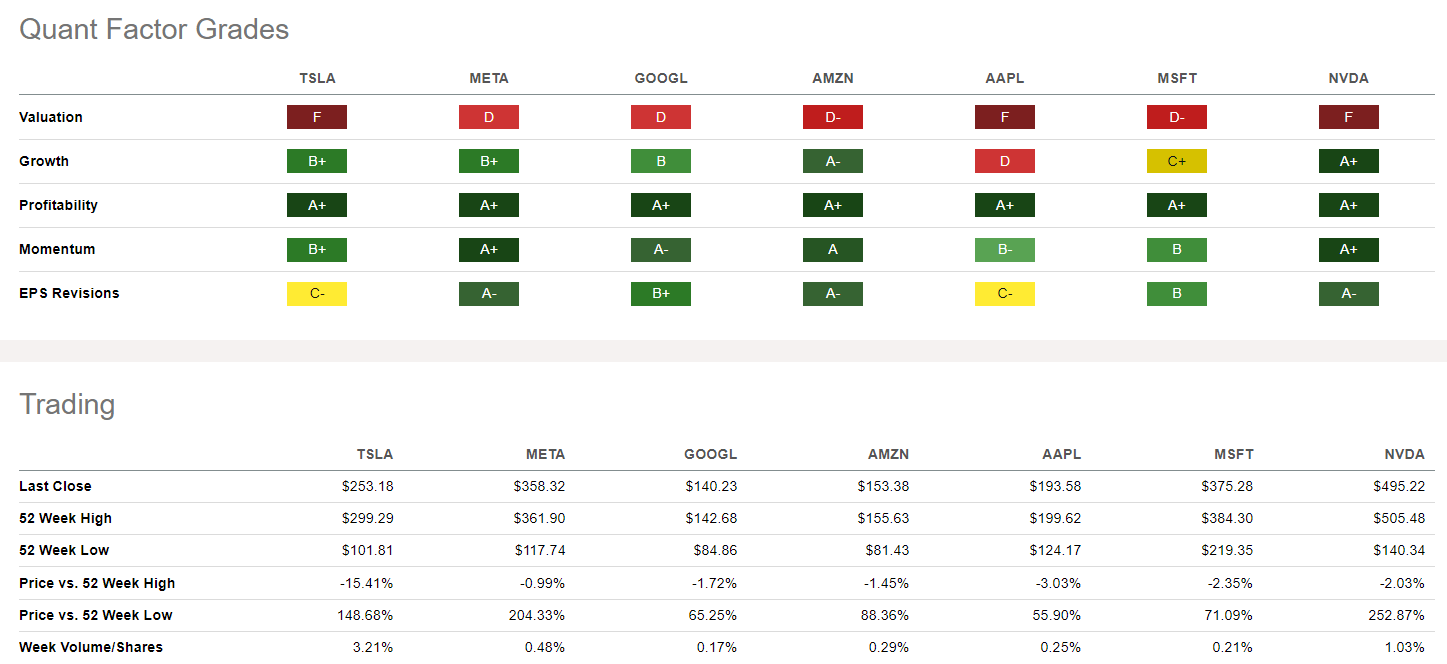
I included the Trading section as well, primarily to point out that except for Tesla ( TSLA ), these 7 giants are right at their 52-week highs. Some on Wall Street question whether TSLA should be grouped with the rest, but I'll let others fight that out. All told, TSLA, AAPL and MSFT are the ones with the most blemishes in this table.
Now, let's see if the technical picture is in sync with that. What we do know going in: these stock are all hot and all grossly overvalued based on Seeking Alpha's outstanding quantitative rating system. Something has to give.
A picture is worth a thousand...dollars? (or many thousands): a chart sweep through the Magnificent 7
Rather than dazzle you with a chart filled with more lines than a trip to a Disney theme park, I'll keep this to a simple graph of each stock's price trend for the past 12 months, and my favorite snapshot indicator for this type of time frame, the 20-day exponential moving average of that price. If you have questions on some of the technical jargon, or want to see more detail, let me know in the Seeking Alpha article comments section.
Apple has had a mighty nice run for 12 months. It is again having a hard time breaking above $200 a share. This is not yet ominous, but another $10 per share lower and it could get ugly. Not that $10 makes a world of difference with a first-class business, but when sellers start to get on the same page, a dip to $180 could beget an acceleration to the downside, opposite of what we just saw, and similar to what happened to many of these stocks in 2022.
Microsoft is doing what the S&P 500 is right now: stagnating at a key level, near its all-time high. This is a wait and see and it looks better than Apple, so January could be a critical "tell" here.
This is what we call "no man's land," in that the 20-day average is not budging and the stock has been exciting (isn't it always?) but rangebound. So as for 2 of the 3 stocks that were less healthy in the quant grades table, their charts don't scream "look out" just yet. But you don't need me to tell you that it can all turn on a dime in these modern, 24/7 news flow, index-driven, algorithmic trading-influenced environment that replaced the "good old days" where fundamentals mattered, and technicals worked like a Timex watch. No more for all of that.
Meta has been one awesome comeback story, and it doesn't look over just yet. The rate of ascend has slowed, and unlike a lot of technicians, I track that pretty closely. But again, no panic signals in this basic chart presentation.
We should never invest based on how we feel, but I'll note that Alphabet's chart "feels" a bit like Microsoft's quant grade table did: like it is running out of steam on a long-term basis. It survived some quick sharp selloffs over the past 12 months, part of that reactions to earnings that were forgiven soon afterward, and became just another "buy the dip" situation. It is toppy-looking but again, early 2024 will provide much better conditions to tell. This past month of December was a period where trading activity was absent a lot of key moments that might tip off where some of these stocks are going.
If you are starting to see a pattern in these successive charts, you are not imagining it. The S&P 500 is stagnating, the Nasdaq 100 is too, and small cap stocks start 2024 at the top of a large trading range that runs 20% from top to bottom. So seeing the market leaders look like this is the norm. My guess is that if we did this analysis again in 6-8 weeks, it will tell us more.
Amazon may be first to my door (every day, it seems!), but its chart might be the last one to consider piling into. That's a sharp flattening that just occurred, and as great as this stock and company are, there's a real possibility it treads water here or worse. And treading water with these low yielders does not pay you while you wait, if you are a long-term investor.
So in the title, I mentioned ranking these stocks. I'll do so here based on the information above, but far more important is that at a time when they appear to be in sync, the bigger concern for investors should be the idea that they are likely to lead the market somewhere, higher or lower. At the margin, I'm allowing for an early-year surge, but the ultimate path is more likely down than up, even if its a close call right now.
But as I noted here and any time I'm in a conversation about it, investing today is tactical more than buy and hold, at least to me. That means that heading into the new year, I am positioned more toward loving T-bills, and keeping my equity exposure low (my proprietary market risk score, ROAR, ended the year at 35 out of 100, with 100 being most bullish).
So for those who would consider this article incomplete without a final ranking, here it is, from most likely to outperform the rest of the 7 to least:
1. MSFT (chart looks least vulnerable, though its a close call)
2. AMZN
3. GOOG
4. META
5. NVDA
6. TSLA
7. AAPL (the one stock of the 7 that appears to already be slipping a bit)
Concluding thoughts
If you expected a set of strongly-worded buy and sell pronouncements, I'm sorry. But technical analysis, to me at least, is a constant calibration of 2 things: reward potential and the risk of major loss that accompanies that reward potential. Any stock or ETF can go up at any time, but each security is different in its downside risk. In the case of this set of Mag 7 names, the jury is out but there is nothing I see here that makes me think that these stocks will lead the stock market higher in 2024, as they did in 2023.
As I wrote in a recent article, I think 2024 will be year where the Dow likely outperforms the S&P 500 and Nasdaq, in part because these dominant market cap giants have less "left in the tank" with their combination of extended price moves and high valuations. This could be like 1995, where the market brushed off many 1994 Fed rate hikes to plow higher for the next 5 years, or 2007, where we see the market squeeze one more year out of the rally before imploding a year after many thought it would.
But investing is not an exact science, and each investor should approach 2024 the way they want. I'm here along with so many others to chip in and make our thought process transparent, after managing money for private families for decades.
Here's to a great year in 2024, whether the money is made on the long side, short side or both. And above all else, best wishes for a healthy one!
For further details see:
Ranking The Magnificent 7 Stocks And An ETF That Owns Them All (FNGS)