BIV - Rates Are Close Peaking; I Am Cautious On Equities
2023-04-20 13:00:00 ET
Summary
- Silicon Valley Bank's collapse signaled the impact of higher interest rates on the U.S. economy.
- The Fed Funds futures market expects the Fed to start cutting rates towards the end of 2023.
- Consumer spending will face more challenges as pandemic relief programs expire.
- Interest rates could fall further as investors seek out safe havens due to higher recession risk. Negative forward equity returns seem likely.
- Long short-term and long-term treasuries versus a short SPY and/or IWM position could be an interesting 6-to-9-month trade.
Summary
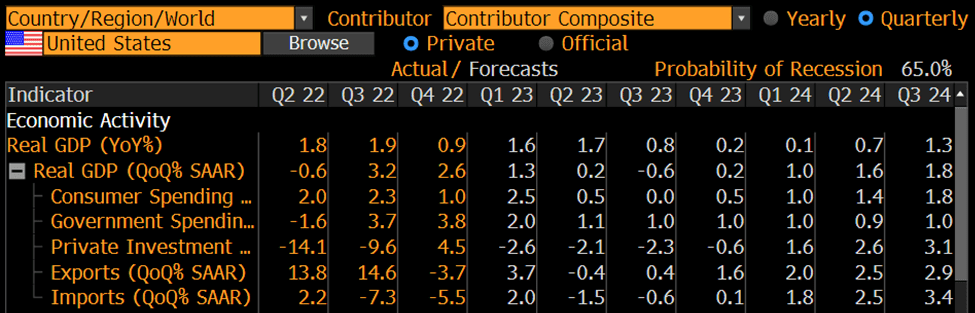
The U.S. economy had been showing signs that it was beginning to slow down towards the end of February. Key surveys point to a slowdown in hiring intentions, particularly among small business and manufacturing industries. High frequency credit card data is pointing to negative retail spending for the first time since the pandemic.
According to Bloomberg, economists expect for the U.S. GDP to contract in the 2 nd quarter of 2023 on a quarter over quarter seasonally annualized adjusted rate (QoQ% SAAR).
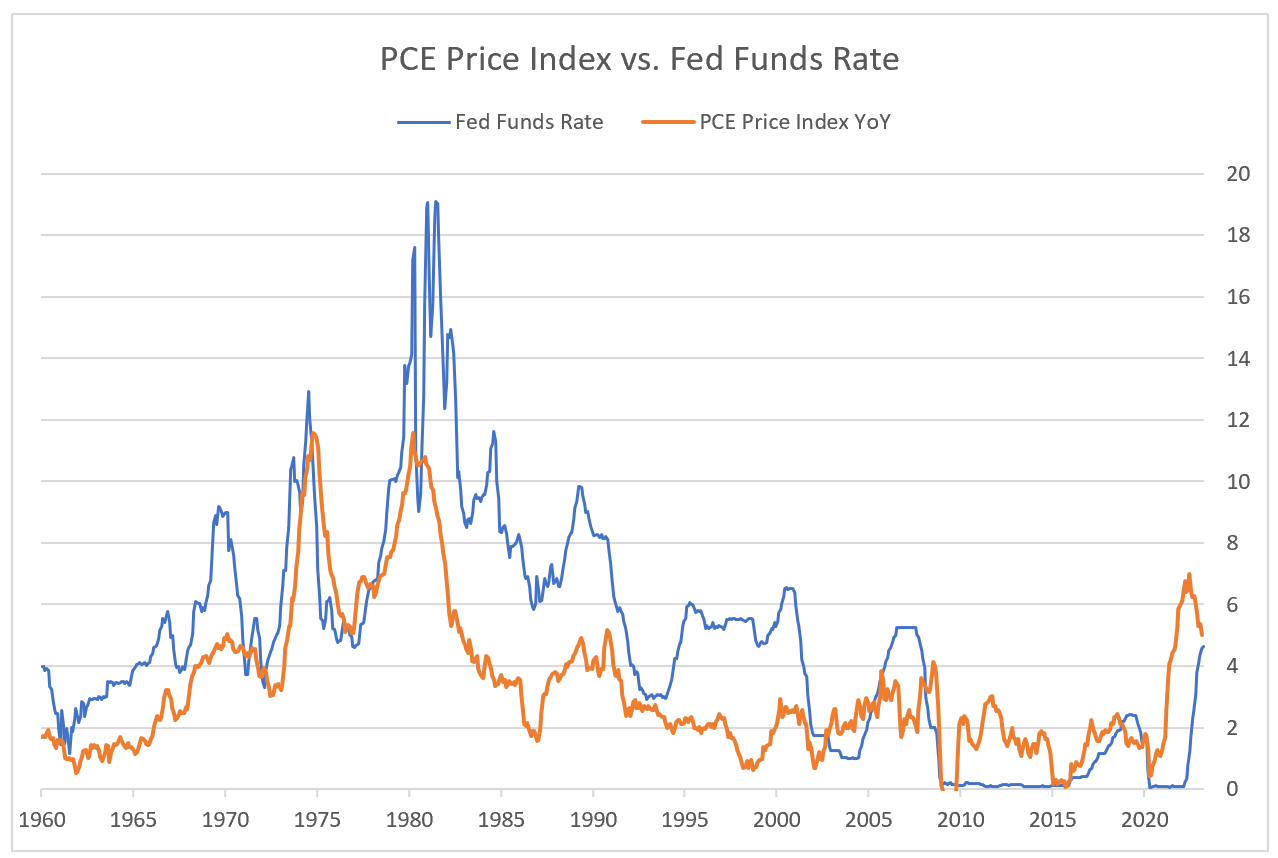
The estimates in the above table might still be too rosy. The financial crisis should add stress to the U.S. economy as banks will undoubtedly tighten lending standards. The Fed minutes released April 12th, reinforced that the Fed sees a significant impact of the banking crisis on economic growth. Surprisingly, the Fed has continued to tighten monetary policy even though the U.S. economy is showing clear signs of weakening. The Fed remains vigilant in its fight against inflation and the Core PCE (the Fed’s preferred measure) was 4.6% in February, which is still well above their committee’s long-term target of 2%.
The failure of SVB has decreased the prospects for better economic times ahead in the U.S. Fed Senior Loan Officer Surveys were indicating a reduction of credit not seen since the pandemic (and these surveys were conducted before multiple banks failed in the US and Europe last month).
Federal Reserve
The market reacted violently to the crisis. The Fed Funds futures market is now pricing in a cut in the fed funds rate by the fourth quarter. If the economic slowdown turns out to be worse than expectations, short-term bond yields could fall further.
CME Fed Watch Tool
The treasury market has experienced significant volatility because of the banking crisis and deteriorating economic data. The 2-year yield fell from a peak of 5.07% before the crisis to 4.02% by the end of March. This is reflective of the expectation that the Fed is going to ease monetary policy over the next 2 years.
Bloomberg
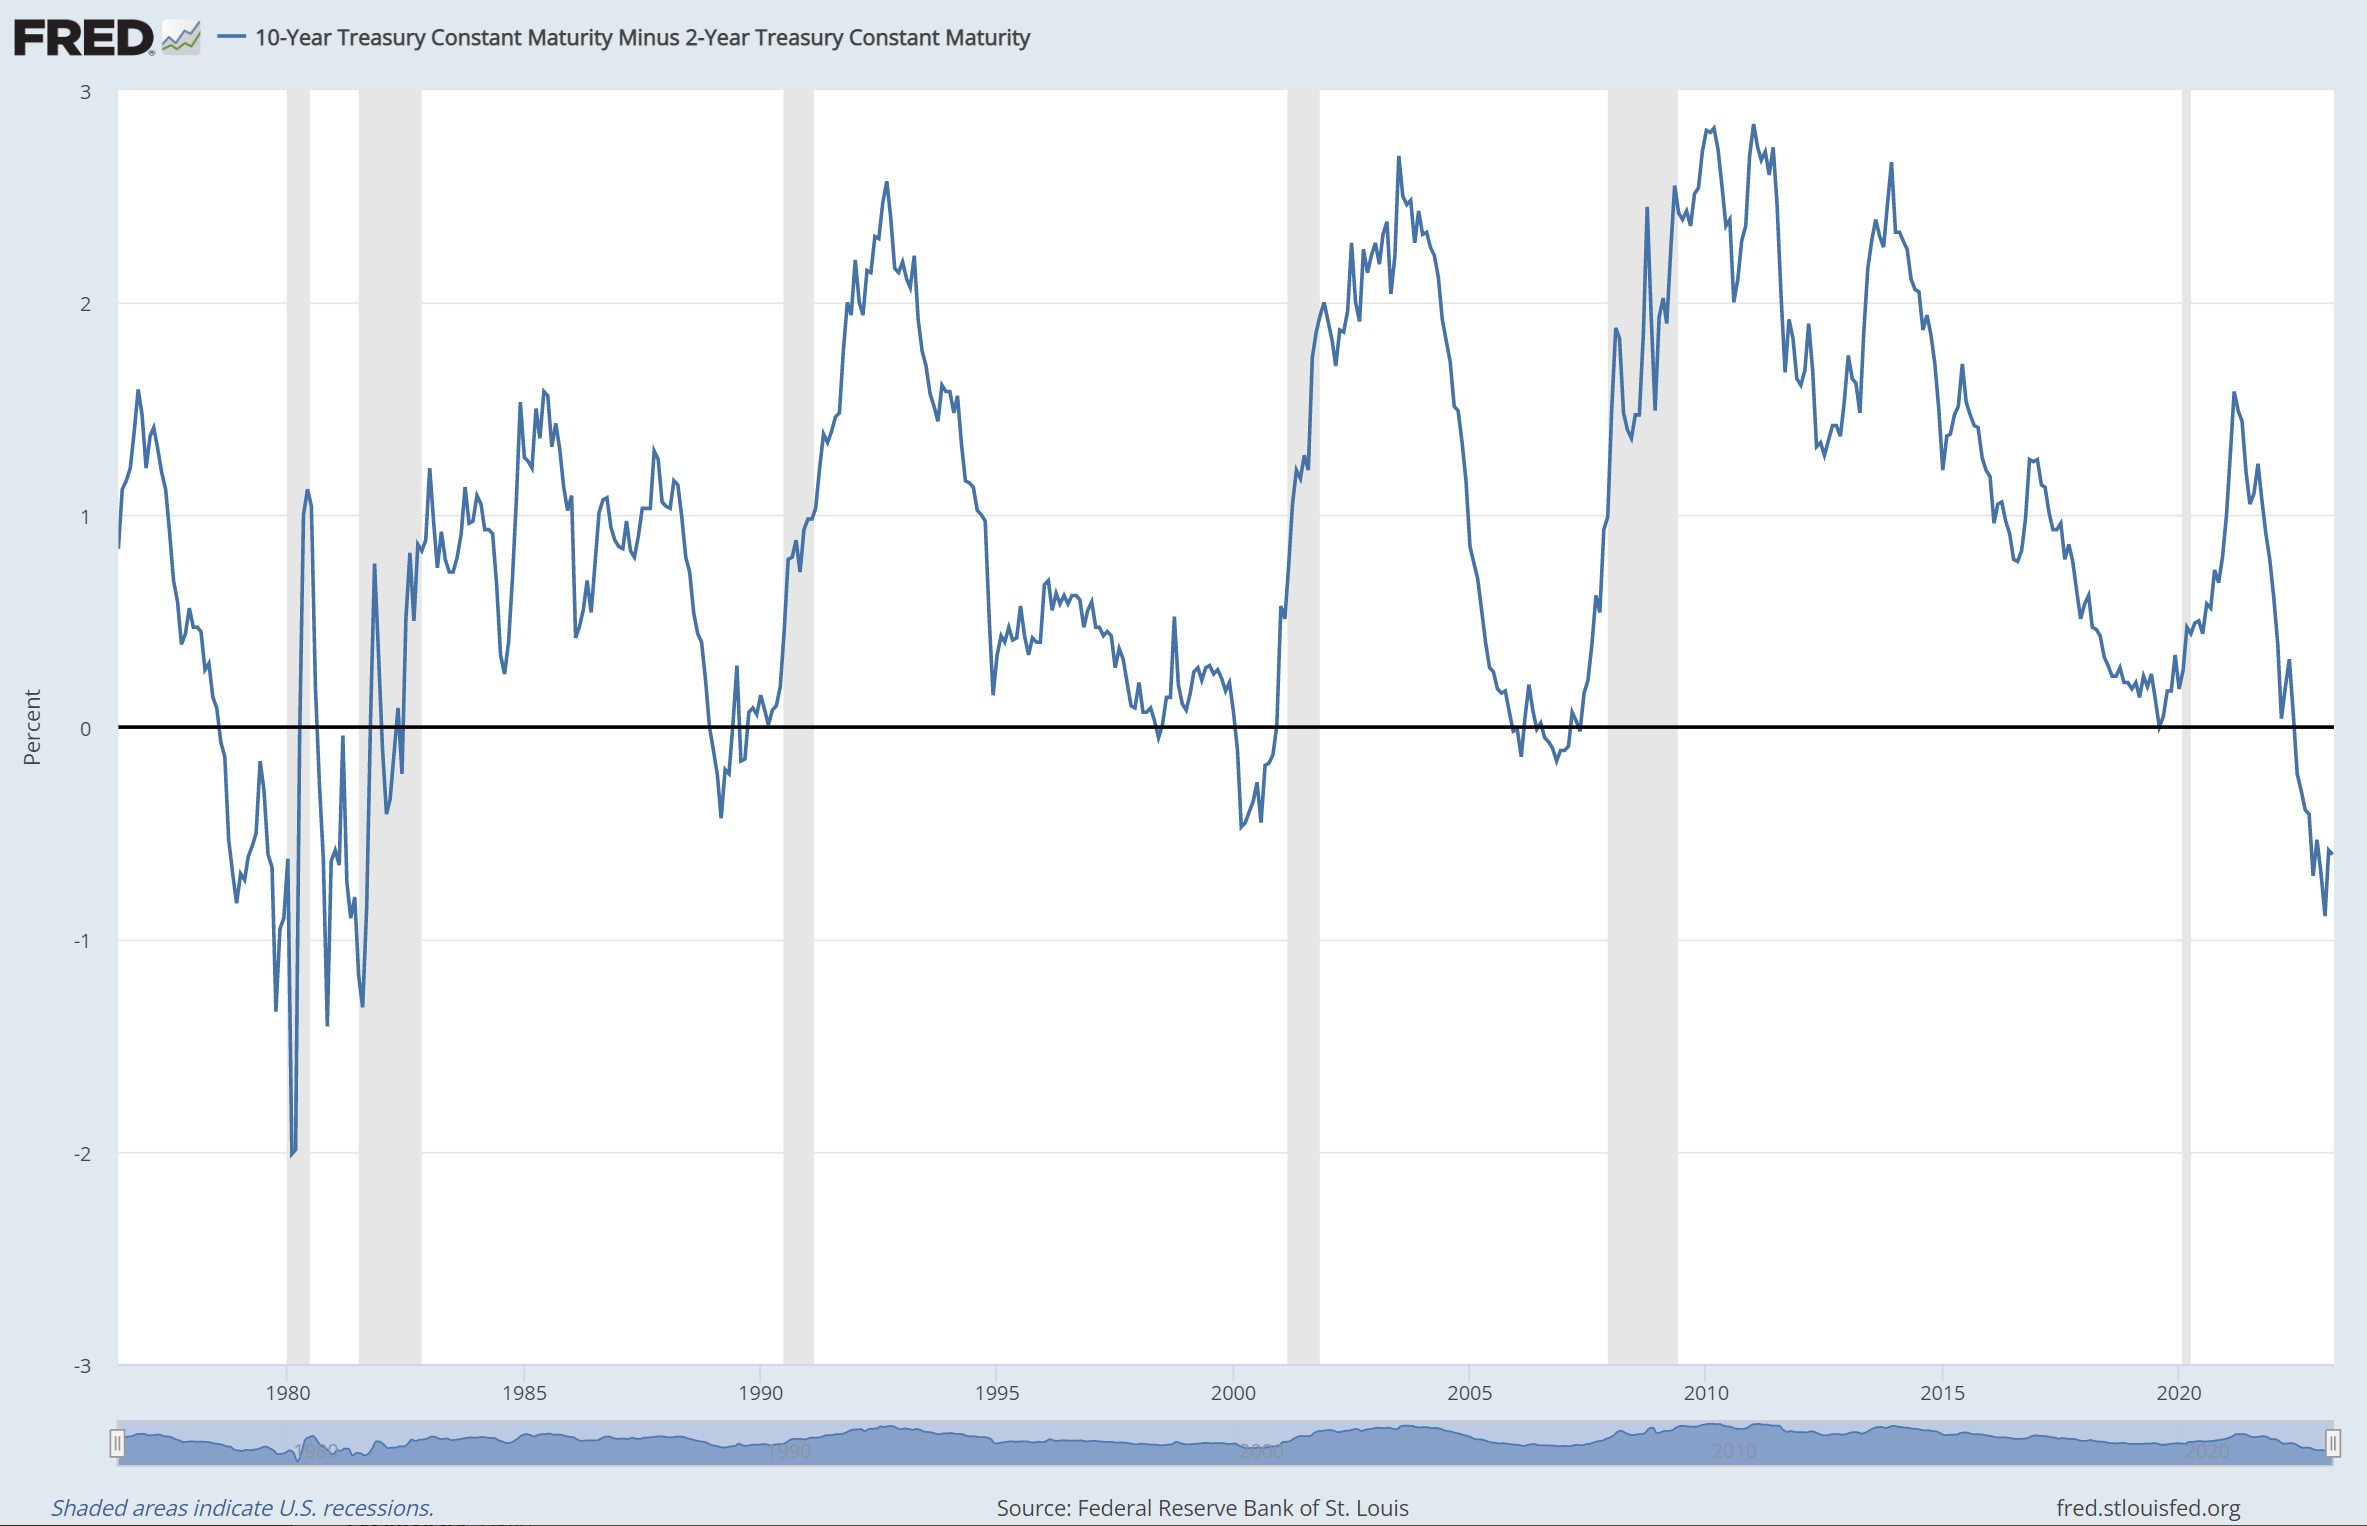
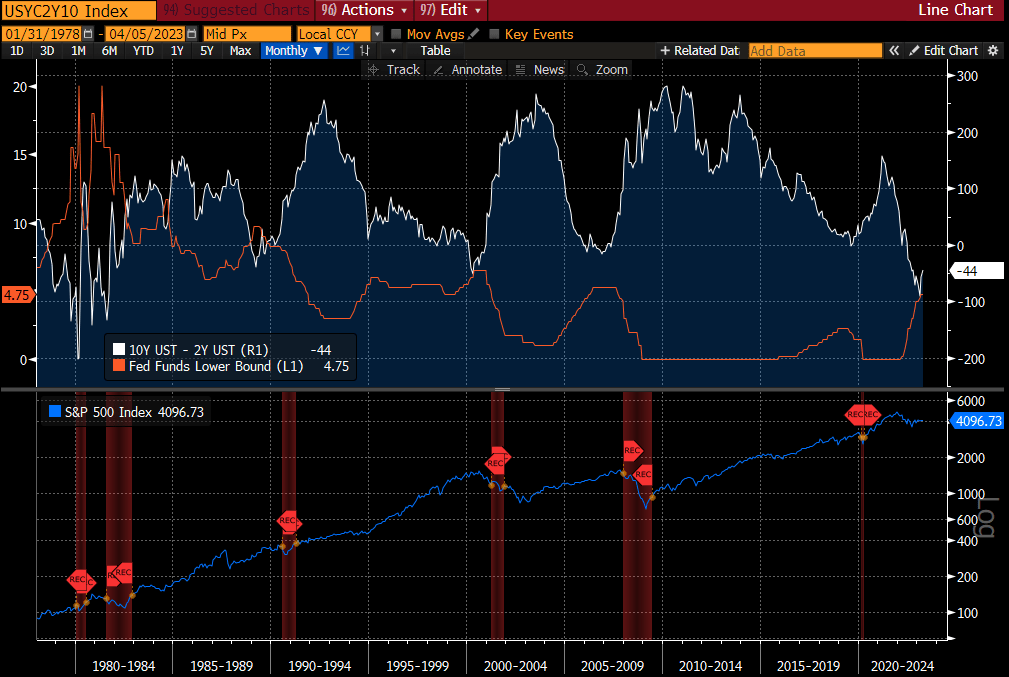
The spread between the 10Y and 2Y U.S. Treasury Bonds has been negative ( inverted) since July of 2022. As is common belief, when the spread between these government bonds goes negative, it is a strong predictor of U.S. recession. However, the recession tends not to happen until 6 months after the spread goes from negative to upward sloping. In recent weeks the spread between the 10 year and 2 year has gone from -108 basis points to -60 basis points. If this spread were to turn positive we would view that as a major signal that a recession is highly likely in the next 6 months.
Federal Reserve Bank of St. Louis
Leading indicators point to a significant slowdown in hiring and government assistance that has insulated consumers from inflation is going away.
Equity markets feel like they may have some downside potential and we have hedging ones portfolio with IWM or SPY puts or shorting either ETF. Additionally, given the level of rates and the state of the economy, we like longer-term bonds. Based on the behavior in previous recessions, I believe the iShares 7-10 Year Treasury Bond ETF ( IEF ), may rally 5% to 10% in a recession. While you collect dividends, there's potential for some capital appreciation if interest rates fall because of a recession.
Weakening Consumer
Consumer spending seemed to start out the year strongly. Real consumer spending rose 2.7% and 2.5% in January and February, respectively, which came as a surprise to the market. These data points shifted sentiment and resulted in talks of the potential for a no landing scenario for the U.S. economy.
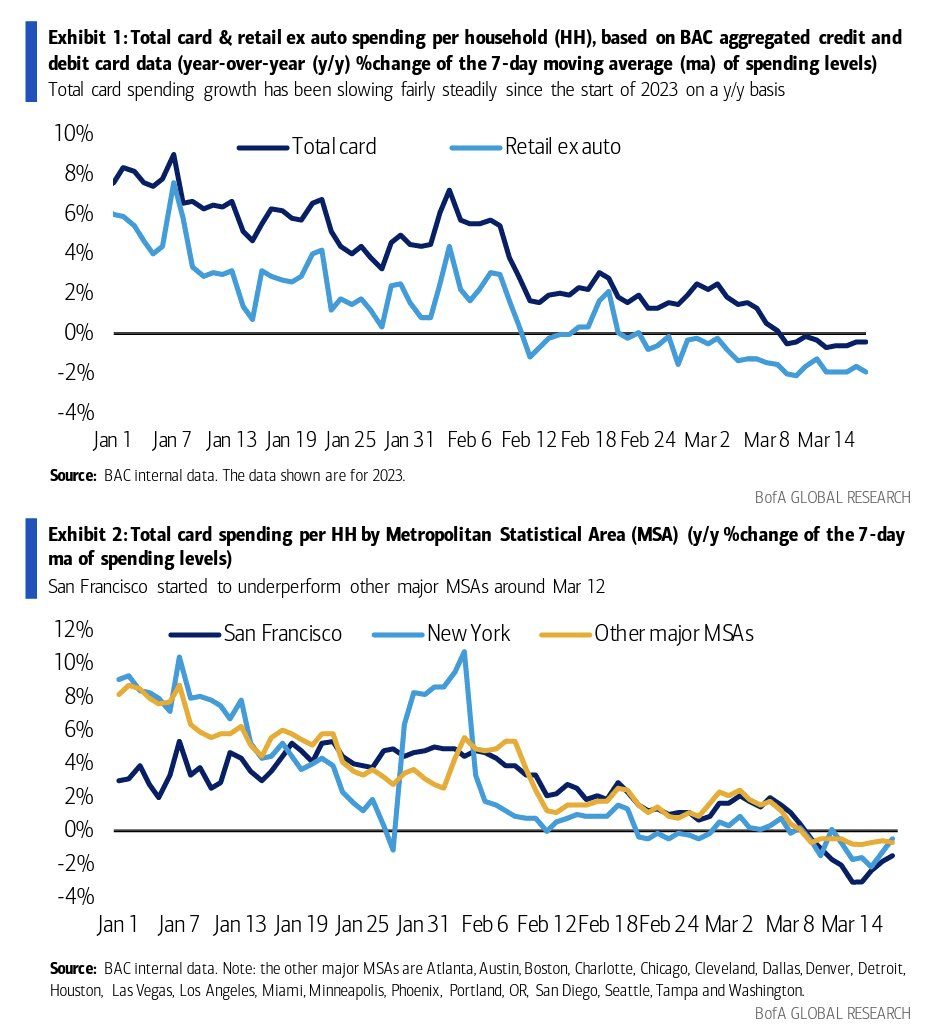
However, in recent weeks higher frequency data point to the consumer showing signs of weakening. Proprietary card spending data from Bank of America shows that card and retail spending ex. Auto have fallen precipitously during the year.
BofA Global Research, Image Obtained From Twitter
The drop in spending is somewhat alarming. Importantly, the above chart doesn’t include the potential hangover effects from the banking crisis that occurred during the 3 rd week of March.
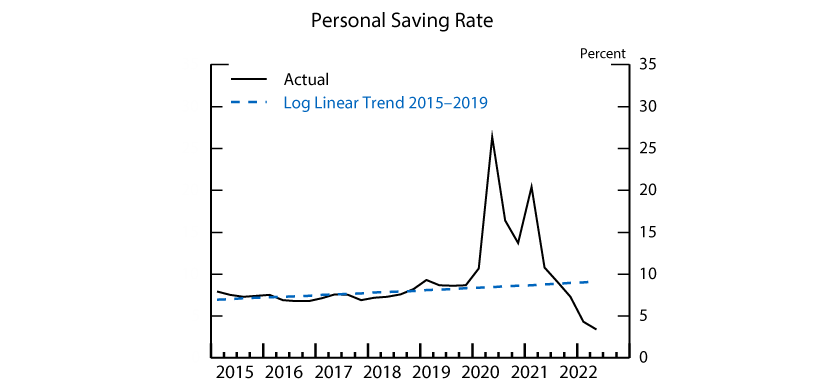
Consumers also seem to be quickly running out of resources to fund their spending as their purchasing power has been eroded by inflation. Consumer credit has now returned to implied pre-pandemic trend levels. Savings rates remain well below their long-term averages. Some economists estimate that a significant amount of the excess savings accumulated during the pandemic will be gone by June of this year.
It does not seem likely that things are going to get better for the consumer anytime soon. Weaknesses are also starting to show up in the labor market. The NFIB Small Business Hiring Plans Index has been in a downward trend for over a year and is now back to pre-pandemic levels. Most Americans are employed by small and medium businesses, so this indicator is important as it relates to the ability for people to get jobs are finding new higher paying ones.
NFIB
The Regional Fed Surveys also indicate a significant decline in expectations for new hiring in the next six months. The average of the regions the Fed surveys is at the lowest level since the pandemic.
Federal Reserve, Author's Calculations
Excess savings are also deteriorating rapidly and look to be gone by late 2023.
The data is pointing to a deterioration in the U.S. labor market and in consumer spending. It seems that things are only likely to get tougher for consumers as key pandemic era stimulus programs are set to end in March and April.
Pandemic Era Assistance Ending
One of the main factors that has supported consumer spending since the pandemic was government assistance that was provided by various programs. However, many of these programs have expired recently or are about to expire soon, which will have a negative impact on the consumer.
As part of the federal government spending bill that was passed in December 2022, Congress voted to terminate the enhanced SNAP benefits that helped millions of low-income households buy food. The bill also lifted the moratorium on Medicaid redeterminations that could result in many beneficiaries losing their coverage.
Moreover, the public health emergency declaration is scheduled to end on May 11th, which will likely affect other programs (such as the student loan moratorium) that were tied to its duration. We believe that these changes will create significant challenges for the consumer sector in the coming months.
Falling Inflation
“Inflation is known to shoot up like a rocket and then come down like a feather.”
-Patrick Harker, Philadelphia Fed President
The U.S. economy is experiencing a slowdown in inflation because of the ultra-tight monetary policy implemented by the Fed. The Core PCE Price Index (the Fed's preferred measure of inflation), which excludes food and energy prices, has declined from 5.4% in February 2022 to 4.6% in February 2023.
The Fed has raised its benchmark interest rate to a range of 4.75% to 5.00%, which is just below the current inflation rate as measured by the PCE Price Index. Historically speaking this has been an important threshold in sufficiently bringing down demand to bring inflation under control. Note that balance sheet reduction also adds additional tightening.
Based on the underlying data, the inflation outlook for the US economy is mixed. Goods inflation has moderated significantly while services inflation remains elevated. Durable goods spending, which has been the main driver of goods inflation over the last few years, has slowed down considerably from its peak in mid-2022, reflecting lower demand for items such as cars and furniture.
One area we are zooming in on is food prices. While the Fed generally pays less attention to food inflation, higher food prices impact consumers’ ability to spend money on non-essentials, which drives economic growth. Food inflation continues to be high due to supply chain disruptions and higher agricultural commodity prices. It is expected that food prices will ease over time as commodity prices have already declined from their highs. However, any disruptions to global food supplies could re-kindle the issues caused by the war in Ukraine.
Overall, goods inflation is likely to trend lower in the coming months.
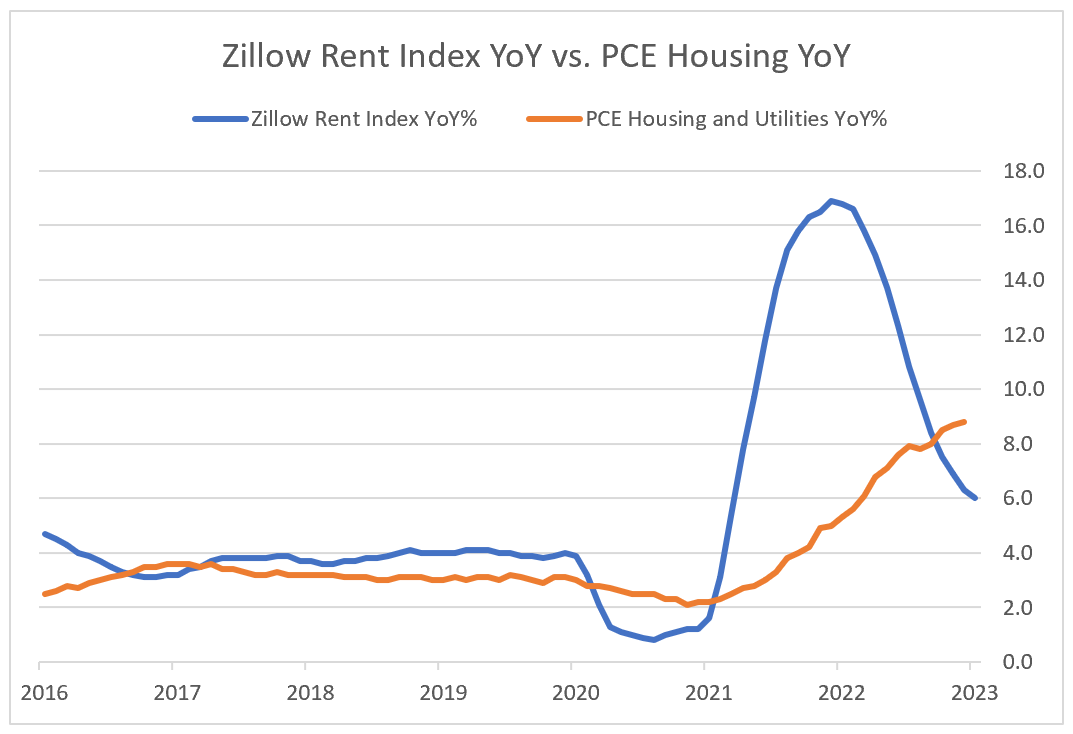
However, services inflation is still running above 5%, mainly due to the persistent increase in housing costs. Housing accounts for a large share of the PCE index and has been rising at a faster pace than other components of the index.
There are some issues with the government’s methodology that may overstate the true level of housing inflation. The official data sources lag more timely indicators such as the Zillow Rent Index.
According to our estimates, housing inflation may be contributing about 1.5 percentage points to the overall PCE inflation rate. If we adjust for the lags in the PCE housing data, PCE inflation may be closer to 4% . While this is still above the Fed's 2% target, Chair Powell has indicated he is aware of the lag issues with the data, which could the Fed pivot to a less hawkish policy.
Relationship between M2 Money Supply and Inflation
The Fed's policies to fight inflation have had a significant effect on the M2 money supply. For the first time since the 1940s, the M2 money supply has declined compared to a year ago.
This occurrence is potentially important because the M2 money supply has historically had an impact on the direction of the Consumer Price Index. The graph below from Bloomberg shows that when the M2 money supply grows faster, CPI tends to rise as well. And when the M2 money supply grows slower or contracts, CPI tends to fall or moderate.
Bloomberg
Of course, this relationship is not perfect, because there are other factors that affect inflation such as the supply of goods and services. For example, between 2010 and 2019, the M2 money supply grew at an average rate of about 5.9%, but CPI only grew at an average rate of about 1.7%. This is because during that period, there was a surge in U.S. oil production and China's manufacturing capacity, which lowered the costs of energy and many consumer goods.
However, the relationship between M2 and inflation is still important because the decline in M2 is likely putting downward pressure on inflation. Declines in the rate of M2 growth have also coincided with weaker equity returns.
The decline in the M2 money supply along with the composition of inflation data supports Fed Funds futures market’s implied policy levels. If anything, this view may be too optimistic, and the Fed may have to cut rates more than the market expects.
Is it Time to Buy Equities or Bonds?
The prospect for peak rates has sent growth stocks soaring. After rising 7% year-to-date in the first quarter of 2023 (the best quarter since 2019), we are wondering whether we are at the beginning of a new bear market and should be buying equities or if this is just another bear market rally. Simultaneously, bonds yields are highly attractive on a nominal basis versus the previous 20 years.
In light of the banking crisis, mega cap tech companies have become a place to hide out. The NASDAQ Composite was up 6% in March, a month in which the 2nd and 3rd largest bank failures in U.S. history occurred. The NYSE FANG+ index was up 13%, driving the entire return of the market. In contrast, the RSP, an ETF which represents the equal weighted S&P 500, was down 1% in March.
The rising prospect for a peak in rates is driving up the market. In hindsight, the "path of max pain" was for equities, and in particular technology stocks, to go higher with most market participants underweight the sector and expecting a recession this year. The move higher in tech stocks likely forced managers to chase returns and hedge funds with short positions to cover, driving stocks even higher.
We are relying on the spread between the 10 Year U.S. Treasury and the 2 Year U.S. Treasury (the "10s-2s curve") as our main indicator for when to allocate more towards equities. The below chart illustrates why we remain cautious investing further in equities given the state of the economy. Equity markets tend to rally as the 10s-2s curve goes from upward sloping to flat to inverted. This is because the economy is typically strong and the Fed is trying to prevent the economy from overheating by raising short term rates.
However, the economy tends to hit a tipping point because of the stress that tighter financial conditions are putting on the economy. The bond market begins to price this in and it is expressed via the 10s-2s spread curve going from being inverted to upward sloping. Historically this has signaled that the economy is going to enter a recession within a few months. One can see this from the graph below. Prior to each recessionary period where there is a major decline in equities, the 10s-2s curve goes from inverted to upward sloping a few months before the recession starts.
The current state of the S&P 500, the 10s-2s curve and Fed Funds looks eerily similar to previous cycles, hence our cautious view on the outlook for equities.
It’s not out of the question that at some point during 2023, the 10s-2s curve could become upward sloping again. It is a completely possible scenario that markets continue to rally as this starts to occur. But we are willing to bet further that when this curve goes positive a recession is highly probable, causing a significant decline in equity markets. Given that the market is trading at 18x, we think it’s not out of the question to see the S&P 500 below 3,500 within a few months of the 10s-2s curve turning positive.
It “feels” like equities have an asymmetric risk to the downside, while bonds have potential upside. Shorting an S&P 500 ETF ( SPY ) and/or Russell 2000 ETF ( IWM ) or expressing it through options against a long position in the IEF as a 6-to-9-month trade could be interesting.
As the economy weakens there should be a bid for longer-term treasuries while investors who appear to be driving up equities could become sellers. As the Fed begins to cut rates, short-term yields should fall further, resulting in some capital appreciation.
Conclusion
The first quarter of 2023 saw a rebound in equities as investors bought the dip after a turbulent 2022. However, the U.S. economy continues to deteriorate. The stress on regional banks is likely triggering a credit crunch that could hamper economic growth. Moreover, the expiration of government stimulus and relief programs makes many consumers more vulnerable to high rates inflation.
The S&P 500 4,150 feels unsustainable. The market is trading at a premium P/E multiple to its historical averages and relies heavily on the performance of the FANG+ stocks. These stocks have not seen any real step change in their fundamentals, most of the move has come from hype of new technologies driving multiple expansion. For example, Nvidia ( NVDA ) have seen large increases in their stock prices because of their association with AI. The stock’s P/E multiple has risen 30% year-to-date from 31x to 43x.
A correction in the market of 15% to 20% in 2023 would not surprise us. This would bring the S&P 500 down to 3,300 to 3,500. We also anticipate a reversal in the interest rate cycle, as the Fed will have to cut rates again by the end of 2023 to stimulate the economy and prevent a recession.
As the U.S. economy continues to worsen and the prospect for rate cuts increases 7-to-10 year bonds should perform well in this environment. For example, during the 2008-2009 recession the IEF rose 15.6% between July 2007 and March 2008, while the S&P 500 fell 47%. in 2020, the IEF was up 11% during the first six months, while equities decline ~31% from peak to trough. We believe we are entering (or are getting close to) an environment where a similar moves in the IEF and the S&P 500 are possible. Hence, we favor a long position in the IEF and a short position in the S&P 500.
For further details see:
Rates Are Close Peaking; I Am Cautious On Equities