CHMI - Rates Plunge High Yields At Risk
2023-12-28 07:28:29 ET
Summary
- Some agency mortgage REITs have high price-to-trailing-book ratios, while others do not.
- Q4 2023 has been a favorable quarter for the sector, with MBS outperforming Treasuries and swaps.
- One in particular has a high price-to-book ratio. The price-to-current-book isn't nearly as bad, but it is still materially higher than peers.
- I'm attributing that to investors not understanding how earnings work or how hedges impact earnings.
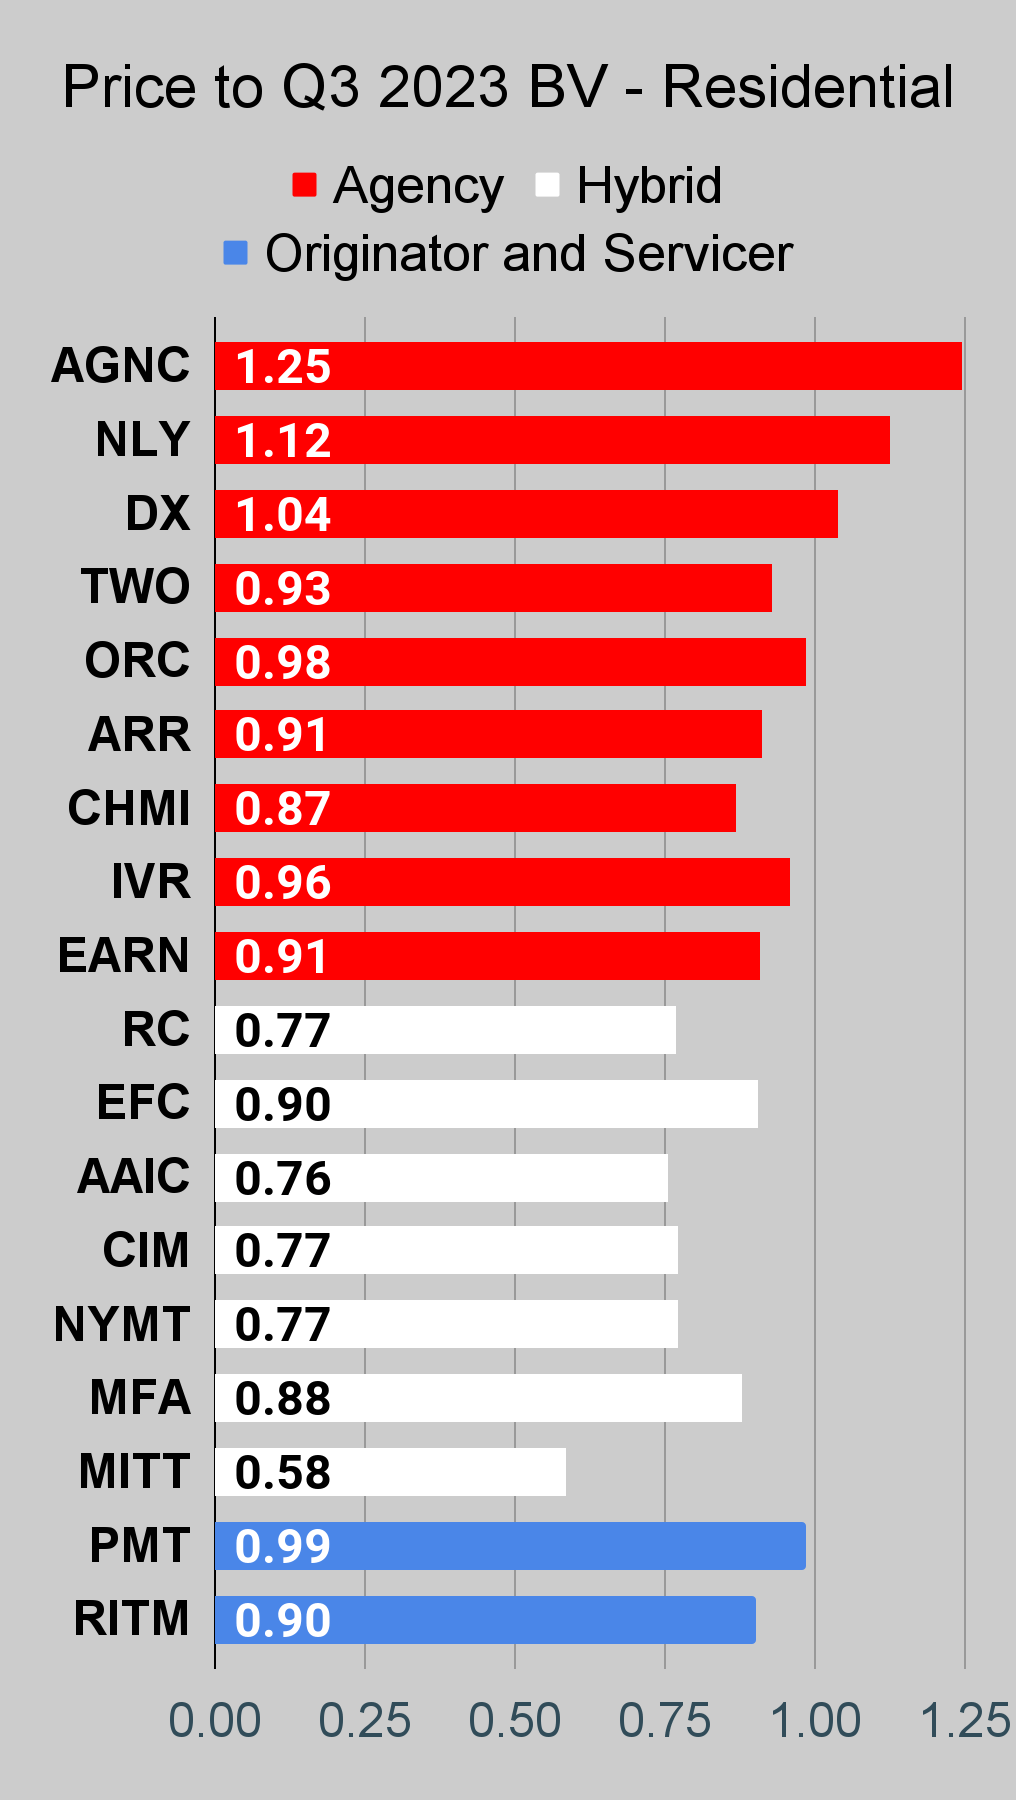
The price-to-trailing-book ratio is exceptionally high for some agency mortgage REITs. Not so much for others.
It's interesting to note that Q4 2023 has been a very favorable quarter for the sector. It didn't look that way in October when rates were going higher. In October, we saw higher rates combined with big spreads between MBS and hedging rates. That's awful for book value, though it is nice for reinvesting principal. Since then, we've seen MBS outperforming Treasuries and swaps. That's been very favorable for book value. It's not guaranteed to happen when rates decline, but the spreads were very wide at that point.
If you expect rates to rise indefinitely, then fixed-rate MBS are scary. If rates keep going up, then prepayments fall, and the loans are outstanding for longer. However, rates have plunged since the 10-year Treasury hit 5%. Recently, it moved just under 3.9%.
Update: I wrote those words last night. As of 12/27/2023 (evening), the 10-year Treasury yield dropped under 3.8%.
When you see AGNC Investment (AGNC) with a price-to-trailing book ratio of 1.25 in the charts below, it helps to consider that the price-to-current-book ratio is probably about 1.15. That's still very high, but it is far less severe than 1.25.
Update: Prices increased from $10.07 to $10.13 today (up 0.6%). That would push the ratio to trailing values a bit higher. However, rates were down. I'm ballparking that the net impact of higher MBS values and lower hedges probably pushed BV slightly higher on the day. Consequently, price-to-current book is probably still comparable to the 1.15 value I listed while preparing the article.
Yes, a difference of 10% matters. That's equivalent to a significant chunk of the annual dividend yield.
I could warn investors every week that the normalized Core EPS should struggle within 2024. But would it matter?
AGNC has a longer name for the metric, but it's the same thing. This is from the Q3 2023 presentation:
That's the value that I would expect to see struggling. That could be quite a bit lower by the end of 2024.
Please don't ask me to lay out every quarter individually. I know some readers want to hold until the very last day before it falls. Stop being cute.
Others want to hold until after a dividend cut is announced. That's literally never the best investment strategy.
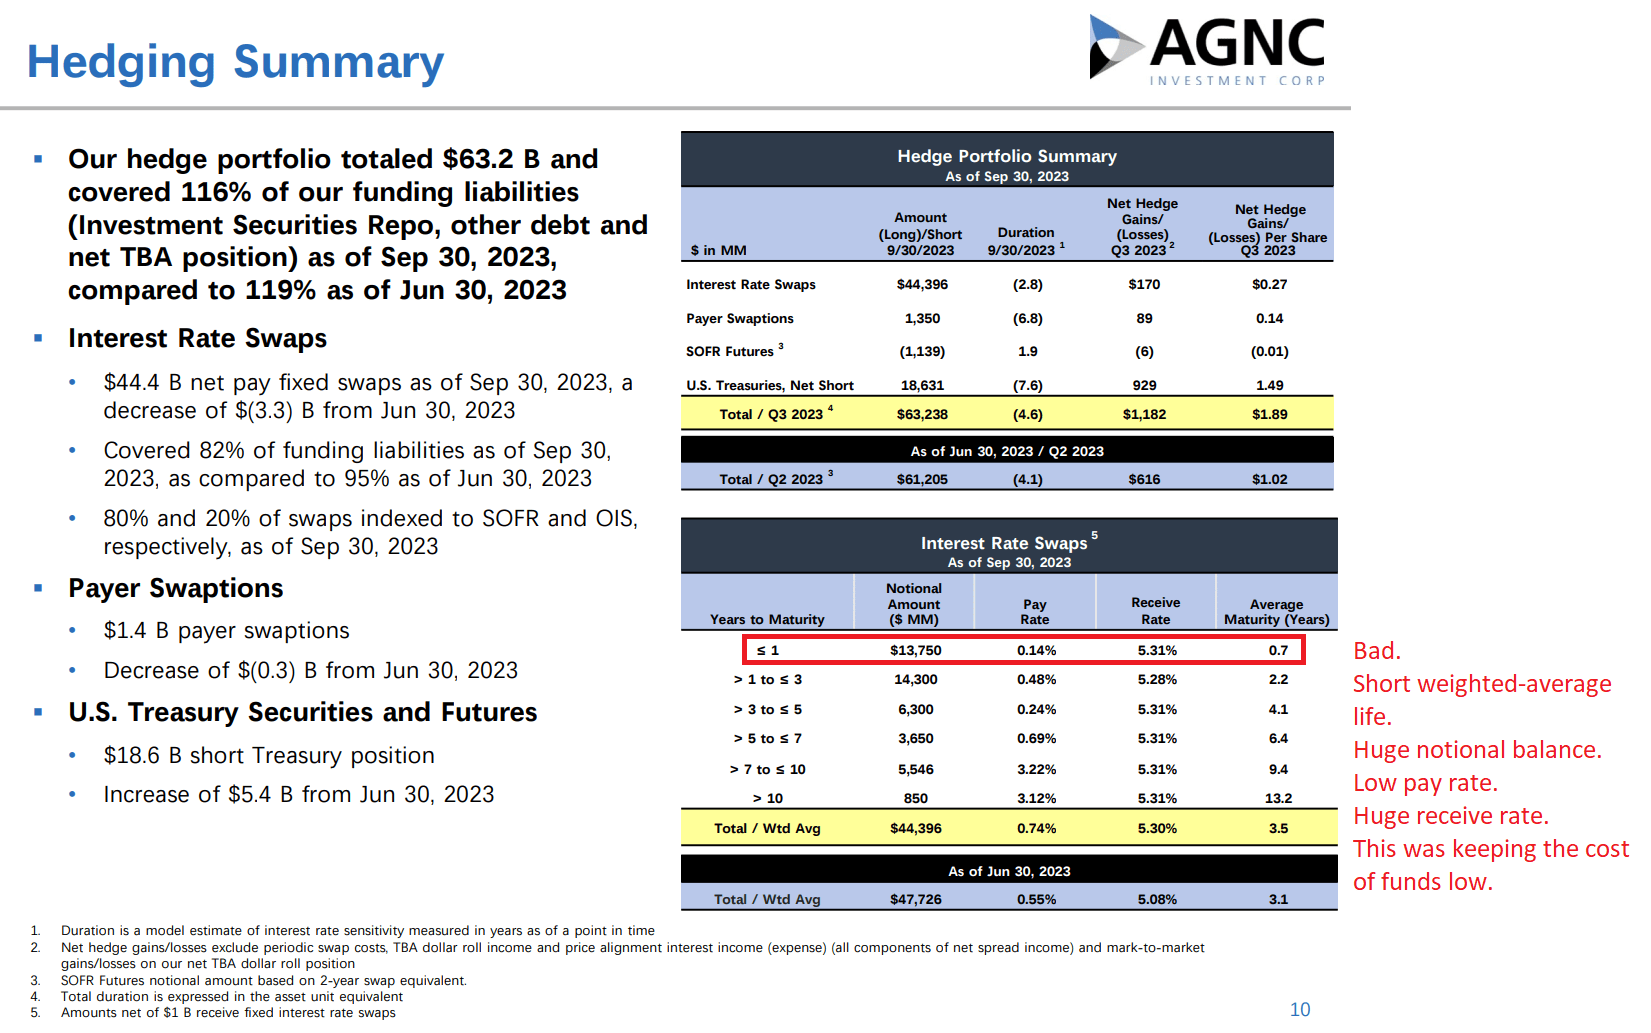
Want me to make it real? Here's the evidence that the hedges are running out:
How hard was that? I literally just screenshot the presentation and drew on it. Not hard.
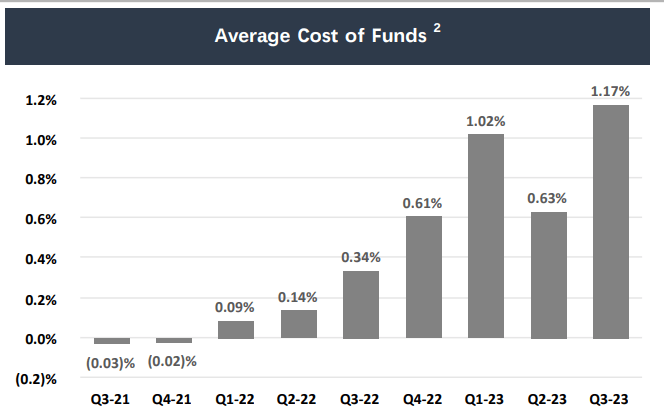
As the swaps wear off, the average cost of funds goes up. You can see it in this image:
That's the part that should be challenging.
The average yield on assets was climbing.
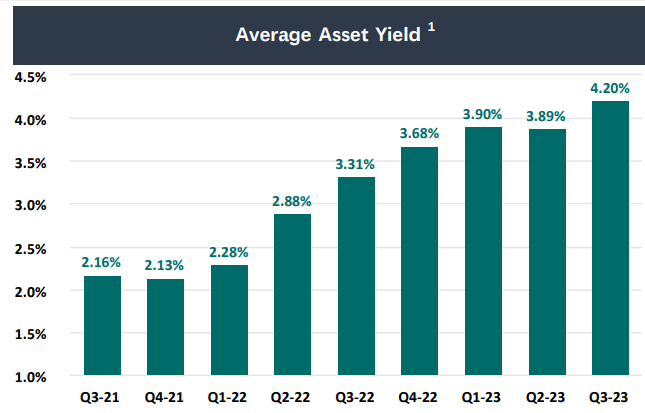
That looks nice, but to continue creating that growth in the average asset yield they would need to dump off older positions (at big losses) and reinvest the capital. That wouldn't really create value for shareholders, but it would give the appearance of the yield on assets continuing to climb.
The difference between the two is the net interest spread.
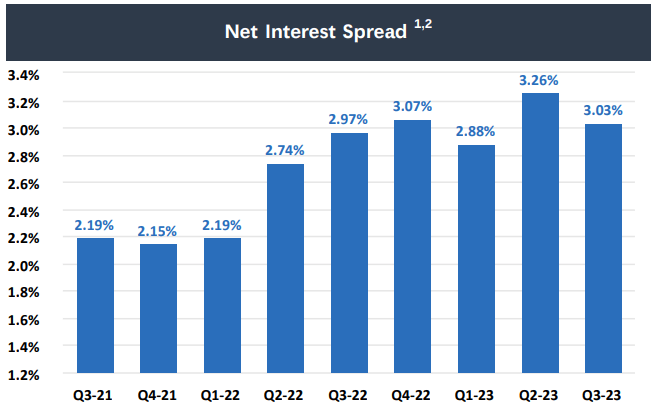
It looks really impressive how these values kept getting higher. This gets some investors really pumped up about the future.
Some investors think that lower rates are great for mortgage REITs. To an extent, they certainly can be. However, if mortgage rates are dropping, how much can the yield on assets continue to increase?
Think it will be offset by a lower cost of funds? Remember that short-term rates are over 5% today and yet AGNC reported an average cost of funds at just 1.17% for the prior quarter. No, the average cost of funds will not be lower in 2024 than it was in 2023. Not unless AGNC has a dramatic overhaul in their leverage and strategy. That's very unlikely. So, just plan on the idea that it won't happen.
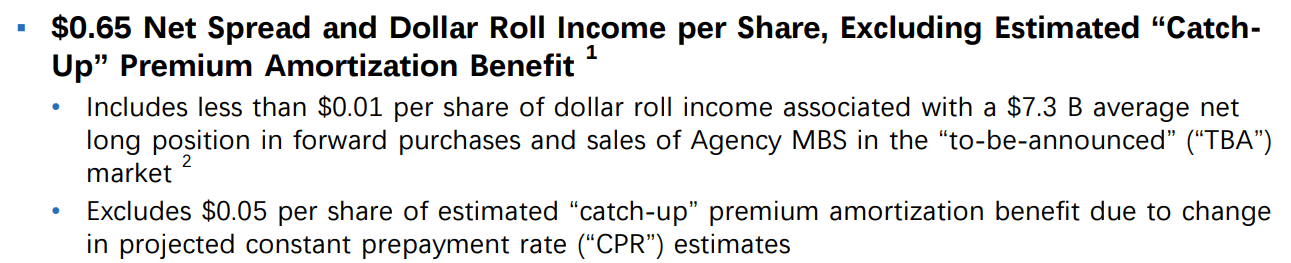
How about net spread and TBA dollar roll income per share?
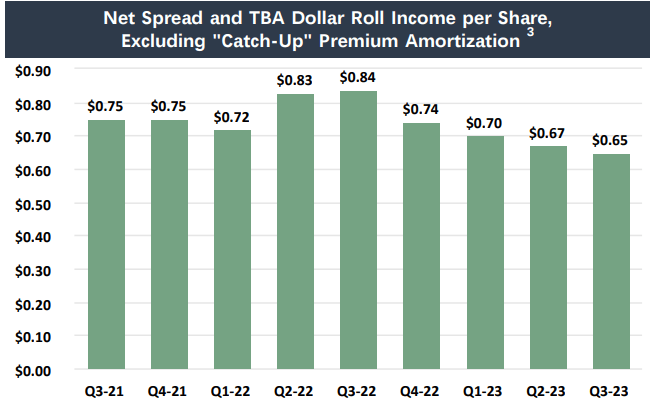
Even though the net spread was higher in percentage terms, the income has been declining. Why?
Primarily because book value was declining . When AGNC's book value was around $16.00, they could generate rough income with a smaller spread. At the end of Q3 2023, book value was 50% lower than it had been only 2 years earlier.
However, there is one positive thing.
While interest expense should get worse as the hedges run out, you'll most likely see a recovery in book value per share.
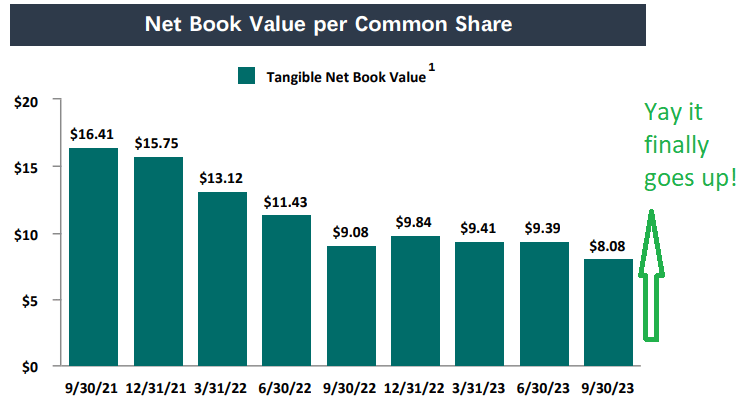
Mind you, a recovery does not mean it will reach the level seen on 6/30/2023. No, not that. But it should still bounce higher compared to $8.08 from the last report. So that's something.
Why Is AGNC So Expensive?
I attribute it to the huge earnings yield. Investors who don't understand how to evaluate earnings in the sector may simply look at forward earnings and decide AGNC is clearly the best and smartest mortgage REIT of all time. They are not. They aren't bad. But there is nothing particularly unique about their strategy. Their results are actually not so different from some of their peers, except for the hedging structure causing earnings to appear much more impressive.
Could we dive into that further? Sure. Should we? Probably not. It does nothing for page views.
My view on AGNC is bearish. While the gains to BV for Q3 2023 look great, the price-to-current book is still painfully high. Sure, a 1.15x price-to-book isn't nearly as bad as a 1.25x price-to-book. However, the risk/reward profile is still unfavorable.
On the other hand, there are several mortgage REITs trading at lower price-to-book ratios. Many of them offer more favorable risk/reward profiles.
To be clear, there were times when the risk/reward ratio was even more unfavorable. For instance, at the time of our last bear call, the risk/reward ratio was worse.
The Myth
Investors think lower rates are salvation for mortgage REITs. That's hyperbole. Lower rates were beneficial when they broke the massive trend higher in interest rates. That was really good. Rates falling helped, but the mortgage REITs don't actually want rates to plunge indefinitely either. If rates continue to fall, all those new mortgages with higher coupon rates will turn into prepayments.
That's a significant risk for the agency mortgage REITs.
This isn't just a risk factor for AGNC. I'm simply highlighting them because they have the highest price-to-book ratio and it appears to be driven by investors dramatically overvaluing the concept of "earnings". When investors don't understand how the earnings are calculated and how to forecast for expiring hedges, they end up betting on a game where they don't know the rules.
Mortgage REITs can be great investments for a while. But you don't hold them forever. It's a date, not a marriage.
Stock Table
We will close out the rest of the article with the tables and charts we provide for readers to help them track the sector for both common shares and preferred shares.
We're including a quick table for the common shares that will be shown in our tables:
| Type of REIT or BDC |
| Residential Agency |
| Residential Hybrid |
| Residential Originator and Servicer |
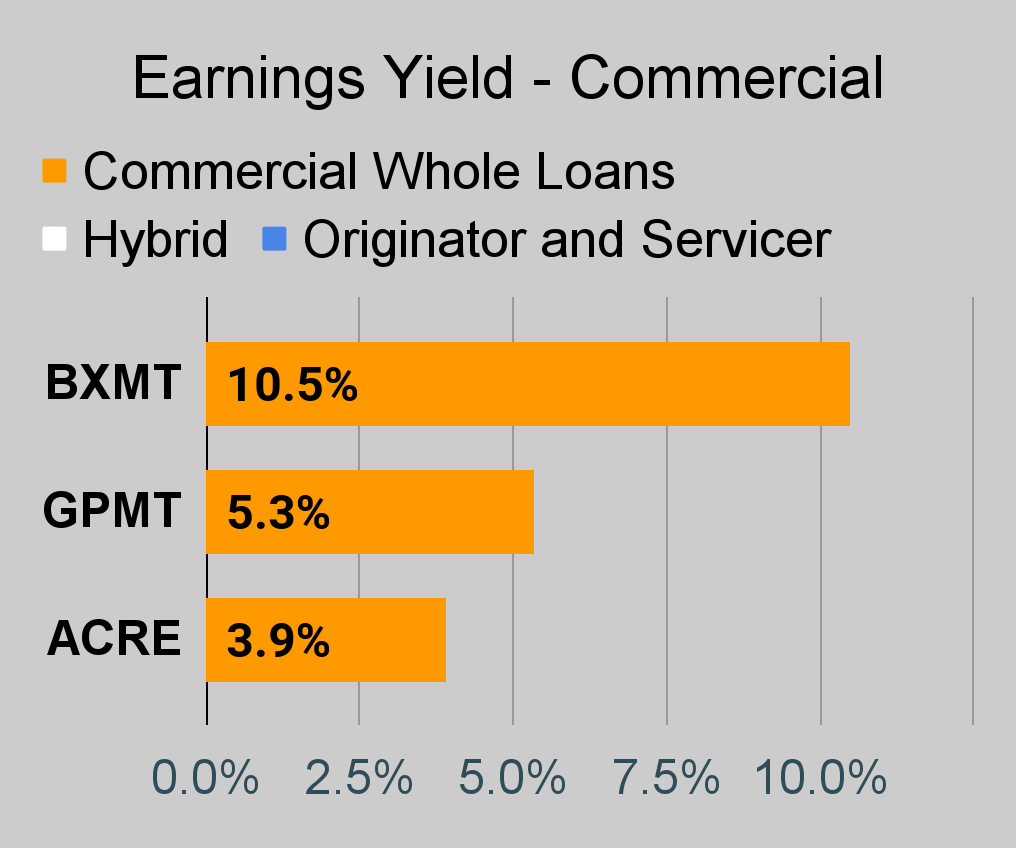
| Commercial |
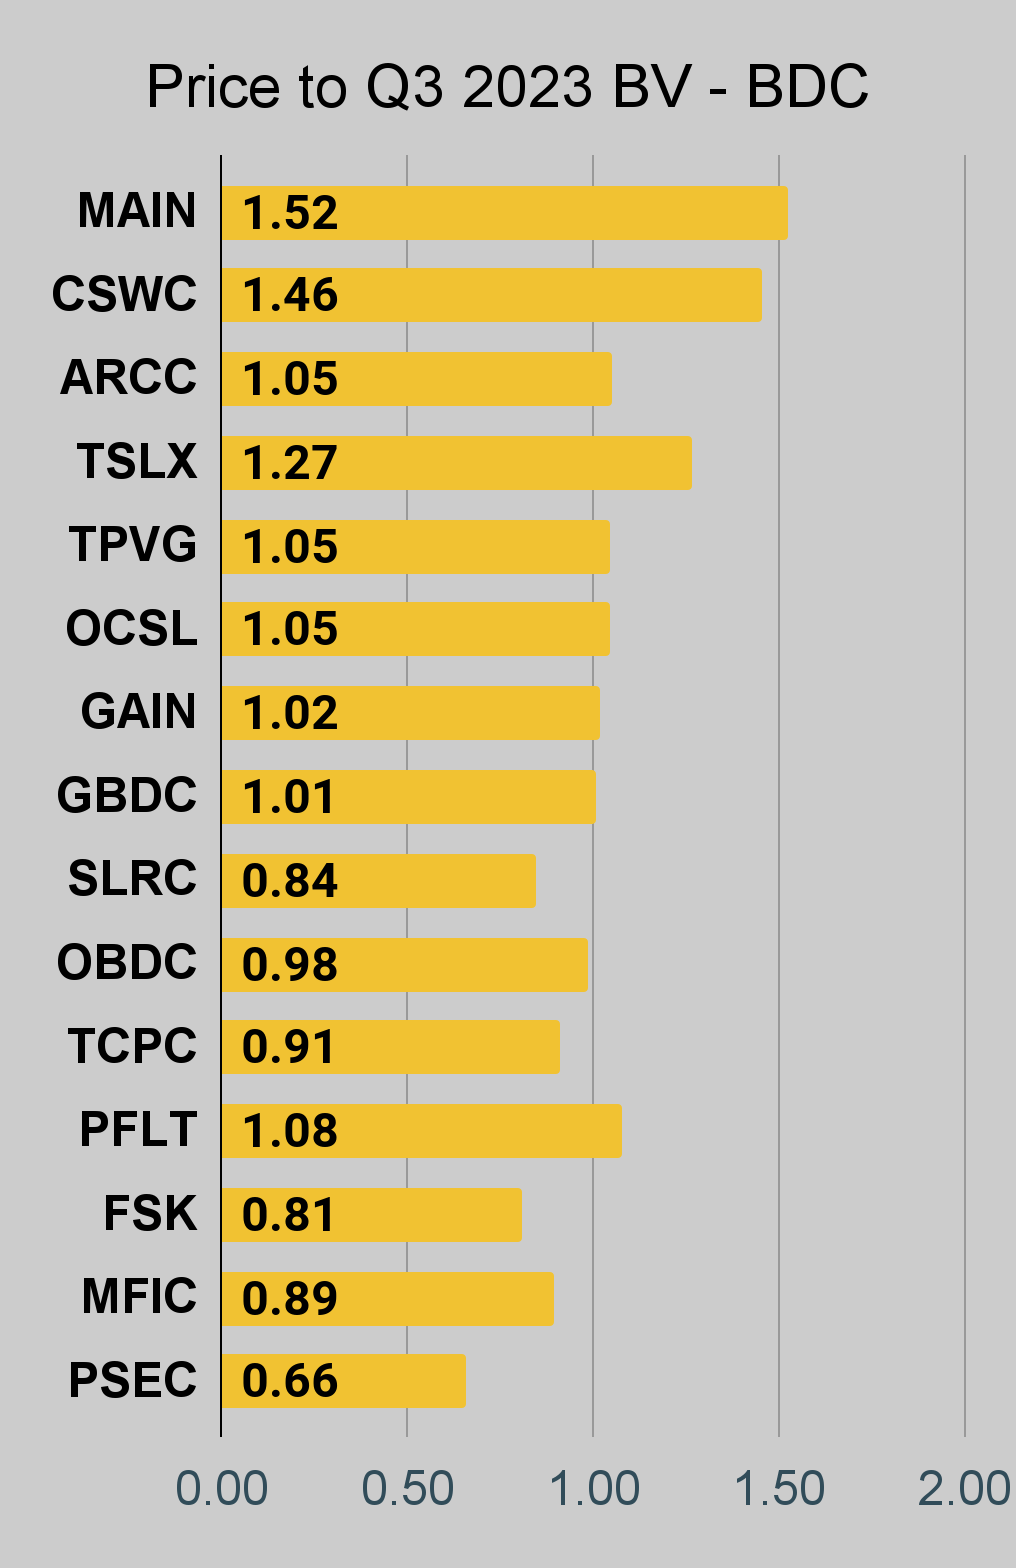
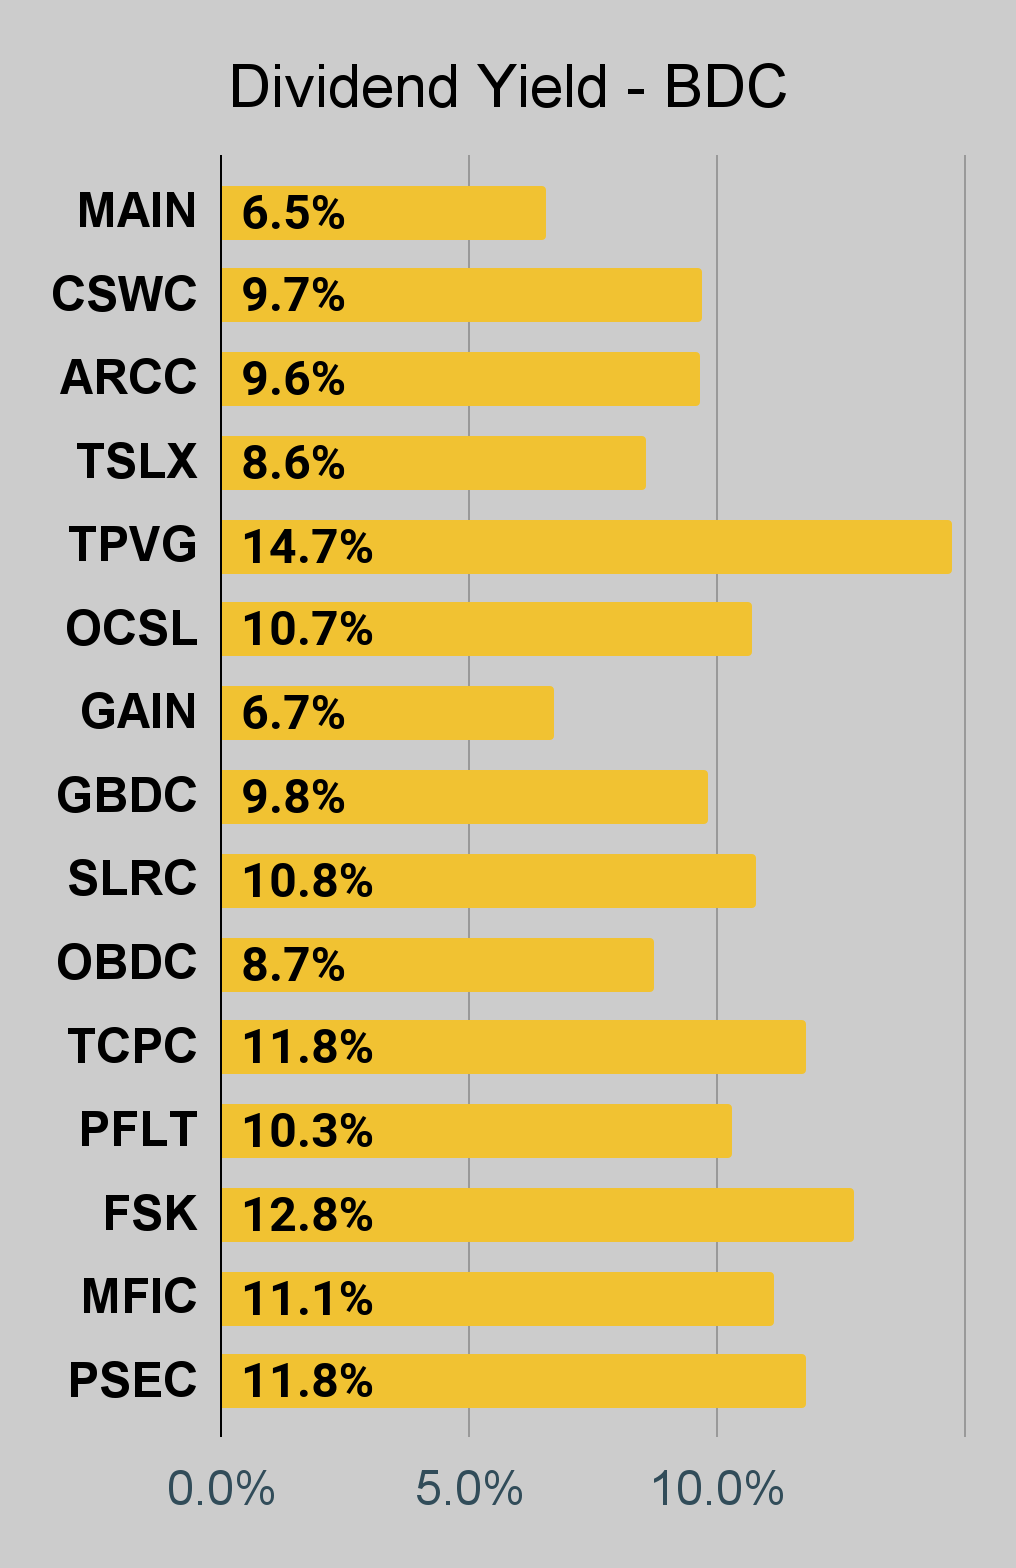
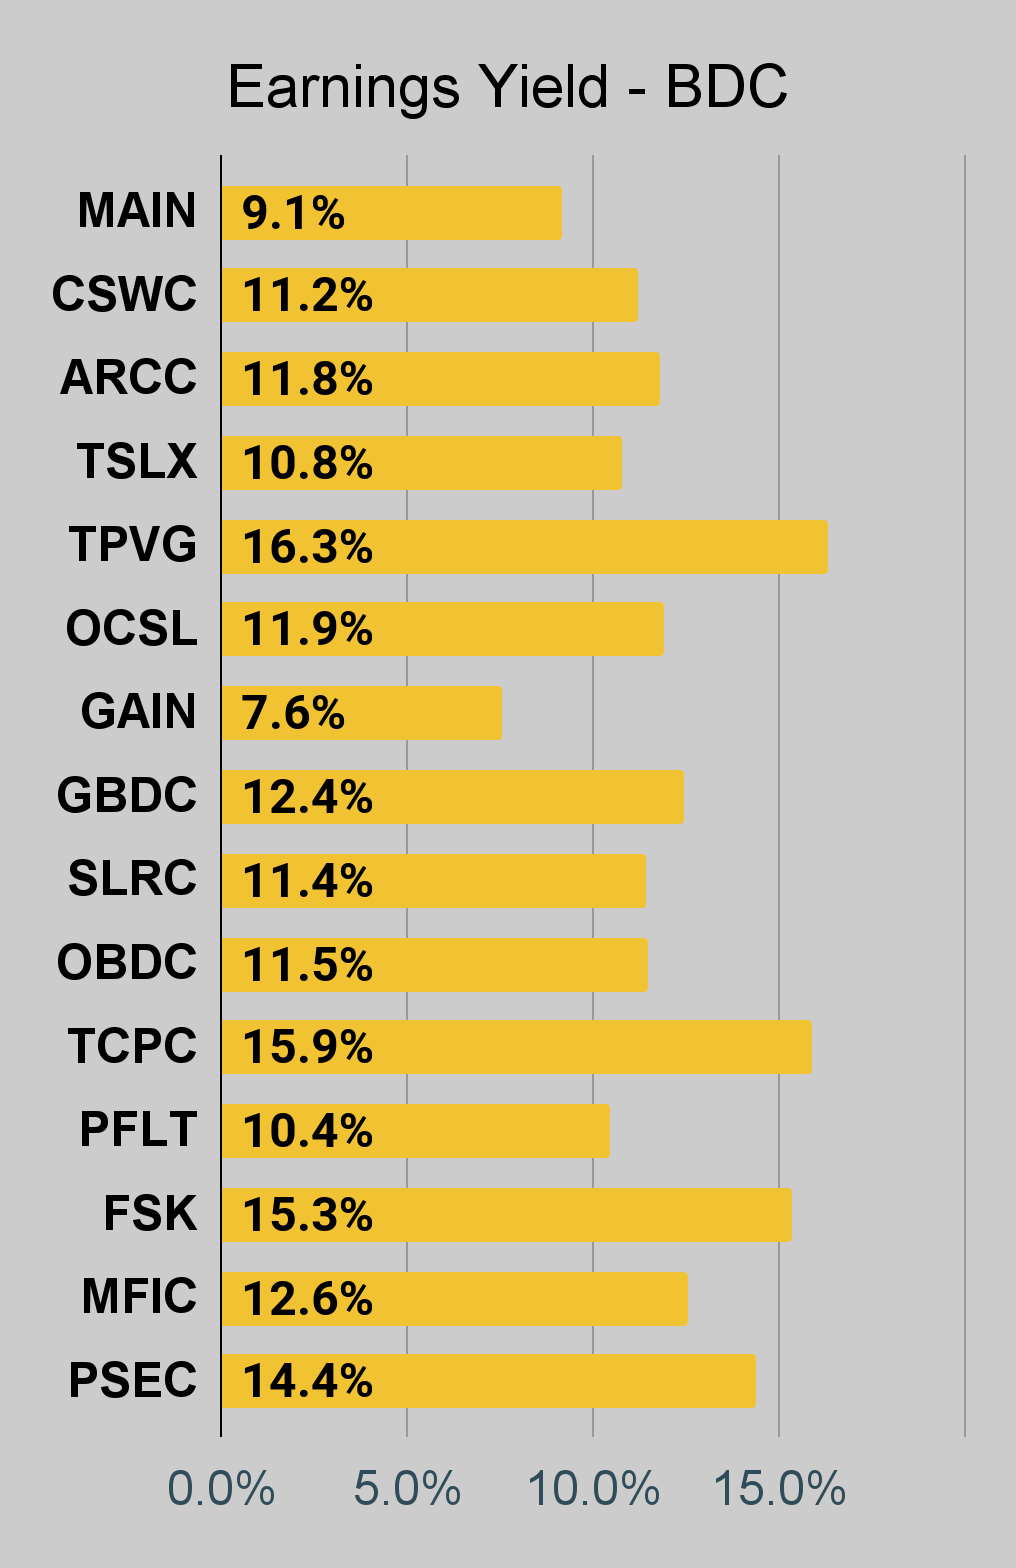
| BDC |
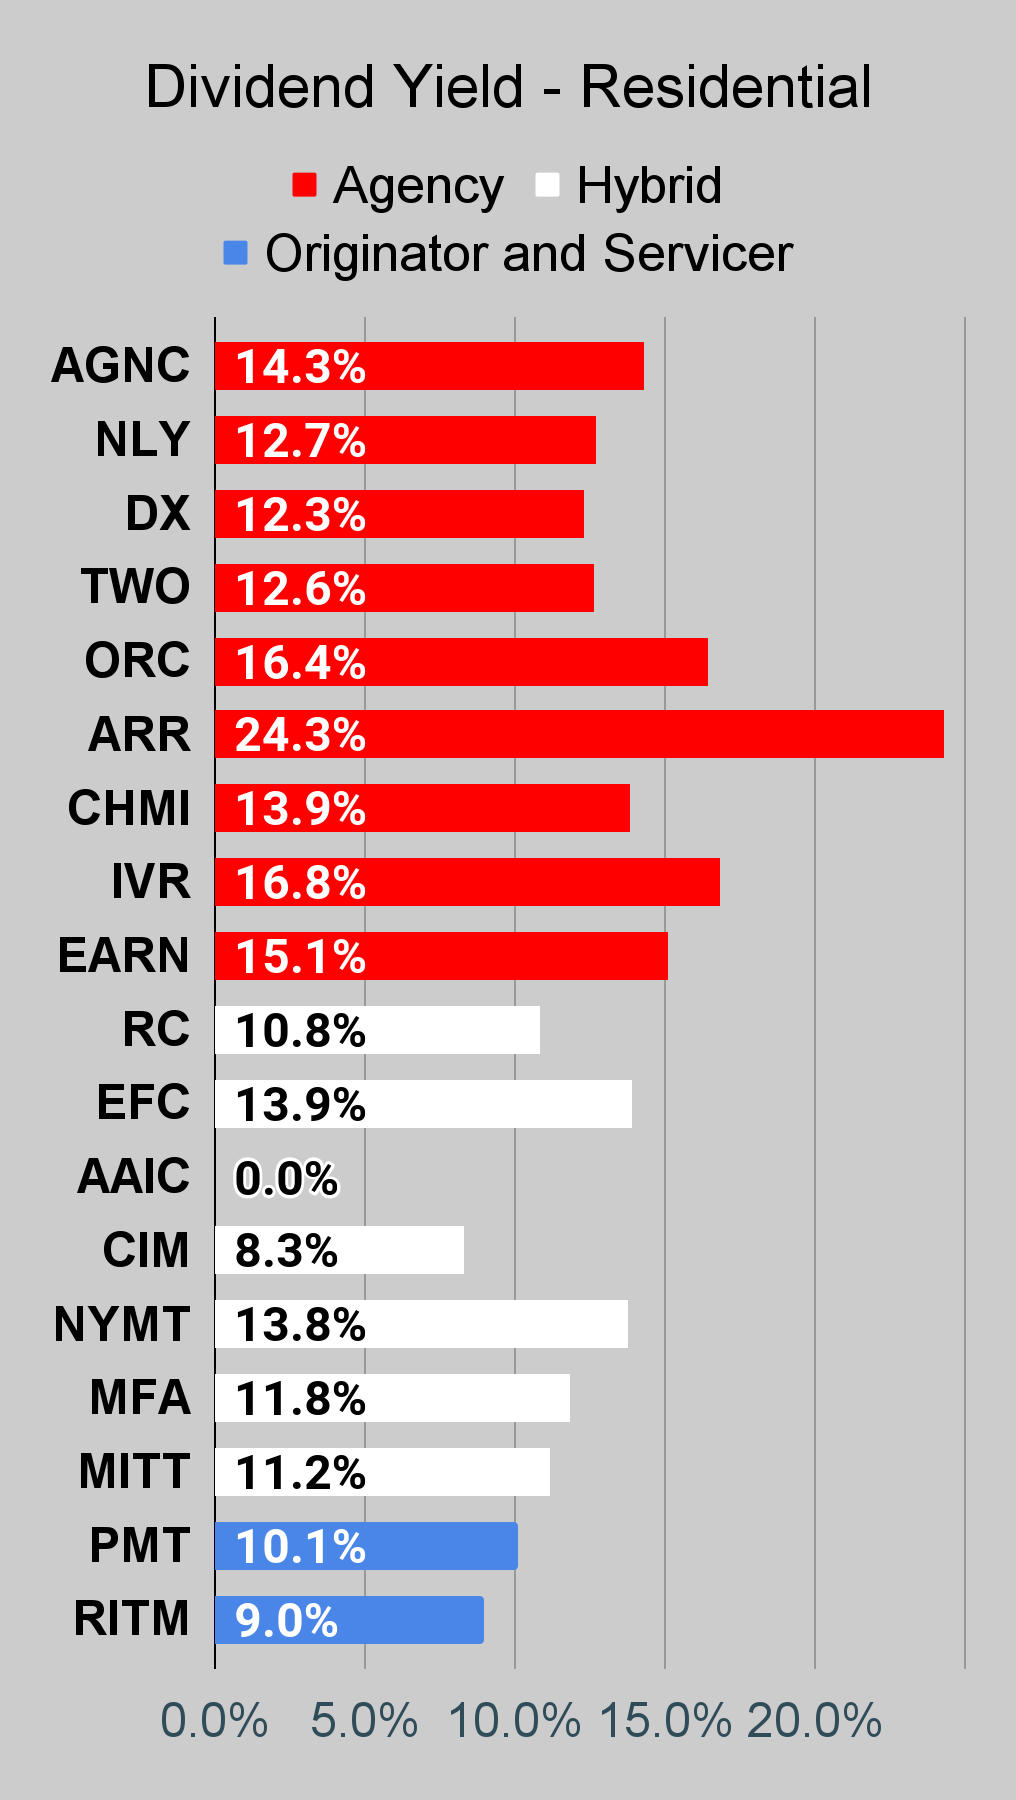
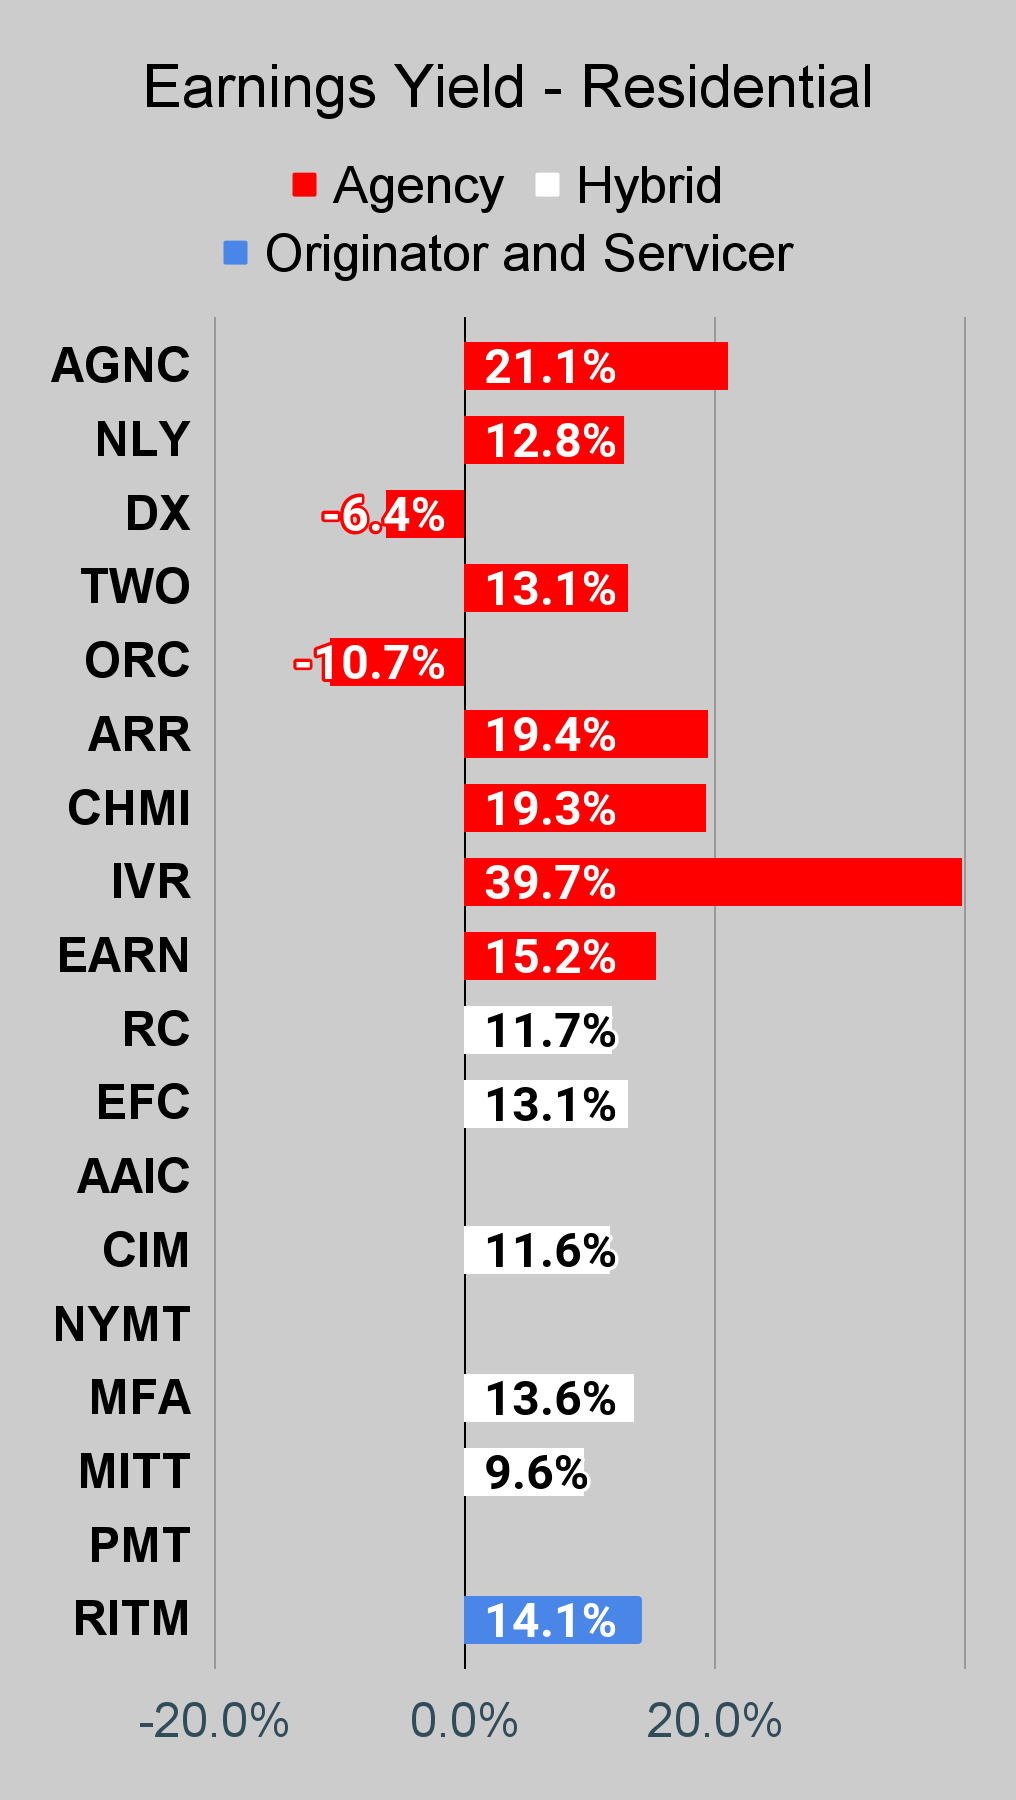
If you're looking for a stock that I haven't mentioned yet, you'll still find it in the charts below. The charts contain comparisons based on price-to-book value, dividend yields, and earnings yield. You won't find these tables anywhere else.
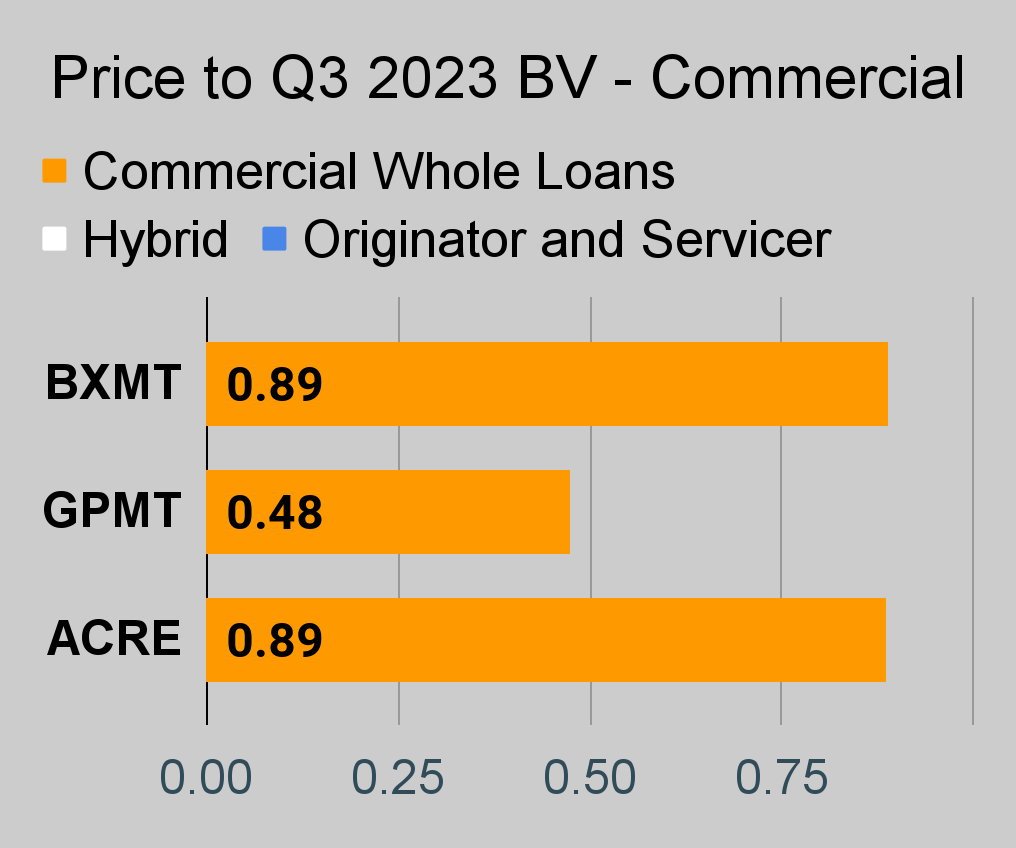
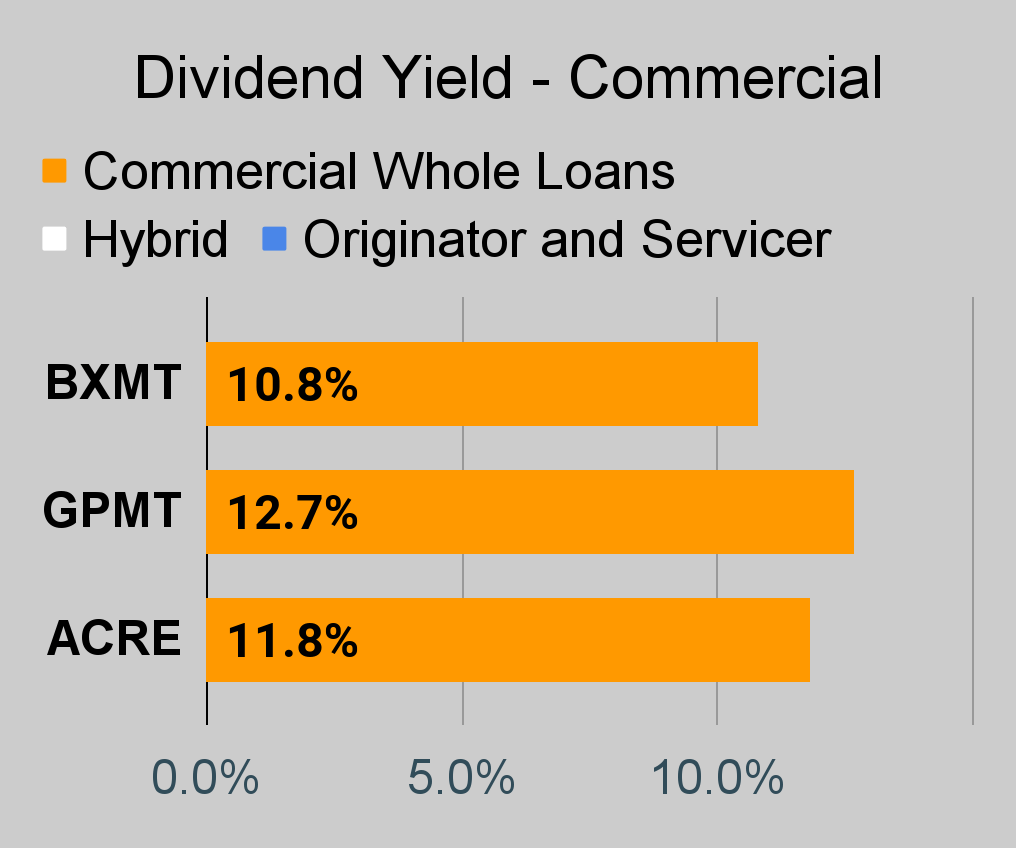
For mortgage REITs, please look at the charts for AGNC, NLY, DX, ORC, ARR, CHMI, TWO, IVR, EARN, CIM, EFC, NYMT, MFA, MITT, AAIC, PMT, RITM, BXMT, GPMT, WMC, and RC.
For BDCs, please look at the charts for MAIN, CSWC, ARCC, TSLX, TPVG, OCSL, GAIN, GBDC, SLRC, OBDC, PFLT, TCPC, FSK, PSEC, and MFIC.
This series is the easiest place to find charts providing up-to-date comparisons across the sector.
Notes on Chart Sorting
Within each type of security, the sorting is usually based on risk ratings. However, it is quite common to have a few shares that are tied. When the shares are tied for risk rating, the sorting becomes arbitrary. There may occasionally be errors where a share's position is not updated quickly following a change in the risk rating. That can happen because the charts come from a separate system. When I update the system we use for members, it doesn't change the order in the charts.
When I say "within each type of security", I'm referencing categories such as "agency mortgage REITs". The "hybrid mortgage REITs" are all listed after the "agency mortgage REITs". However, that does not mean RC (lowest hybrid) has a higher risk rating than the highest agency mortgage REIT. Each batch is presented by themselves.
PMT and RITM are tied for risk rating.
Finally, there's an outlier. We don't cover EARN. However, it was frequently requested for this series. Consequently, I added it to the charts. The important part here is that EARN was never assigned a risk rating. Since it has no assigned risk rating, it got lumped in at the top. However, I do not believe EARN would actually get a higher risk rating than IVR.
This could probably be written better. If someone feels inclined to take it upon themselves to write a section that is objectively better at communicating these points, I would be interested in using it. I'm grateful to have the best readers on SA. I attribute this to self-selection bias. I include enough things to offend the dumb people that I'm left with the best readers.
Residential Mortgage REIT Charts
Note: The chart for our public articles uses the book value per share from the quarter indicated in the chart. We use the current estimated (proprietary estimates) book value per share to determine our targets and trading decisions. It is available in our service, but those estimates are not included in the charts below. PMT and NYMT are not showing an earnings yield metric as neither REIT provides a quarterly "Core EPS" metric. Presently, a few other REITs also have no consensus estimate.
Second Note: Due to the way historical amortized cost and hedging is factored into the earnings metrics, it is possible for two mortgage REITs with similar portfolios to post materially different metrics for earnings. I would be very cautious about putting much emphasis on the consensus analyst estimate (which is used to determine the earnings yield). In particular, throughout late 2022 the earnings metric became less comparable for many REITs.
Note: Values for ratios and yields were pulled around the end of the day 12/26/2023.
Commercial Mortgage REIT Charts
BDC Charts
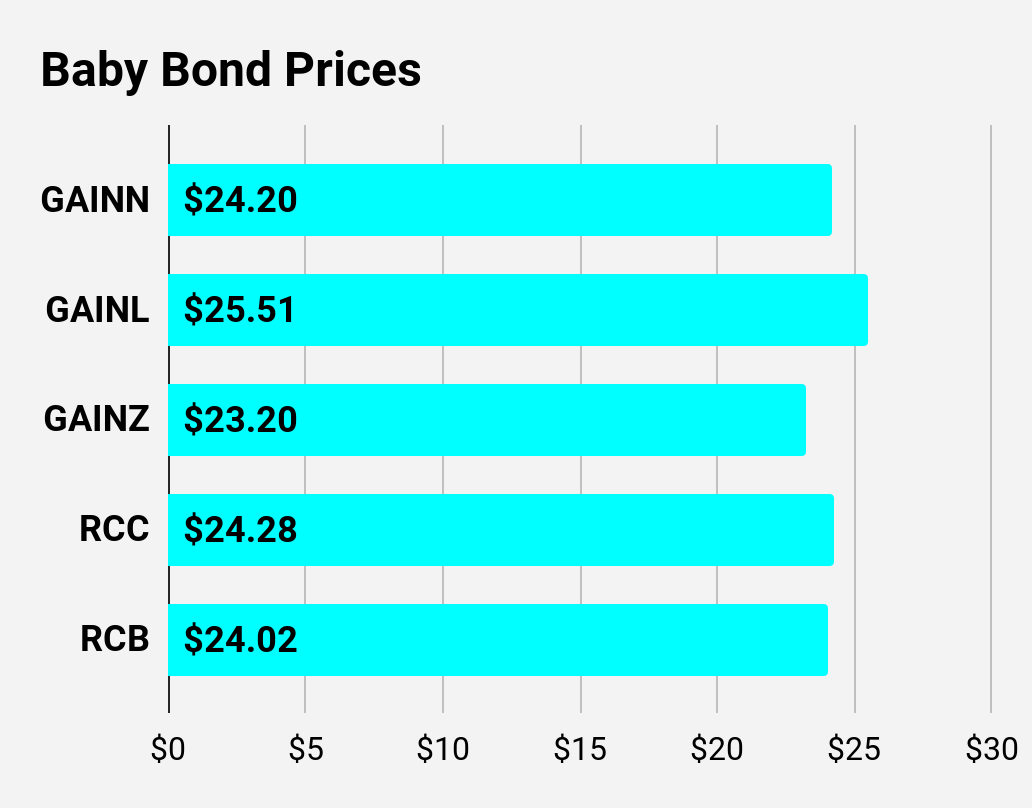
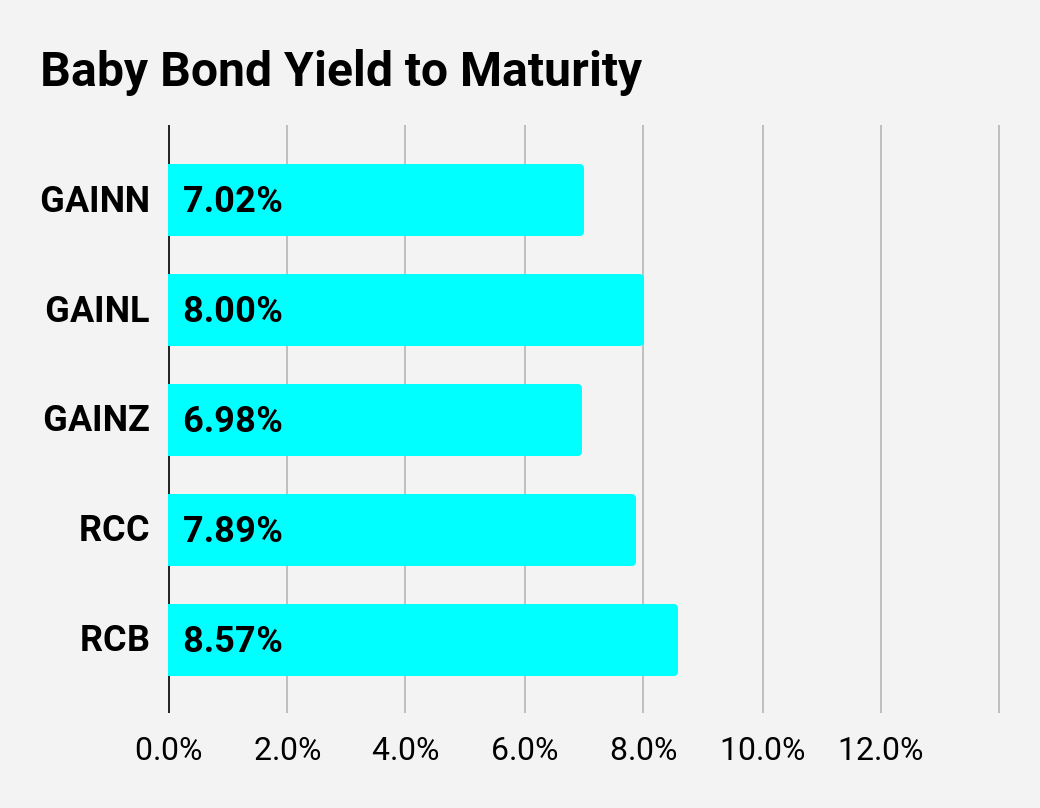
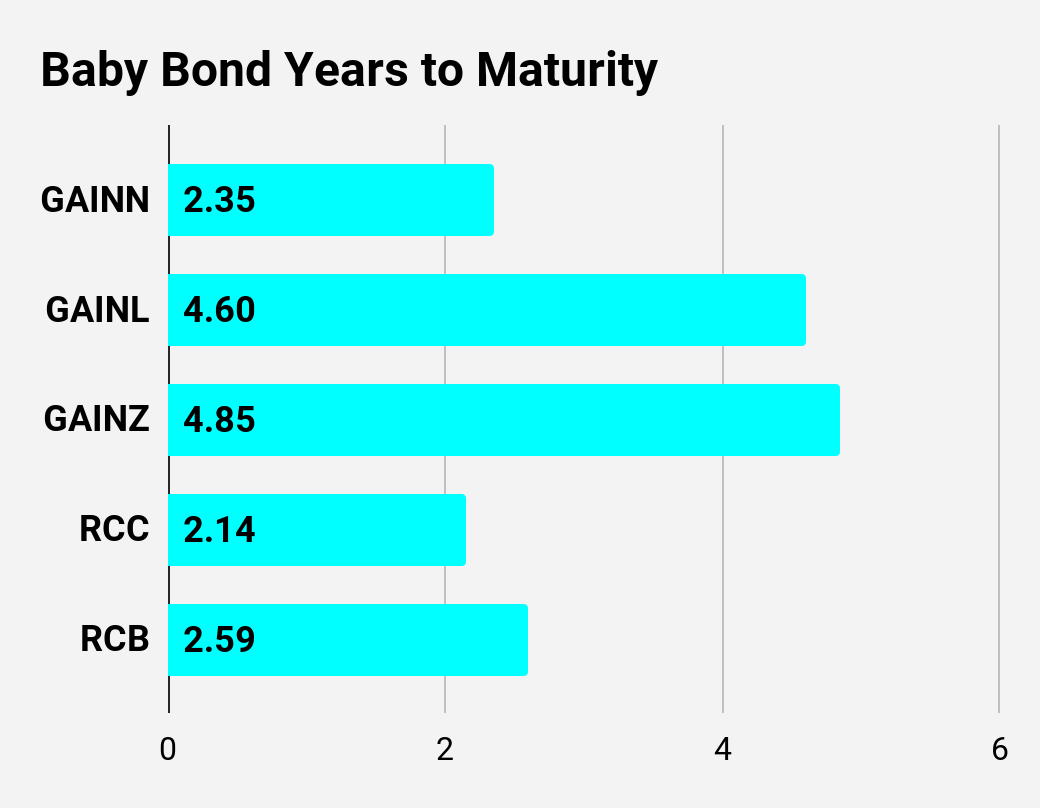
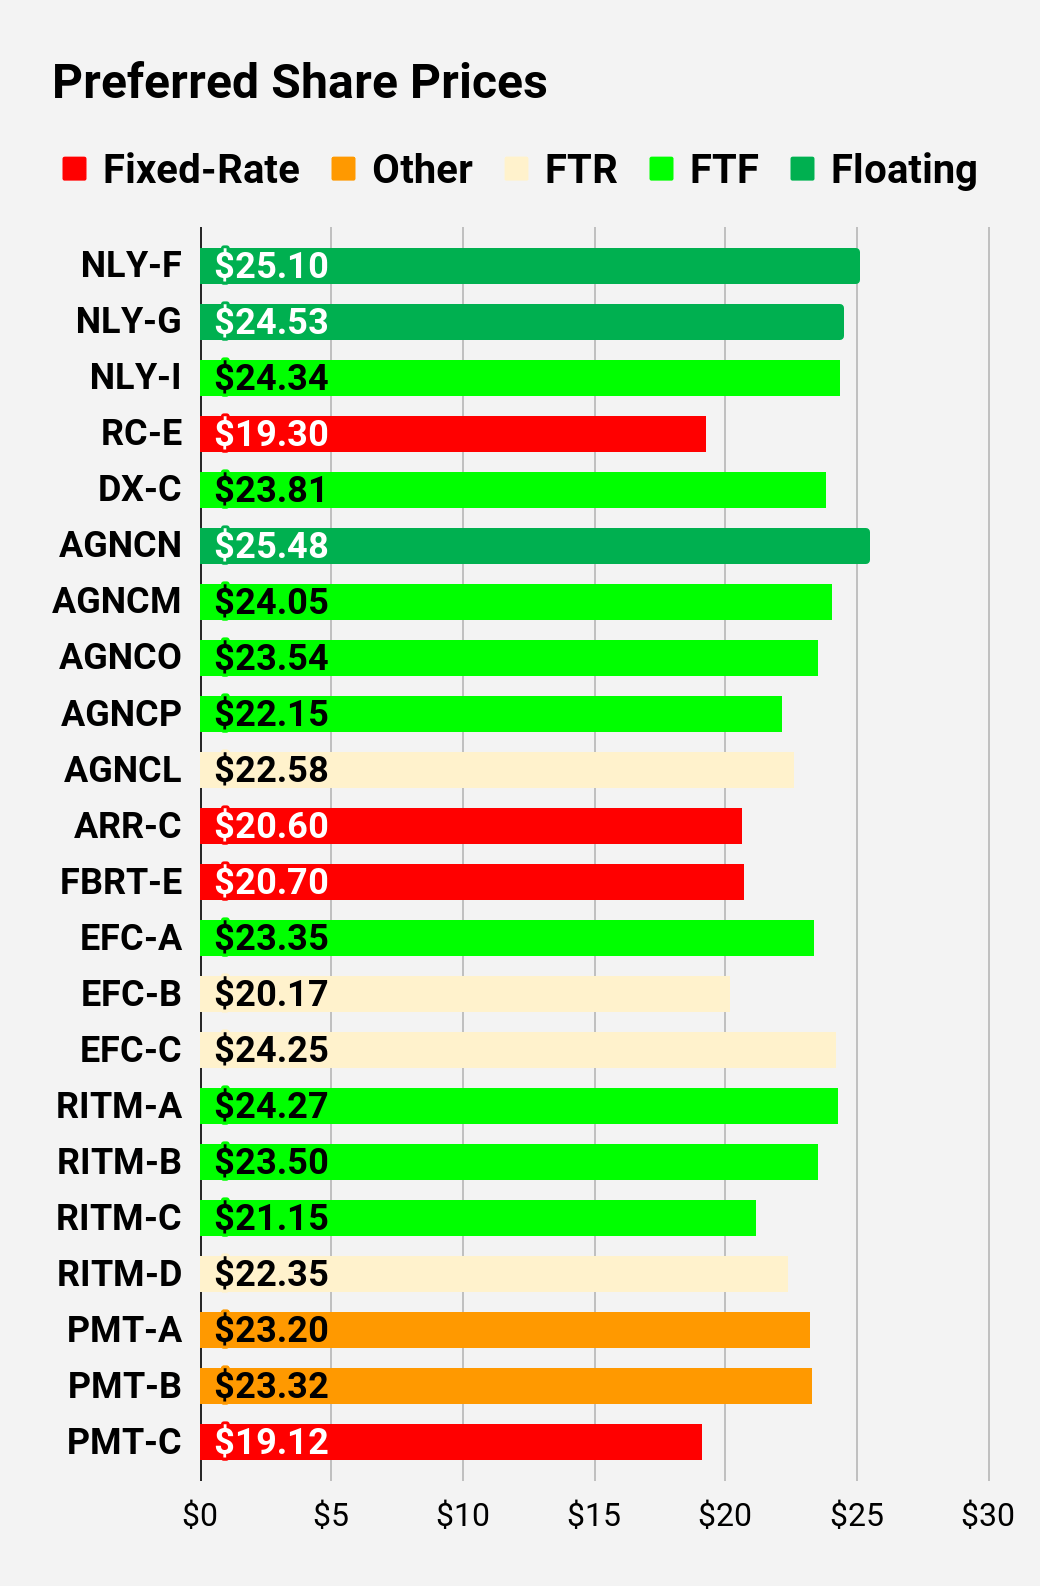
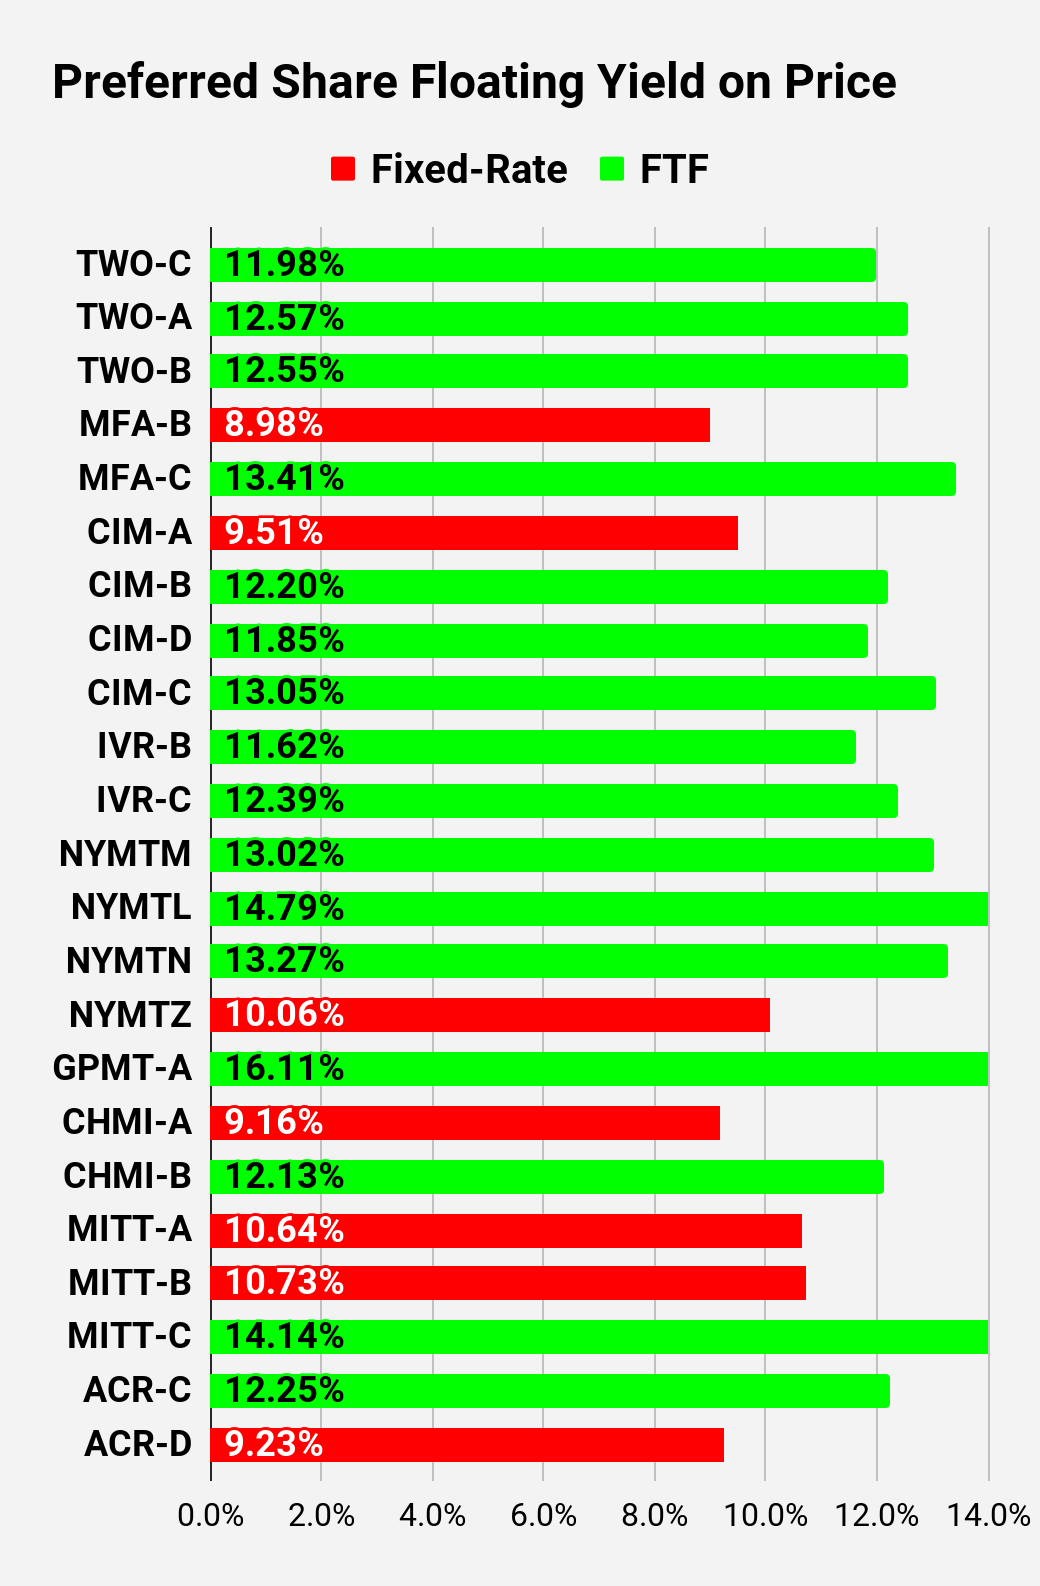
Preferred Share and Baby Bond Charts
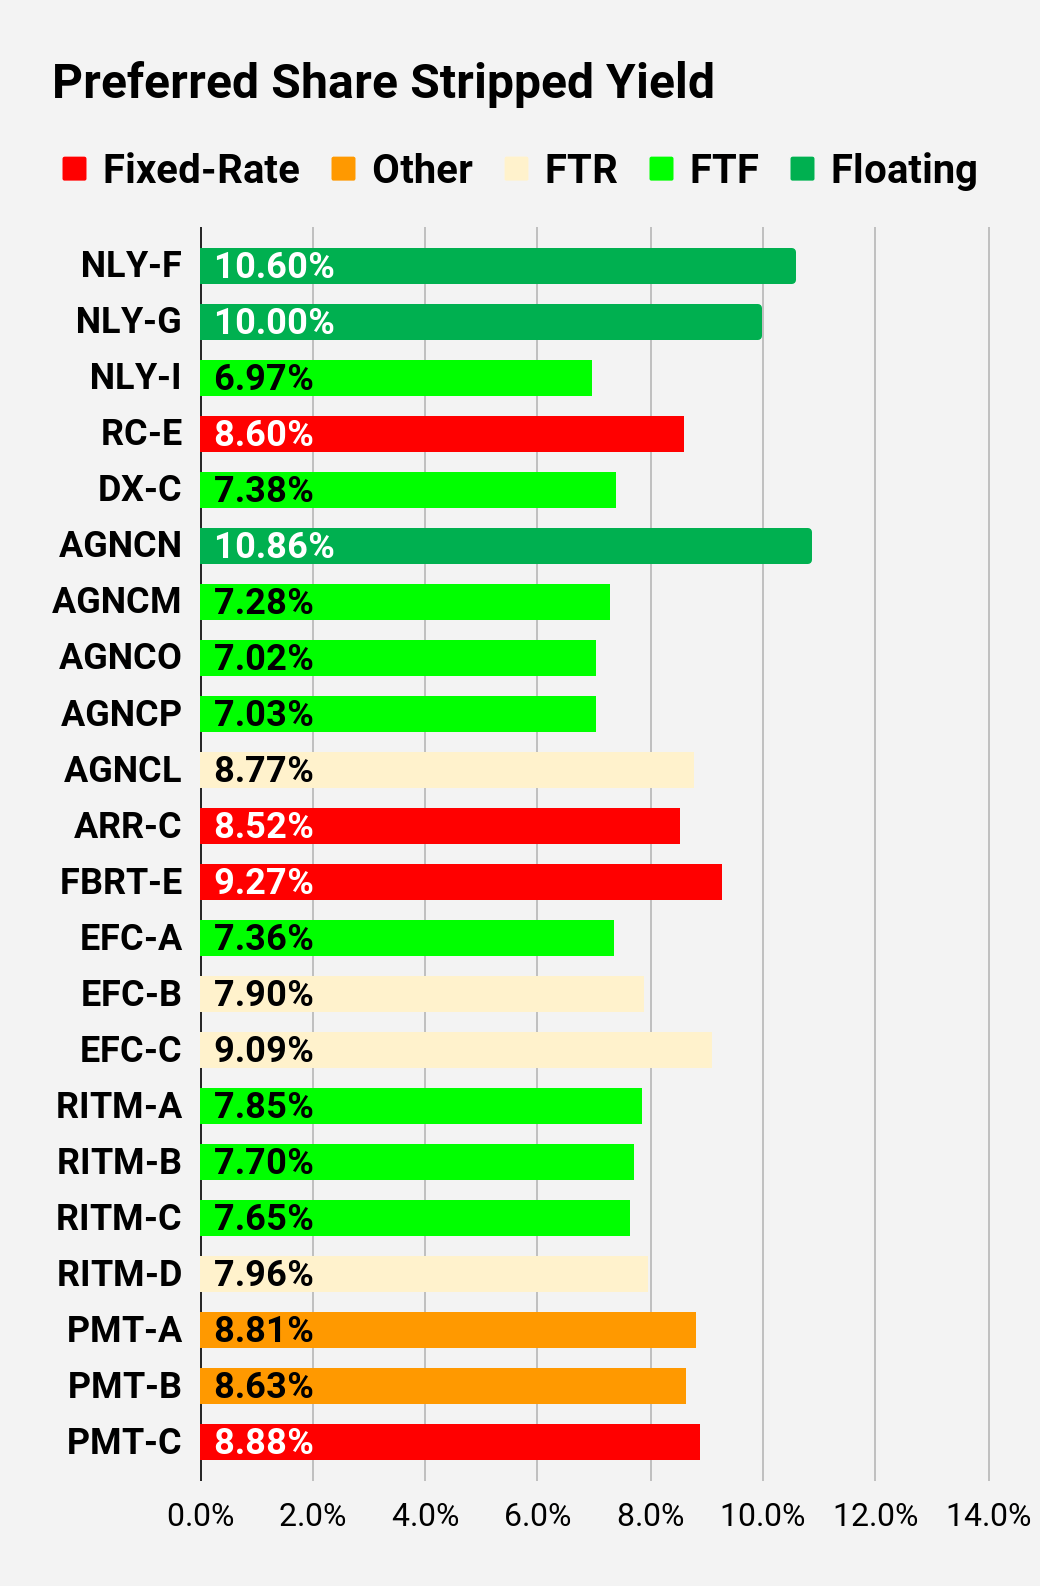
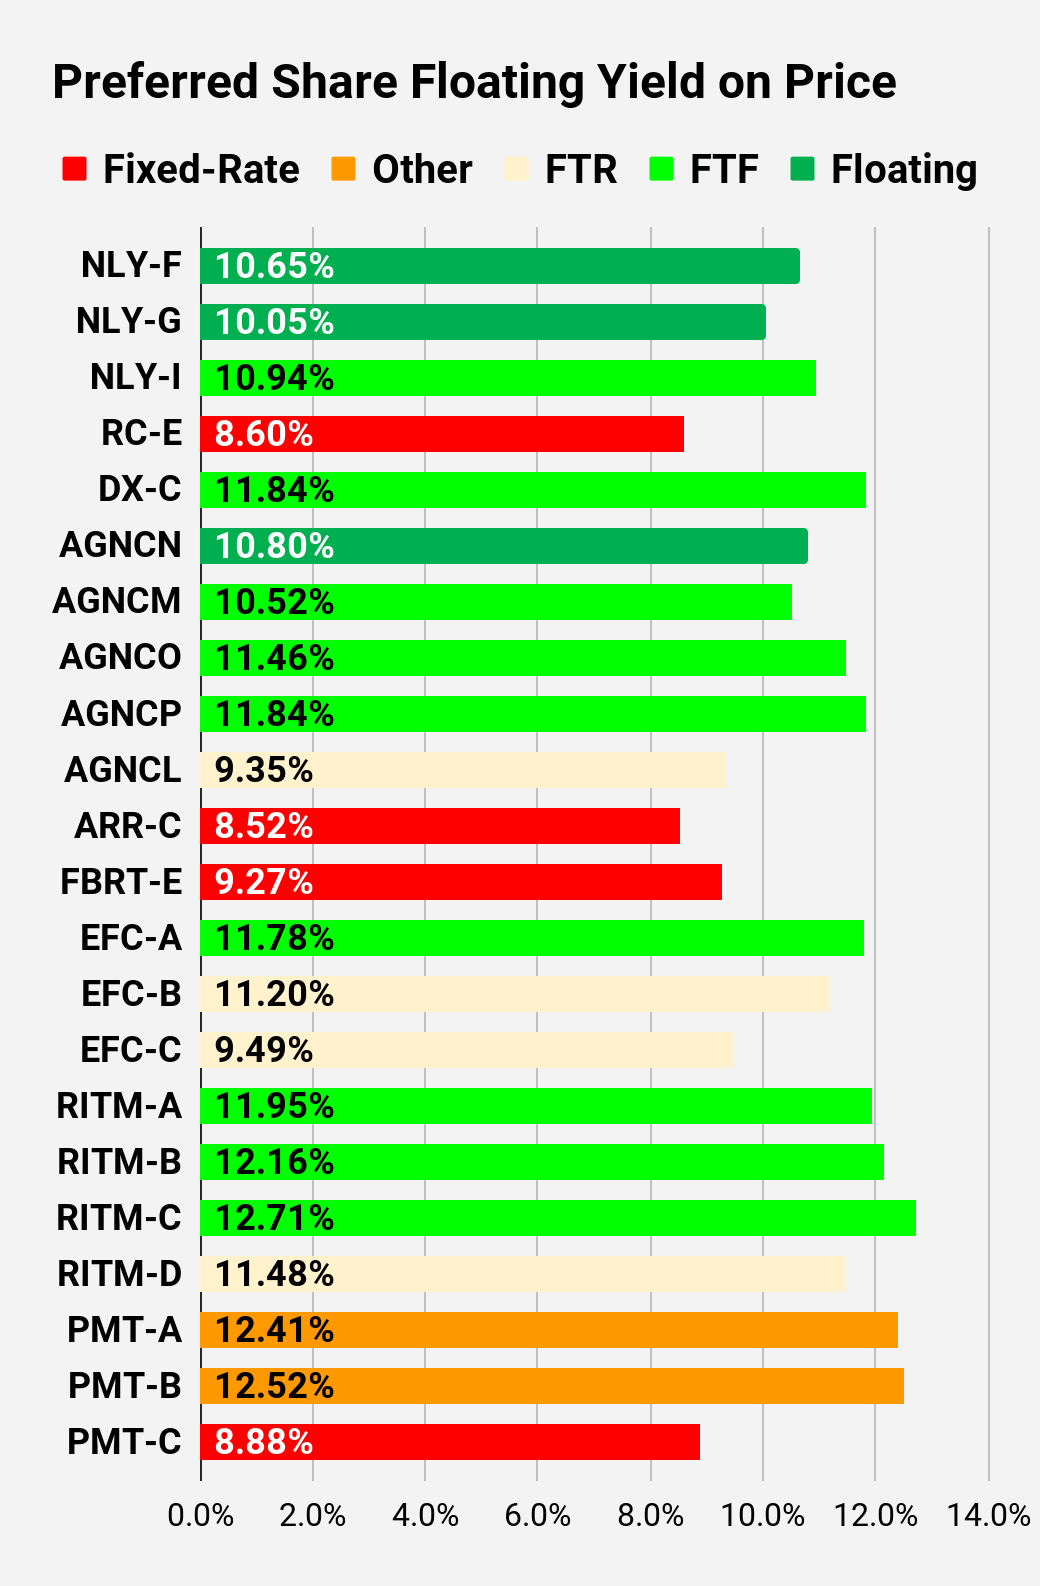
I changed the coloring a bit. We needed to adjust to include that the first fixed-to-floating shares have transitioned over to floating rates. When a share is already floating, the stripped yield may be different from the "Floating Yield on Price" due to changes in interest rates. For instance, NLY-F already has a floating rate. However, the rate is only reset once per 3 months. The stripped yield is calculated using the upcoming projected dividend payment and the "Floating Yield on Price" is based on where the dividend would be if the rate reset today. In my opinion, for these shares the "Floating Yield on Price" is clearly the more important metric.
| The REIT Forum |
| The REIT Forum |
| The REIT Forum |
| The REIT Forum |
| The REIT Forum |
| The REIT Forum |
| The REIT Forum |
| The REIT Forum |
| The REIT Forum |
Note: Shares that are classified as "Other" are not necessarily the same. Within our service, we provide further distinction. For the purpose of these charts, I lumped all of them together as "Other". Now there are only two left, PMT-A and PMT-B. Those both have the same issue. Management claims the shares will be fixed-rate, even though the prospectus says they should be fixed-to-floating. I've argued quite extensively that management is wrong, but investors should be aware of the issue.
For further details see:
Rates Plunge, High Yields At Risk