RC - Rates Plunge REITs Rip Bears Attack
2023-12-08 12:42:52 ET
Summary
- Interest rates have plunged since October 19th, 2023, which is significant for REITs.
- Some mortgage REITs have seen gains in book value due to a mix of interest rates and spreads.
- Blackstone Mortgage Trust was attacked by a bear.
We’ve got three topics for today. Each will be short and sweet. Well, it will be short. I’ll commit to that much.
Rates Plunge
Interest rates have plunged since October 19th, 2023. That is a big deal for real estate investment trusts, or REITs.
We’ve seen some gains to (projected) book value in the quarter. However, it is a mix of interest rates and spreads.
Here are some quick numbers:
The REIT Forum
At the start of Q3, the 5-year Treasury rate (US5Y) was 4.61%. It dropped to 4.12%. That’s a decline of 0.49%. Since the mortgage REITs are hedging against interest rates (often using Treasury Futures or swaps), the fair value on their hedges is down. Adjusting for 5 years of duration, the decline is about $2.46 per $100.00 of national value. That’s a rough approximation.
The UMBS figures we’re using here show the pricing for a 30-year fixed-rate agency MBS with a coupon rate of 6% or a coupon rate of 5%. That’s what the 6.0 and 5.0 represent.
For the MBS with a 6.0 coupon, the price only increased $2.24 per $100.00 of face value.
If the mortgage REIT, or mREIT, owned that, the gain on the MBS wouldn’t be enough to offset the loss on shorting a 5-year Treasury Futures contract.
However, for the MBS with a 5.0 coupon, the price increased by $2.97. That’s quite a bit more than $2.46. If the mortgage REIT owned that asset, it would more than offset the loss from shorting a 5-year Treasury Futures contract.
As it happens, many of the mortgage REITs primarily own lower-coupon MBS. Consequently, they saw bigger gains.
The difference between $2.97 and $2.46 is only $.51. That probably doesn’t seem like much. It is only 0.51%. However, apply leverage, and the picture changes. That change of 0.51% could actually be more like 4%. If the MBS they owned had an even lower coupon rate, or they used less hedges, the gain could be bigger.
REITs Rip
By our estimates, tangible book value per share was up for several REITs. Here are two of them:
- AGNC Investment (AGNC): Up about 5.8%
- Annaly Capital (NLY): Up about 4.1%.
Of course, that’s only running through December 1st, 2023. By the end of the quarter, we may see further changes.
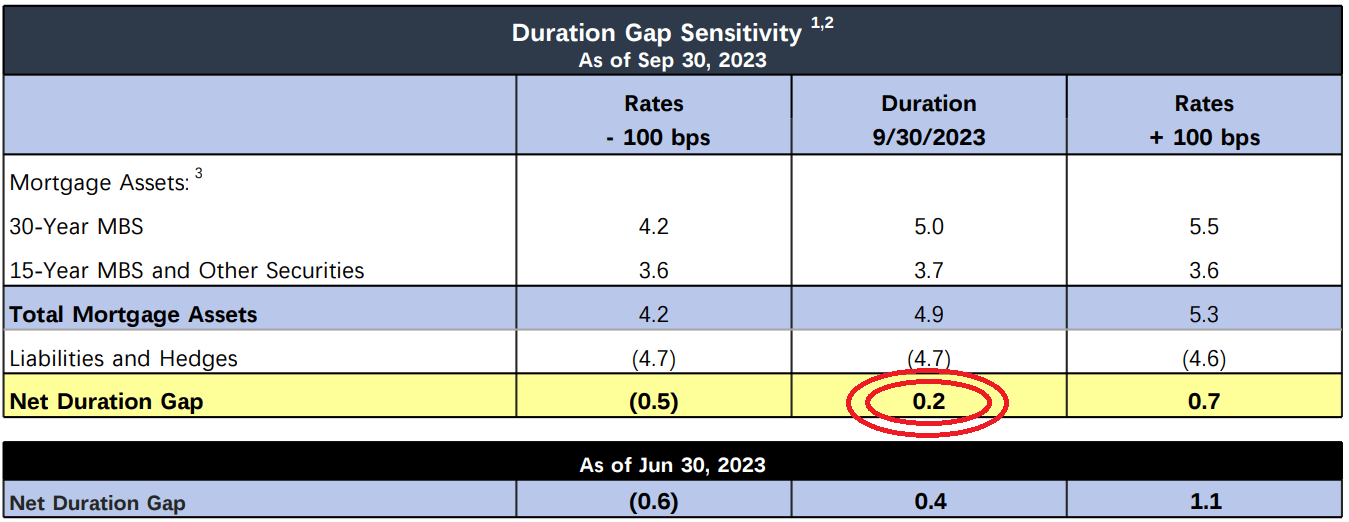
This is actually pretty impressive. To gain book value when rates go down, a mortgage REIT generally uses positive duration (greater than 0). However, AGNC’s net duration was pretty close to 0:
They were aiming to protect themselves from a scenario where rates move higher.
However, all interest rates don’t necessarily move together.
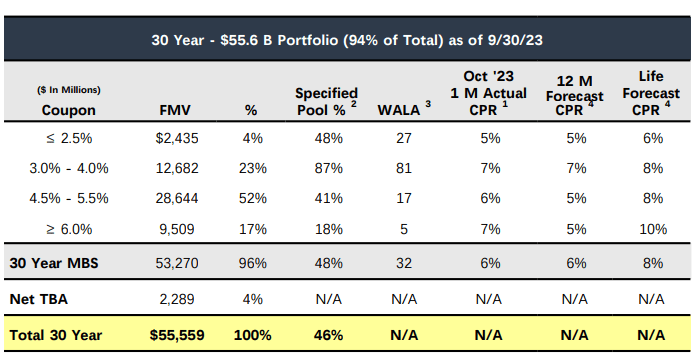
As you can see, AGNC’s portfolio emphasized securities with lower interest rates:
94% of the total portfolio was in 30-year fixed-rate securities. The substantial majority had rates of 5.5% or below. In some cases, it was pretty far below. Those were the better assets to have for the most recent developments.
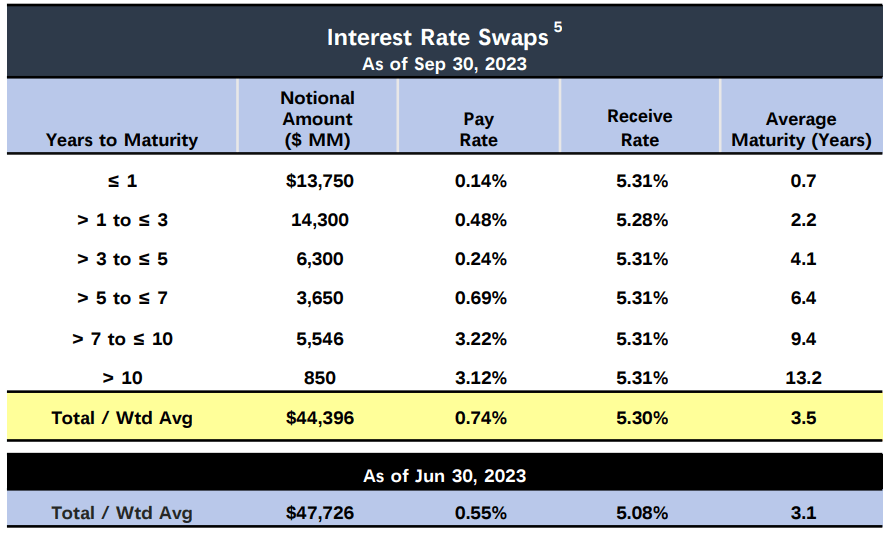
For the investors who want to cheer about how AGNC is perfect, I would remind you about the upcoming maturities on their interest rate swaps:
That’s $13.75 billion of maturities in under 1 year. Maturities where they are paying 0.14% and receiving 5.31%. These swaps are subsidizing the rate AGNC pays to borrow money. When they run out, investors who don’t understand the financial statements will say something like: “OMG. This is the worst. Why is interest expense going up so much? Stupid management. They are the worst. It’s definitely their fault. I did perfect research. I saw the dividend yield and the prior earnings and that’s all there is to research. Reading about hedges is stupid. I hate stupid people. They took my money. I’m going to post some mean words on the internet.”
Bear Attack on BXMT
Look, I put most of this piece together earlier. I wasn’t planning to discuss Blackstone Mortgage Trust ( BXMT ). I’ll touch on it briefly because I know many of my readers are eager to hear more about it.
We’ve researched BXMT. I’m not convinced by the bear. The company producing the report has strong incentives to paint the worst picture possible. We don’t expect all loans to work out, but losses on loans are factored into our analysis.
Remember that the bears make money by getting the price down. They want investors to run away, because that's how they get rewarded.
The REIT Forum
Sometimes property values fall to the point where financing them on the same terms is difficult or impossible. That would be bearish, but it doesn’t indicate a complete loss. If a borrower defaults on $85 million because the building is only worth $100 million, it would still be worth $15 million more than the loan. A lender who agreed to reduce the principal due on the loan, because the building was worth $100 million instead of $130 million, would be a dumb lender. BXMT management is not stupid.
BXMT already responded to the bear attack:
"We believe this self-interested and misleading report is designed solely for the purpose of negatively impacting BXMT’s share price for the short seller’s own benefit," Blackstone Mortgage said in a comment emailed to Seeking Alpha. "We will respond in greater detail – however the steps we have taken on both sides of our balance sheet, including proactive asset management, a conservative liquidity posture, and a patient approach to new investments, leave us well positioned to navigate this environment, as evidenced in our recent third quarter results, with DE of $0.78 per share covering our dividend by 126%, liquidity still at record levels, and a continued reduction in our leverage."
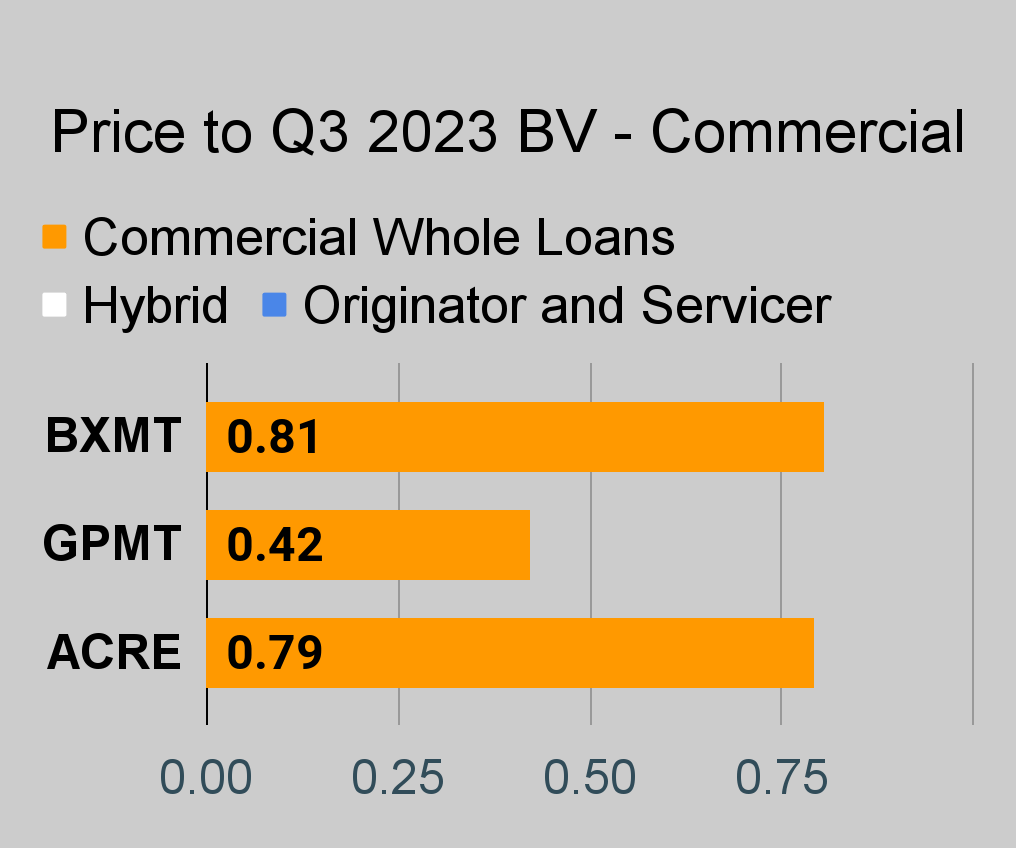
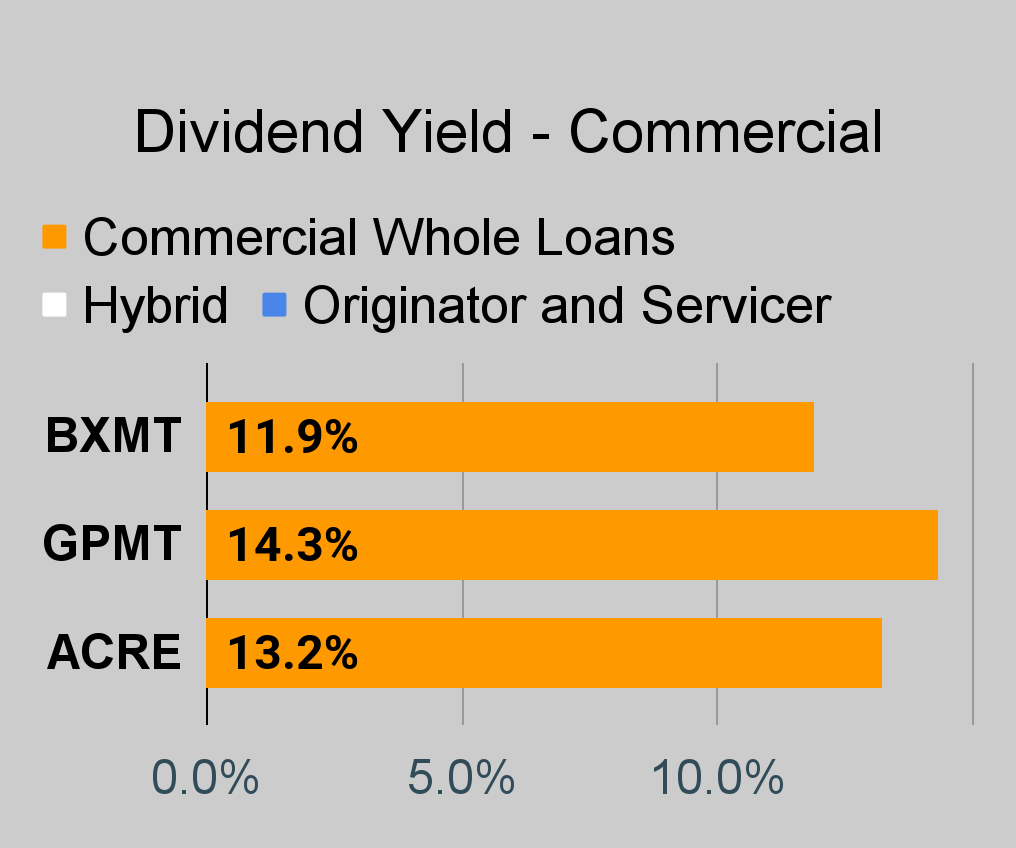
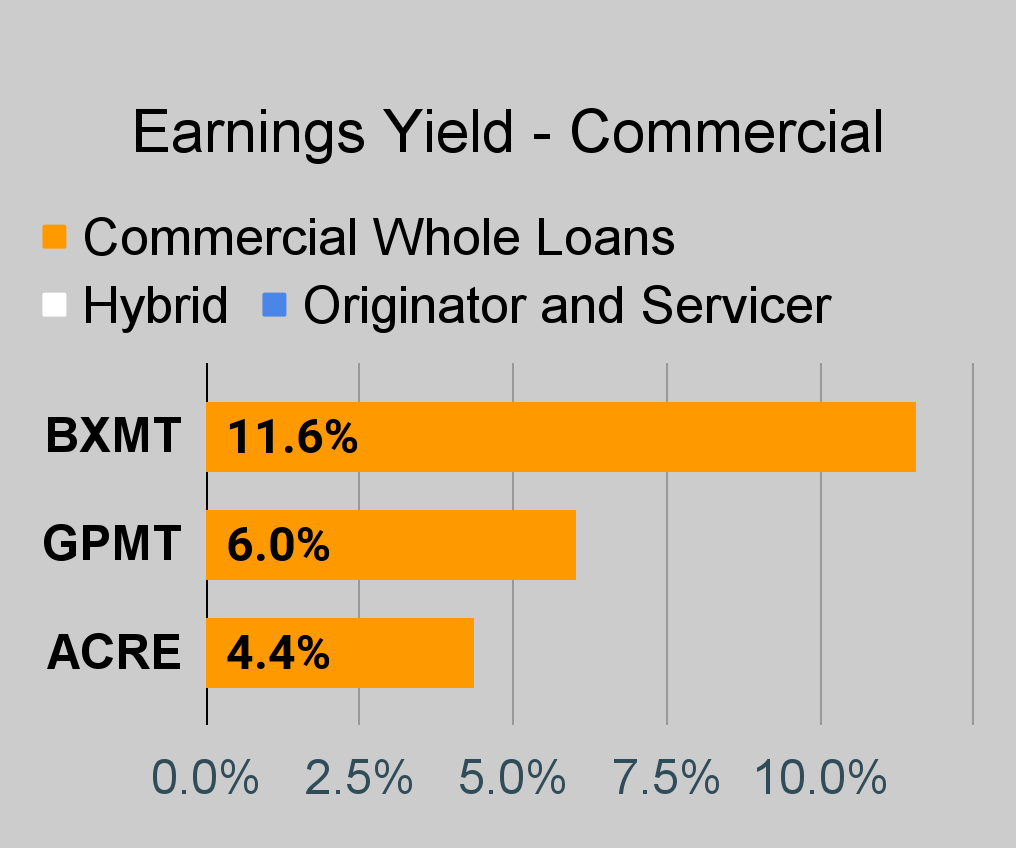
BXMT currently has an 11.9% dividend yield and trades at an estimated (using our proprietary estimates) price-to-book ratio of .81. Shares plunged hard yesterday on the bear attack, but were up 0.82% today.
Coming Up
I've been investing heavily in the preferred shares. I'll have some target adjustments coming up. Target adjustments for the preferred shares will mostly be positive. Rates fell substantially and are trending lower. That's good for the fixed-rate shares. Meanwhile, short-term rates are still pretty high, and we're getting closer to rates resetting.
Even if short-term rates fell to 3.5%, many of the fixed-to-floating shares would see material dividend increases when the floating rate kicks in.
Stock Table
We will close out the rest of the article with the tables and charts we provide for readers to help them track the sector for both common shares and preferred shares.
We’re including a quick table for the common shares that will be shown in our tables:
| Type of REIT or BDC |
| Residential Agency |
| Residential Hybrid |
| Residential Originator and Servicer |
| Commercial |
| BDC |
| ((AGNC)) |
| ((BXMT)) |
| ((NLY)) |
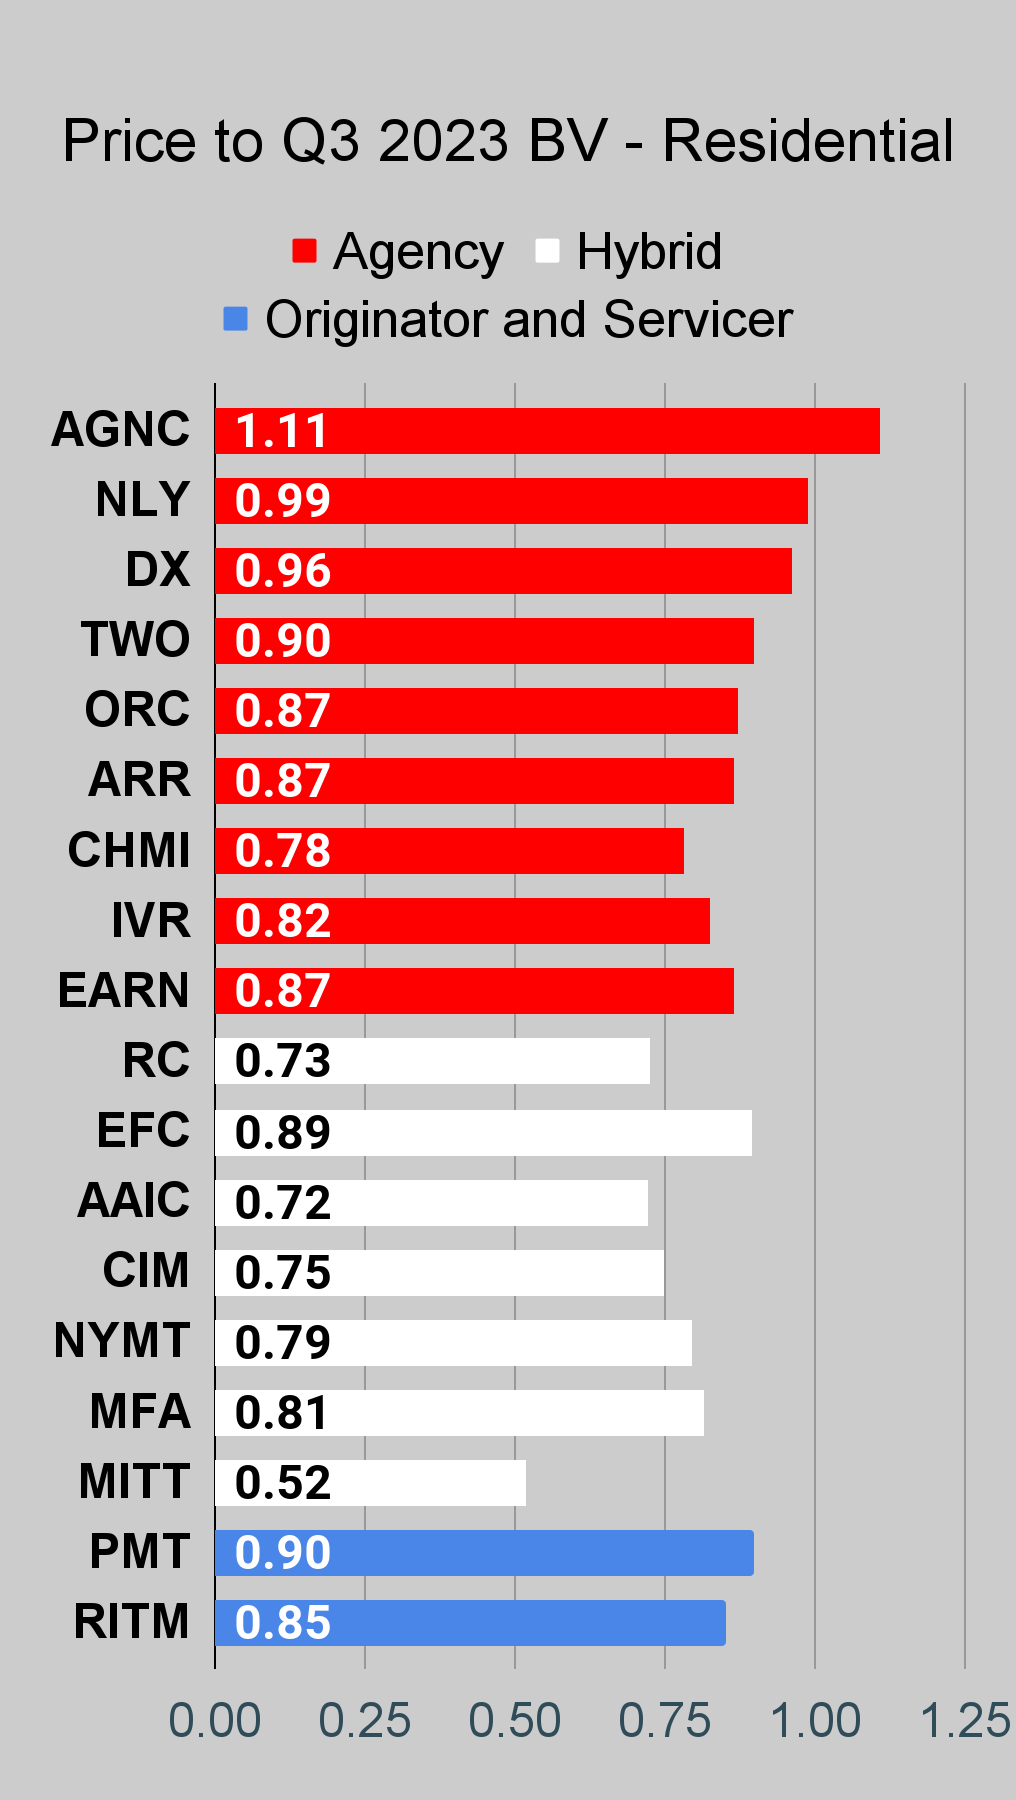
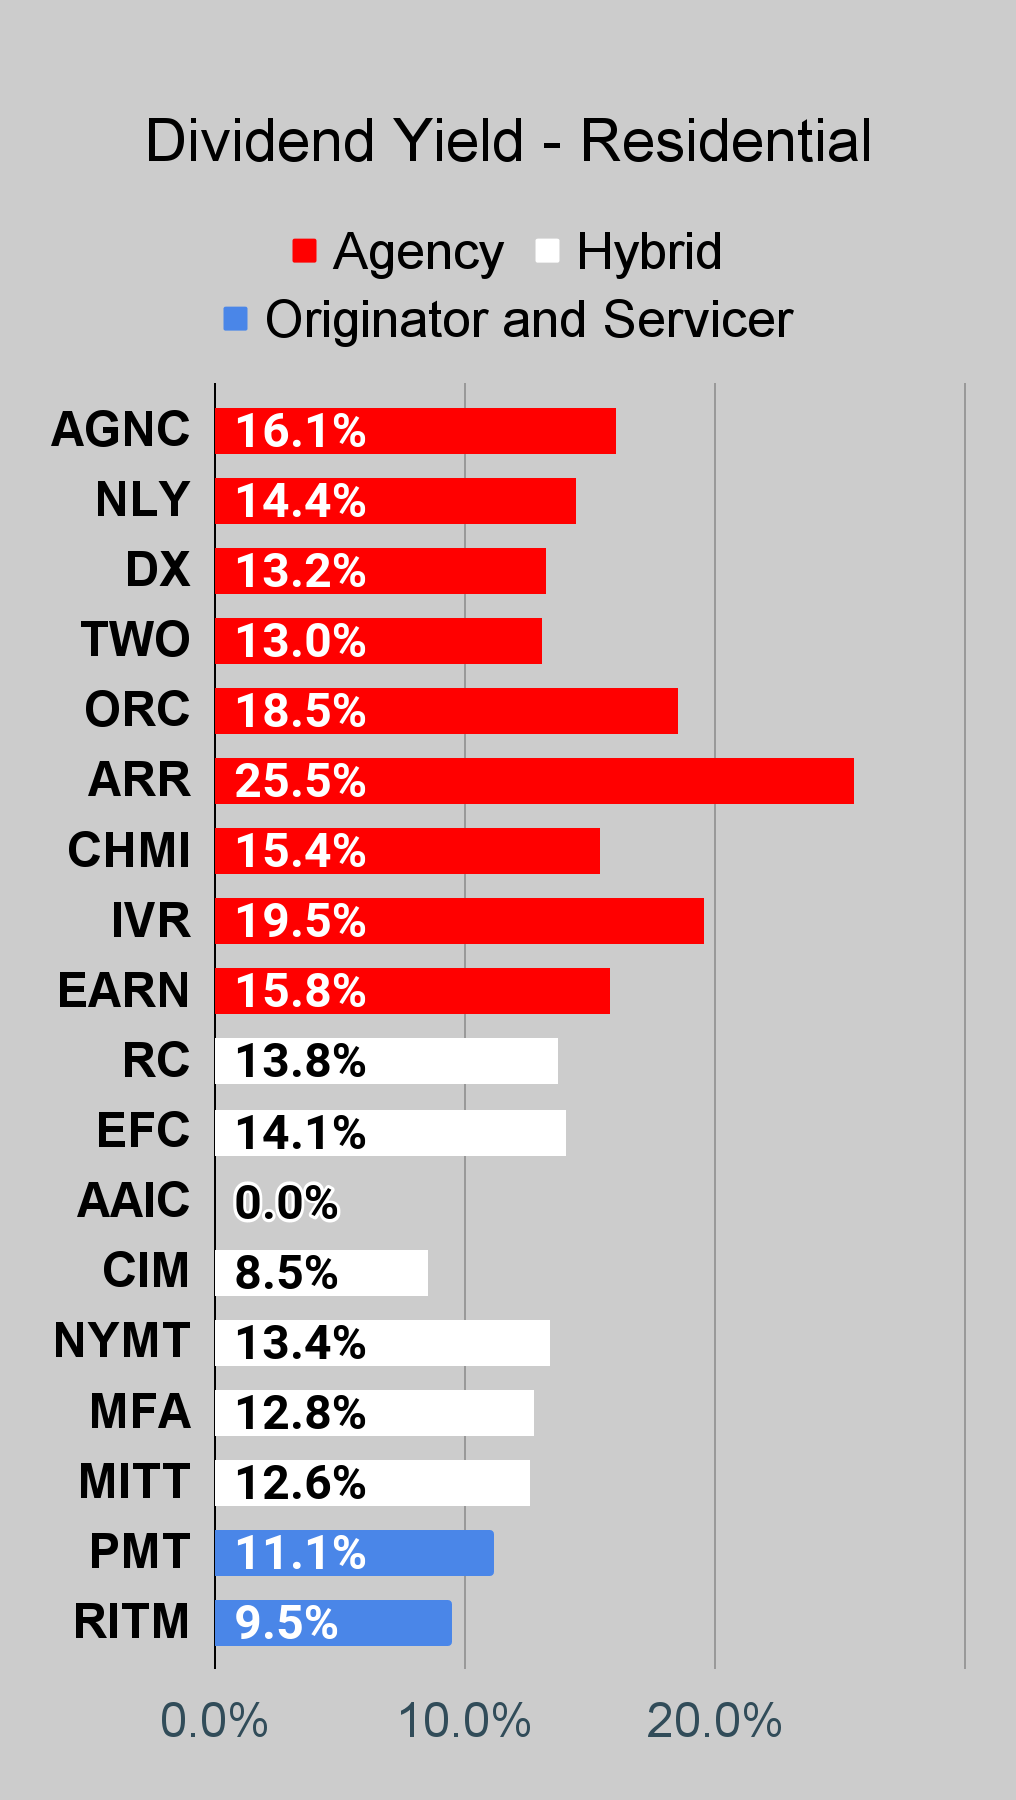
If you’re looking for a stock that I haven’t mentioned yet, you’ll still find it in the charts below. The charts contain comparisons based on price-to-book value, dividend yields, and earnings yield. You won’t find these tables anywhere else.
For mortgage REITs, please look at the charts for AGNC, NLY, DX, ORC, ARR, CHMI, TWO, IVR, EARN, CIM, EFC, NYMT, MFA, MITT, AAIC, PMT, RITM, BXMT, GPMT, WMC, and RC.
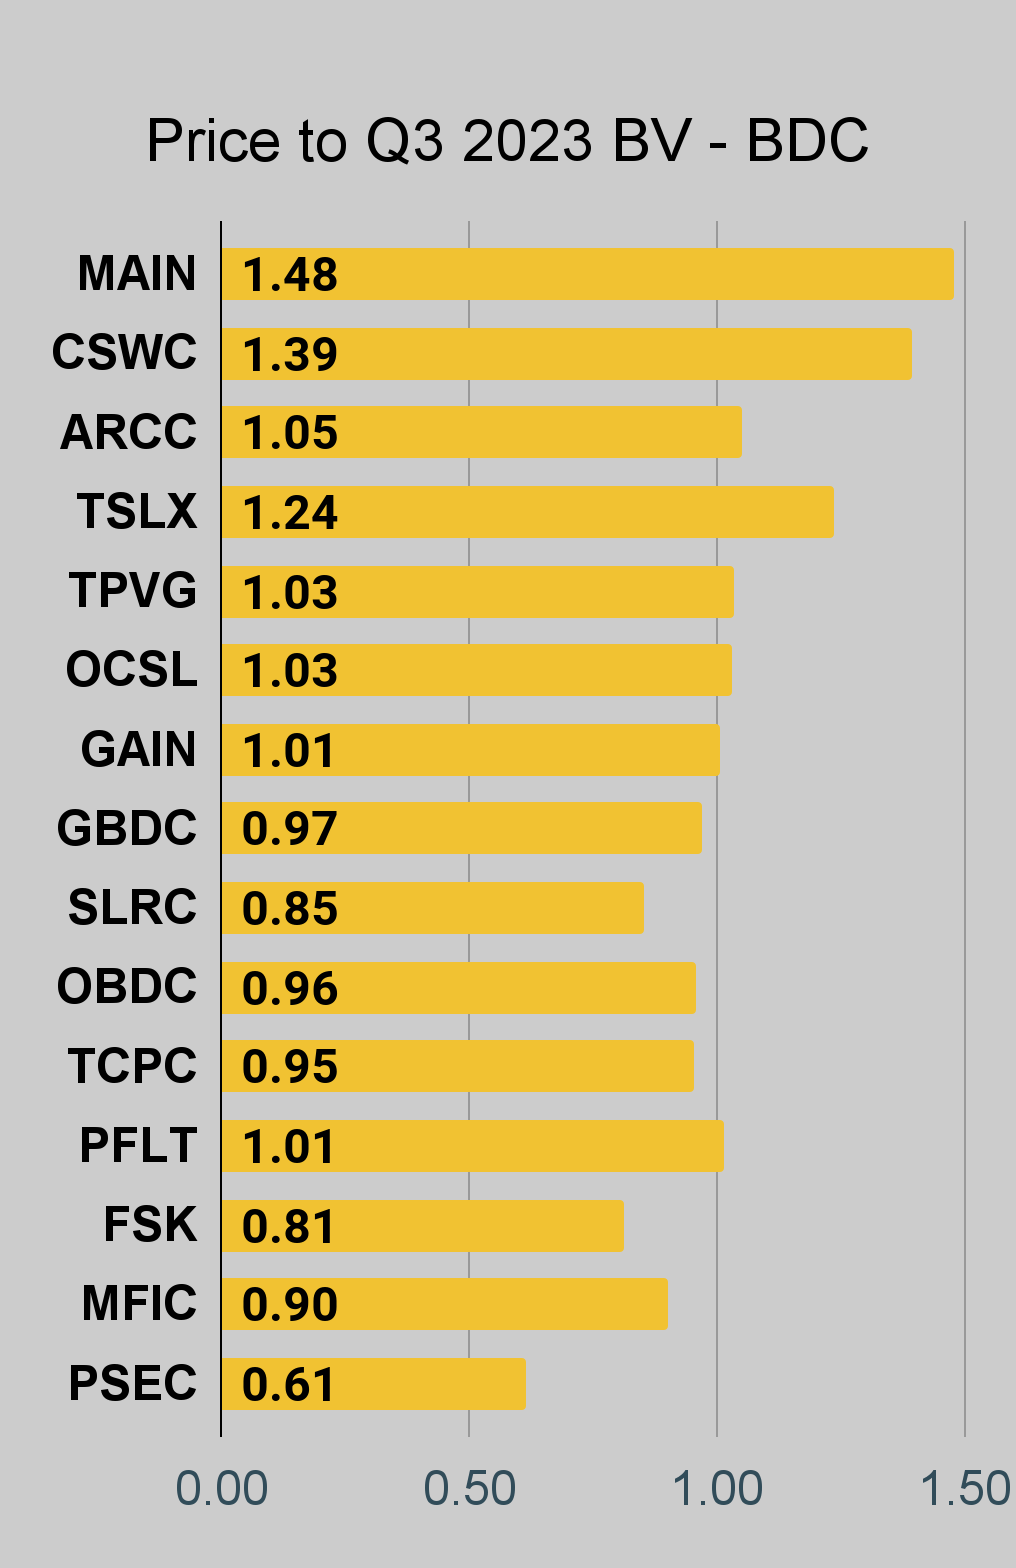
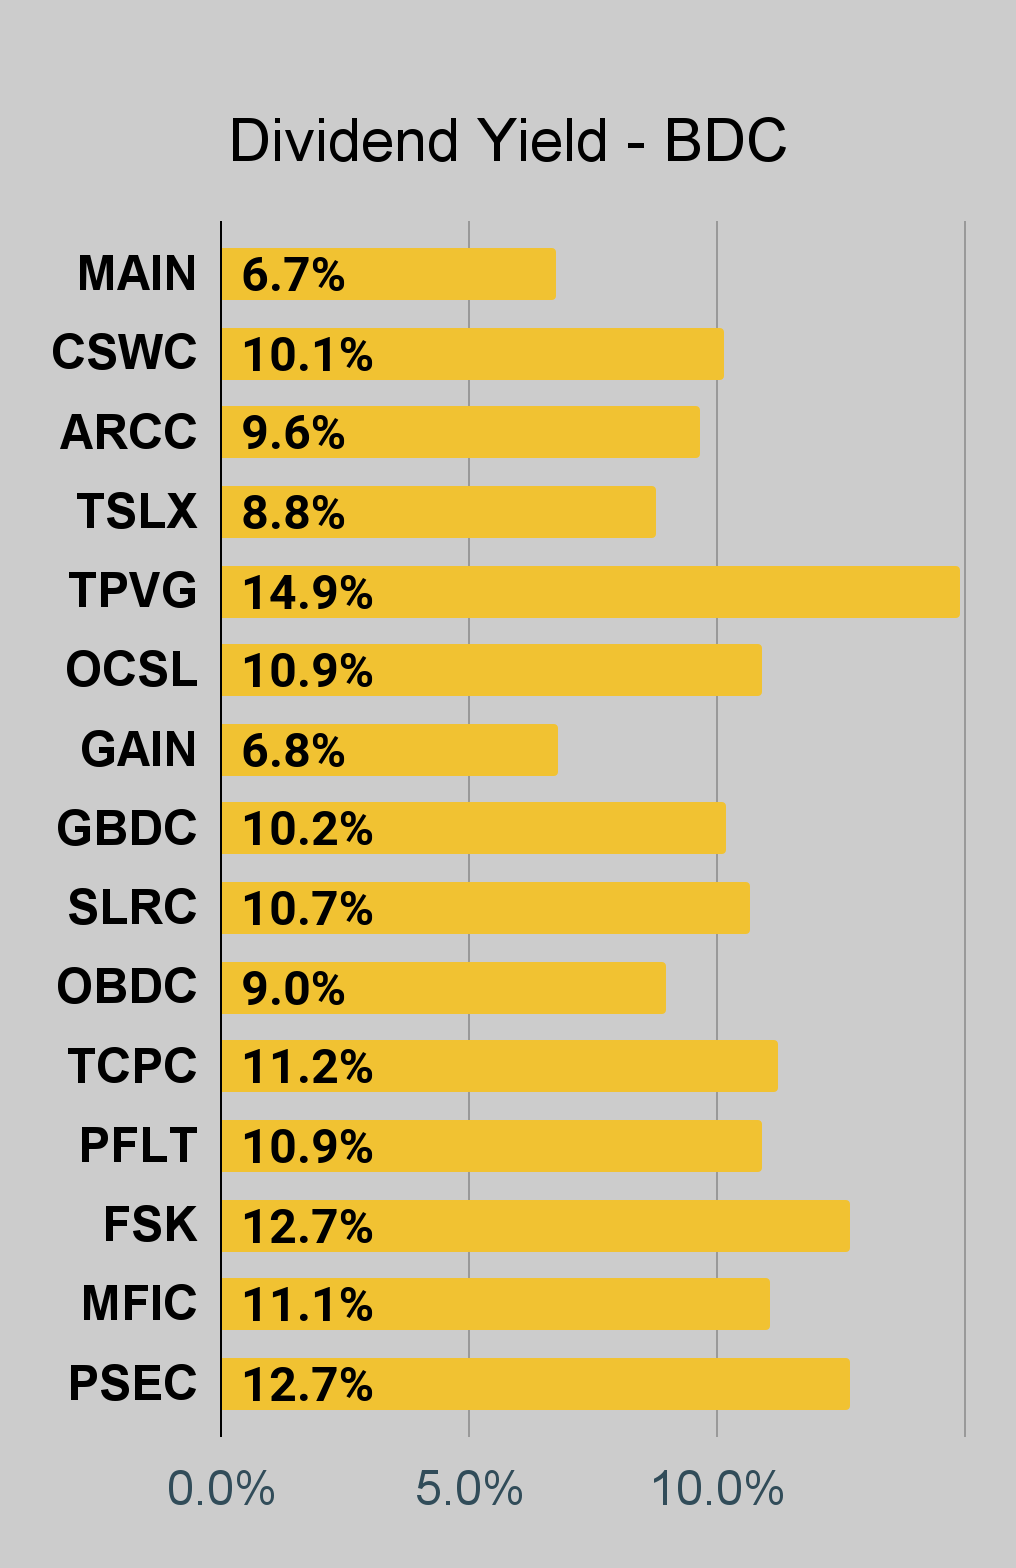
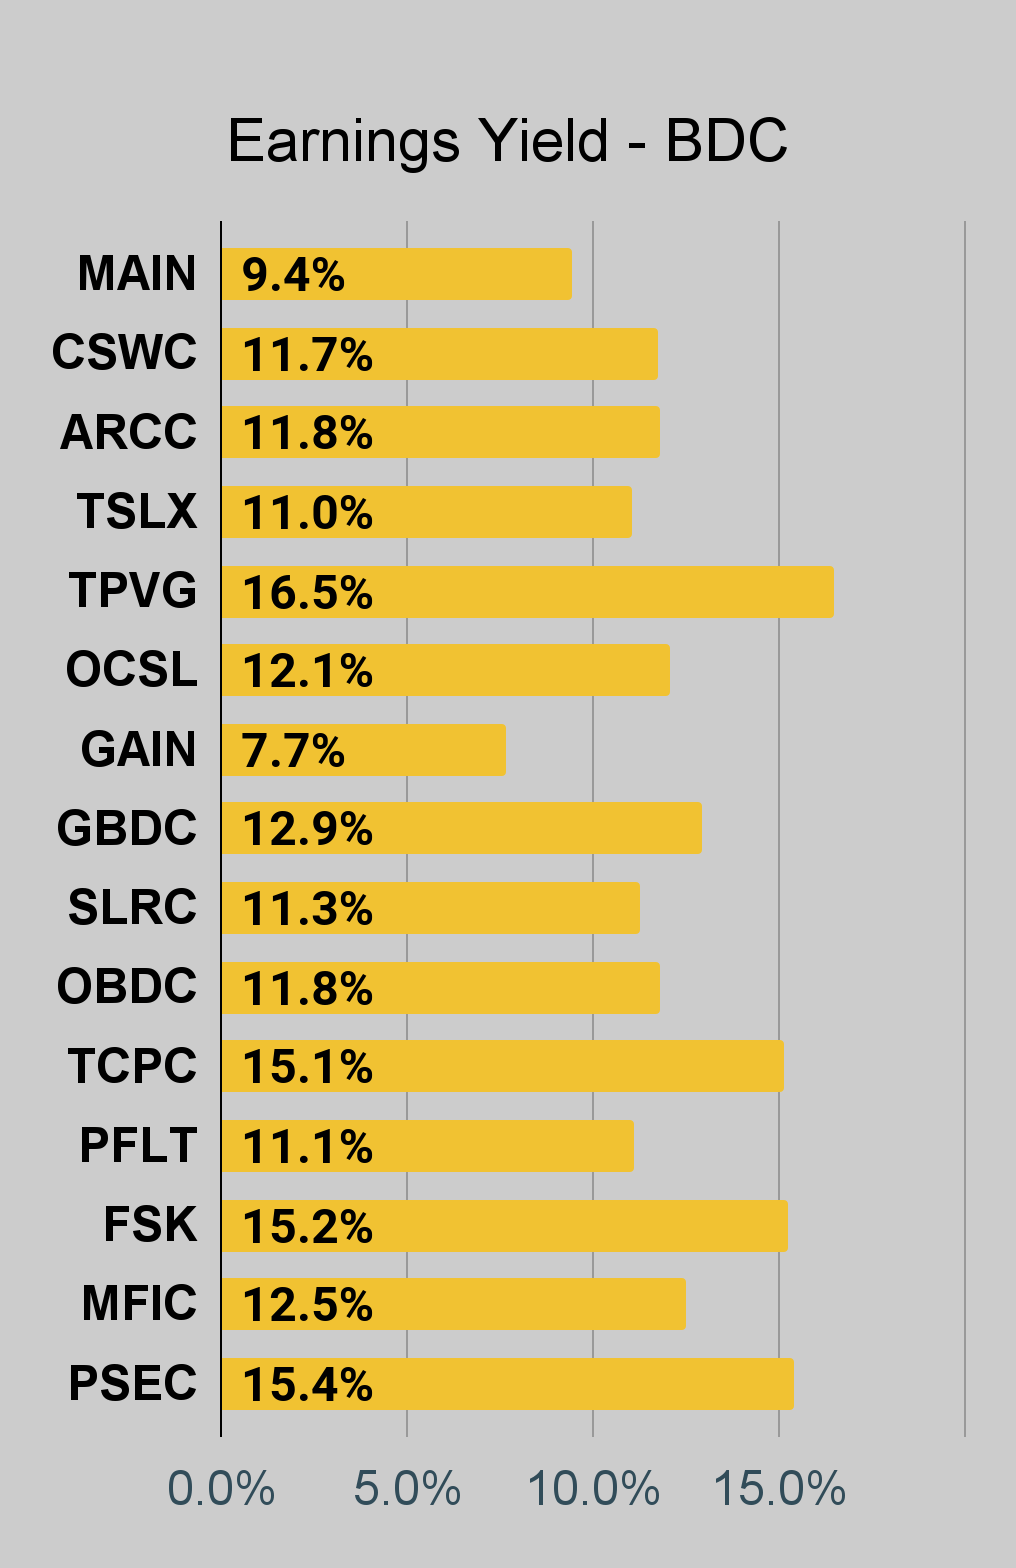
For BDCs, please look at the charts for MAIN, CSWC, ARCC, TSLX, TPVG, OCSL, GAIN, GBDC, SLRC, OBDC, PFLT, TCPC, FSK, PSEC, and MFIC.
This series is the easiest place to find charts providing up-to-date comparisons across the sector.
Note on Book Values
I’ve updated the charts to use Q3 2023 book values. These are much closer to current book values. Companies that have not reported values for Q3 2023 will be blank. We don’t want to put Q2 2023 and Q3 2023 BVs in the same charts due to the significant changes.
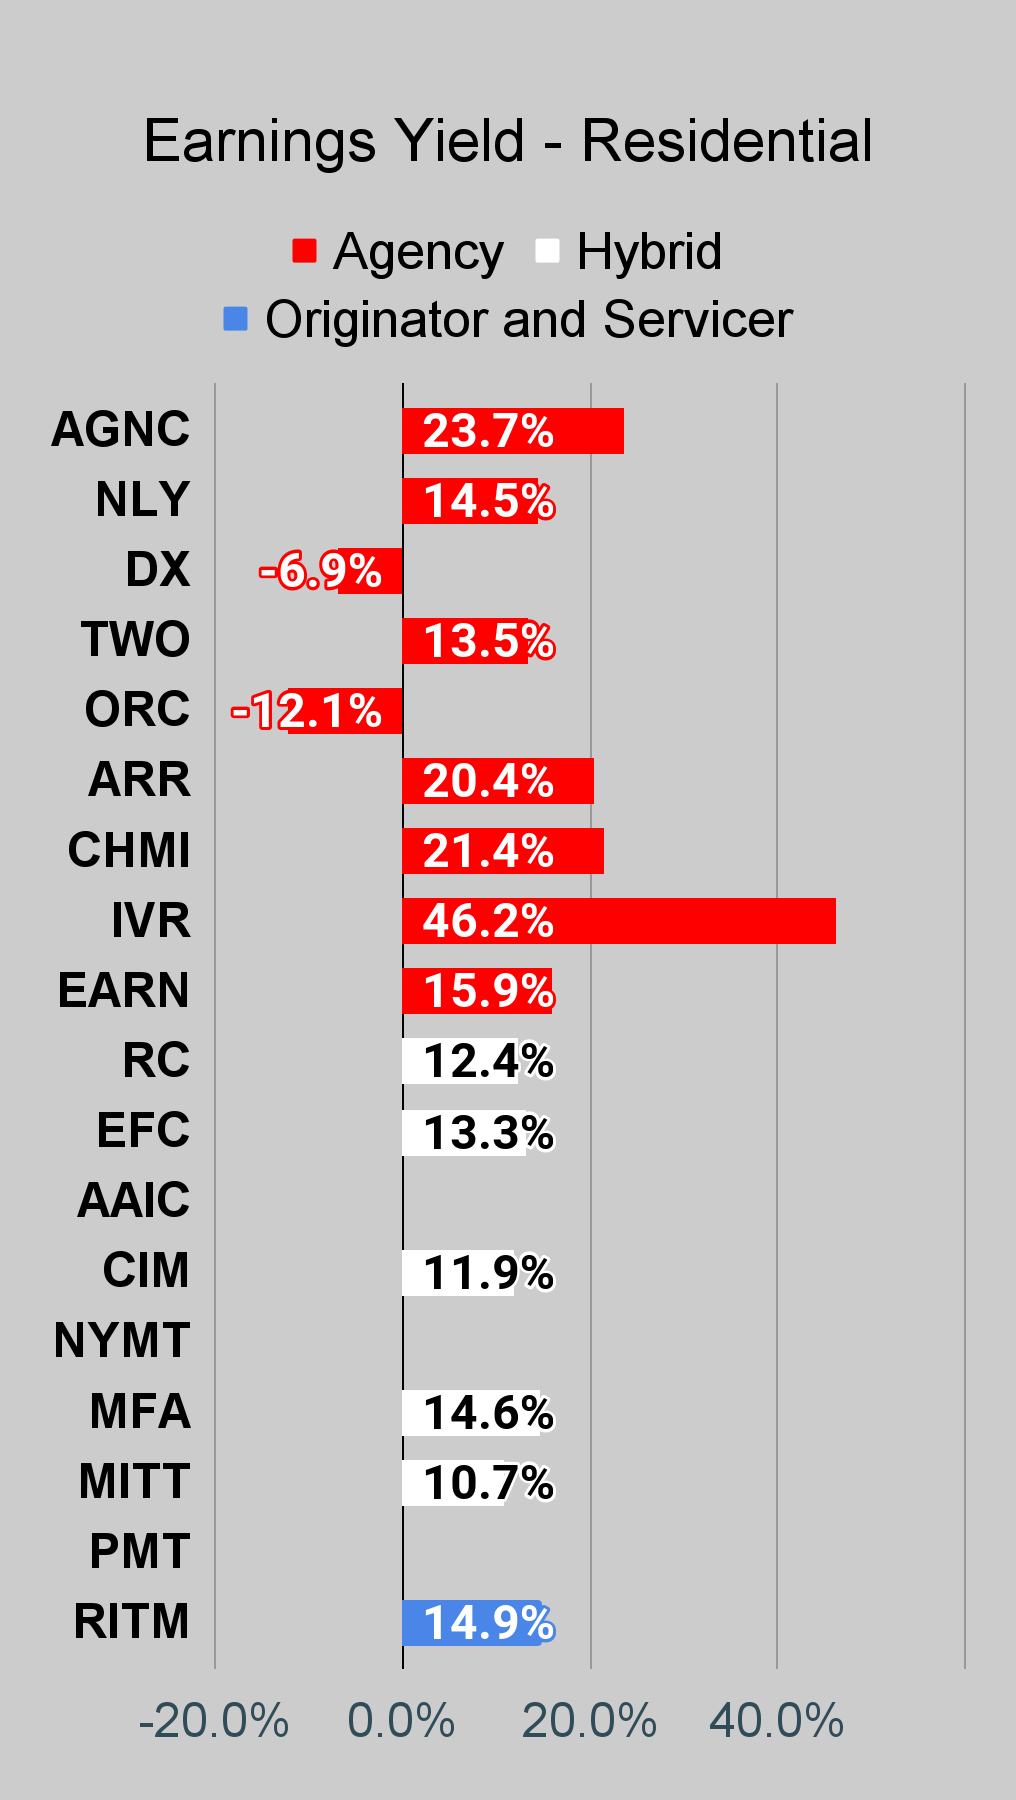
Residential Mortgage REIT Charts
Note: The chart for our public articles uses the book value per share from the quarter indicated in the chart. We use the current estimated (proprietary estimates) book value per share to determine our targets and trading decisions. It is available in our service, but those estimates are not included in the charts below. PMT and NYMT are not showing an earnings yield metric as neither REIT provides a quarterly “Core EPS” metric. Presently, a few other REITs also have no consensus estimate.
Second Note: Due to the way historical amortized cost and hedging is factored into the earnings metrics, it is possible for two mortgage REITs with similar portfolios to post materially different metrics for earnings. I would be very cautious about putting much emphasis on the consensus analyst estimate (which is used to determine the earnings yield). In particular, throughout late 2022 the earnings metric became less comparable for many REITs.
Commercial Mortgage REIT Charts
BDC Charts
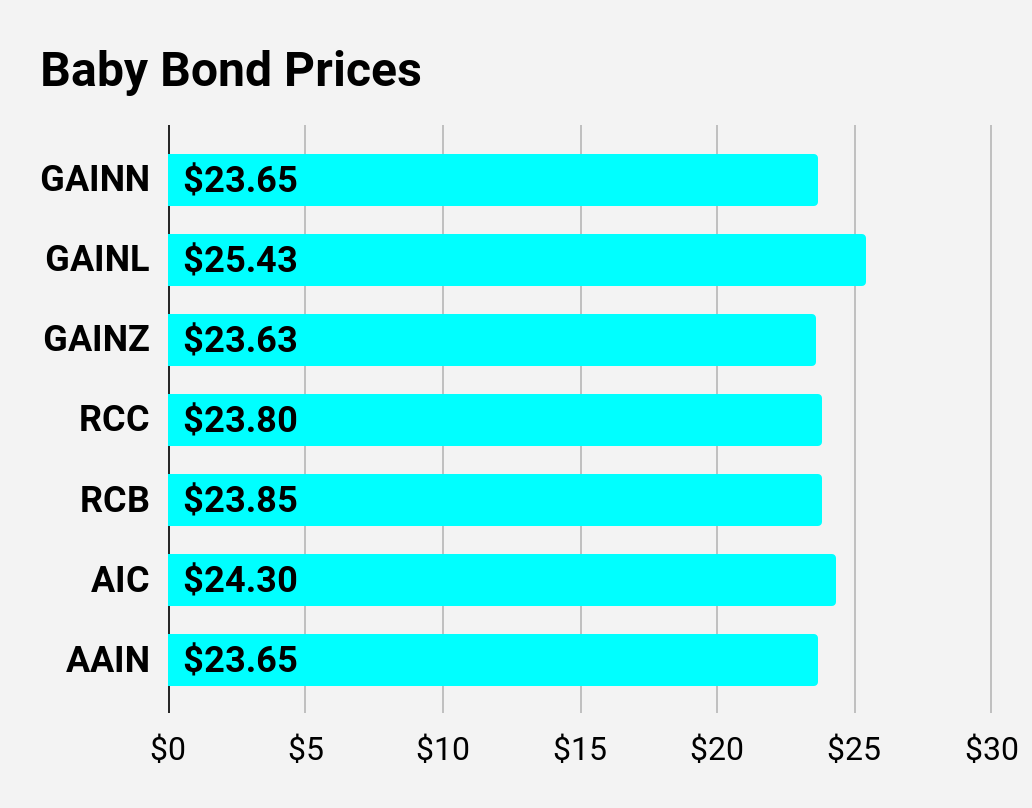
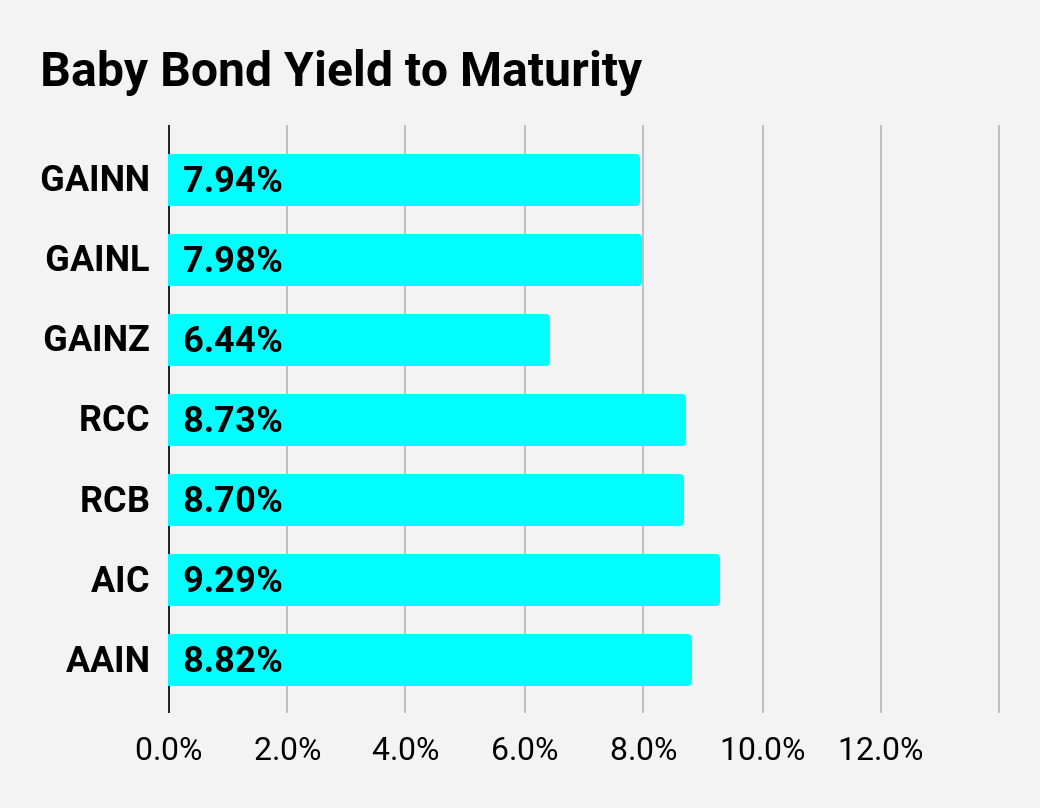
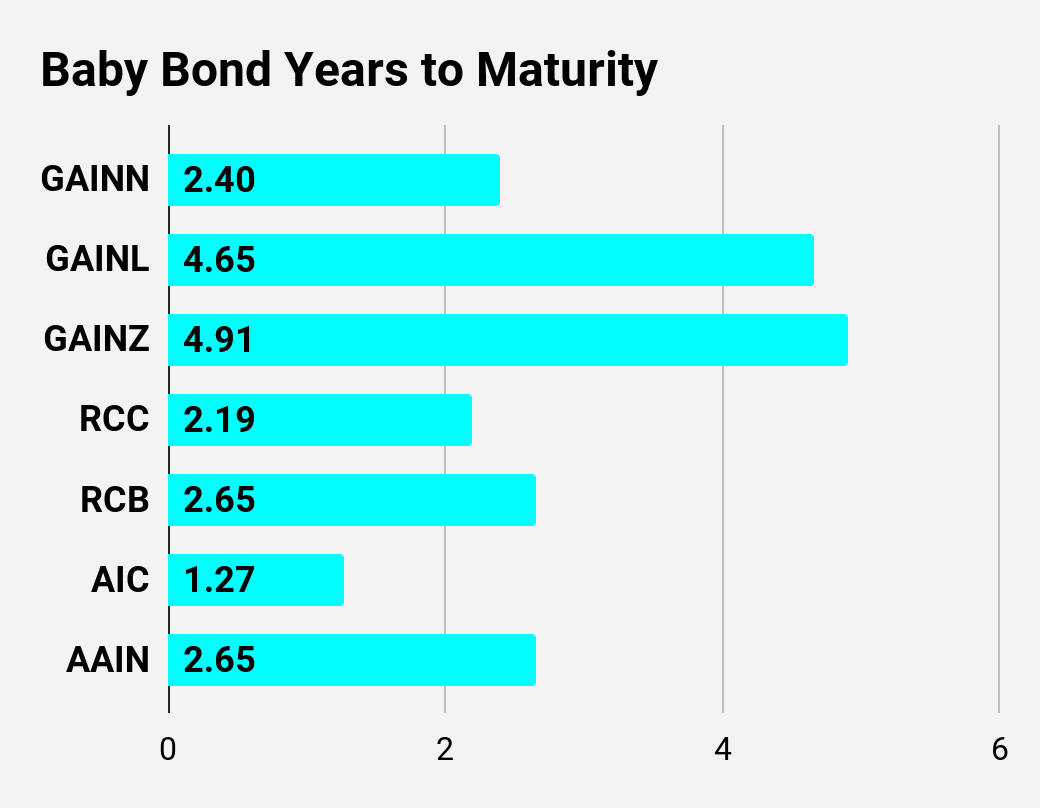
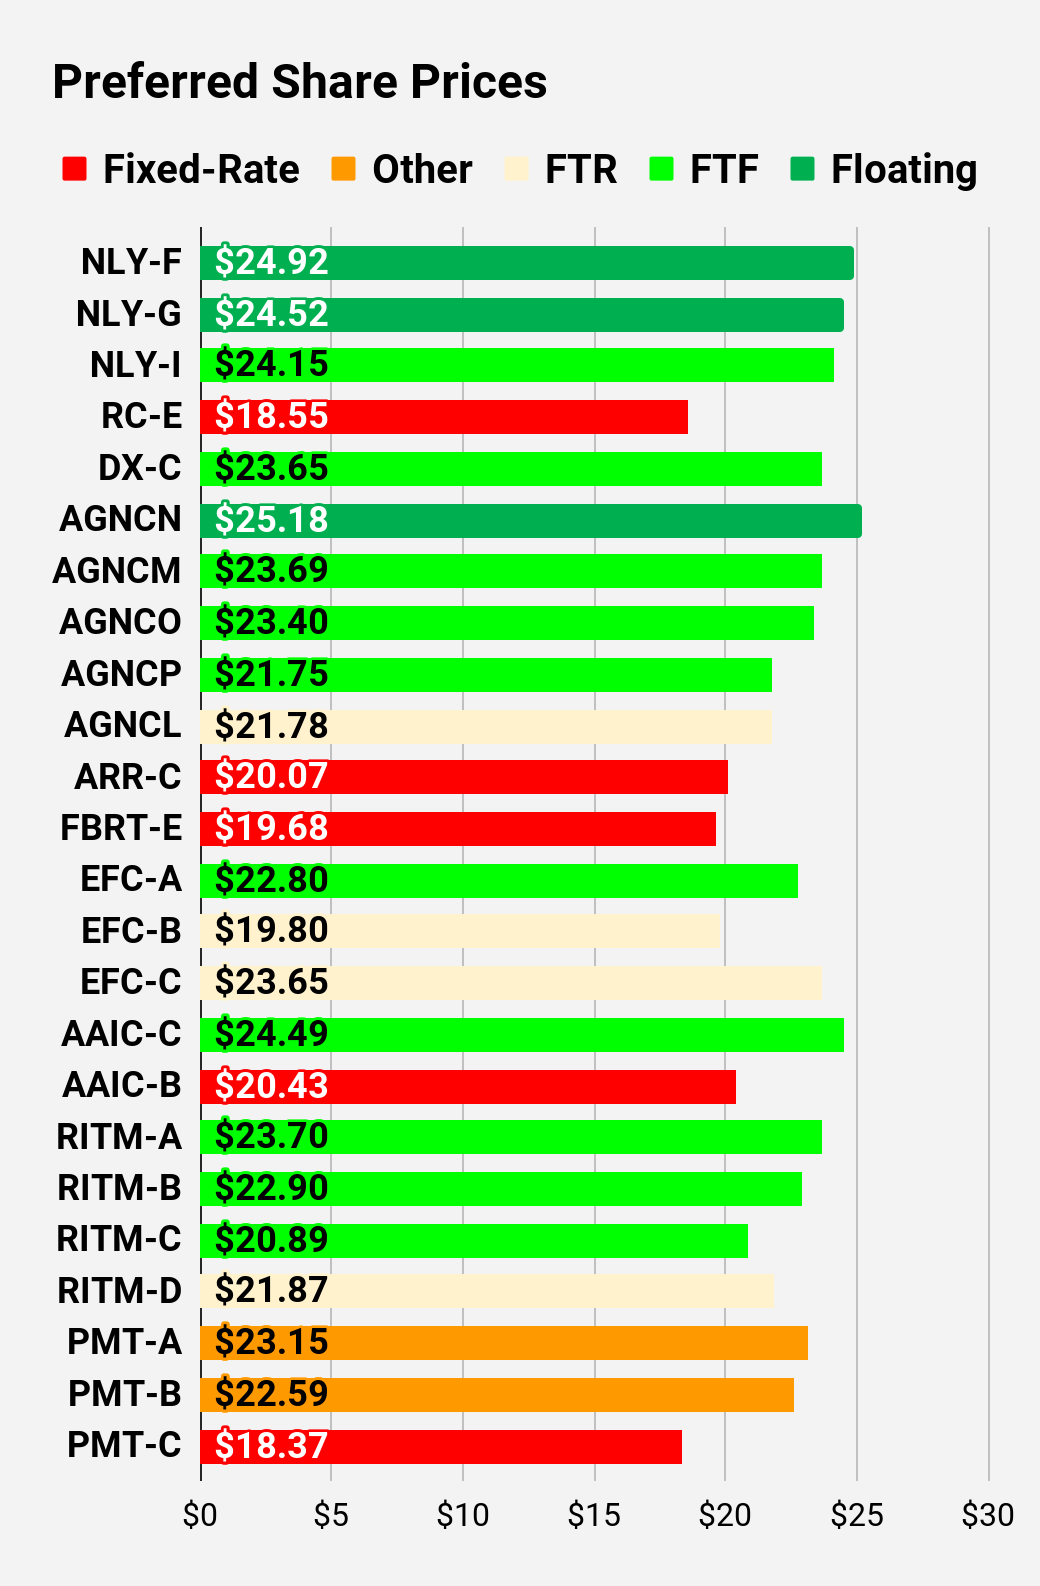
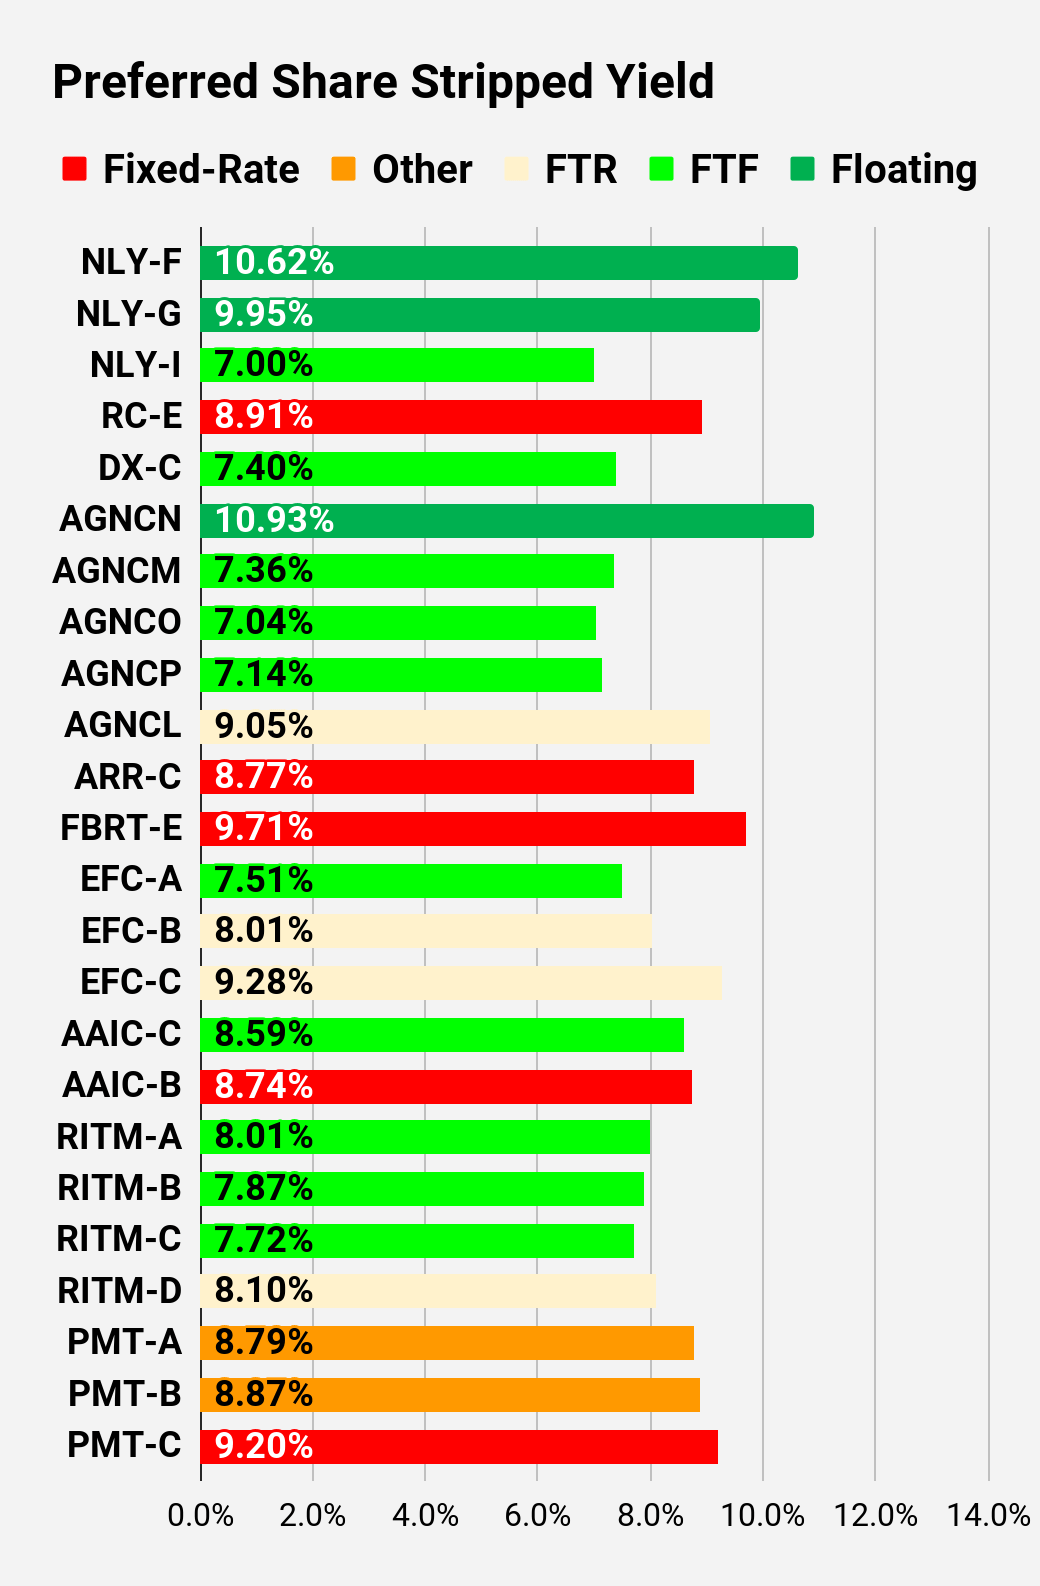
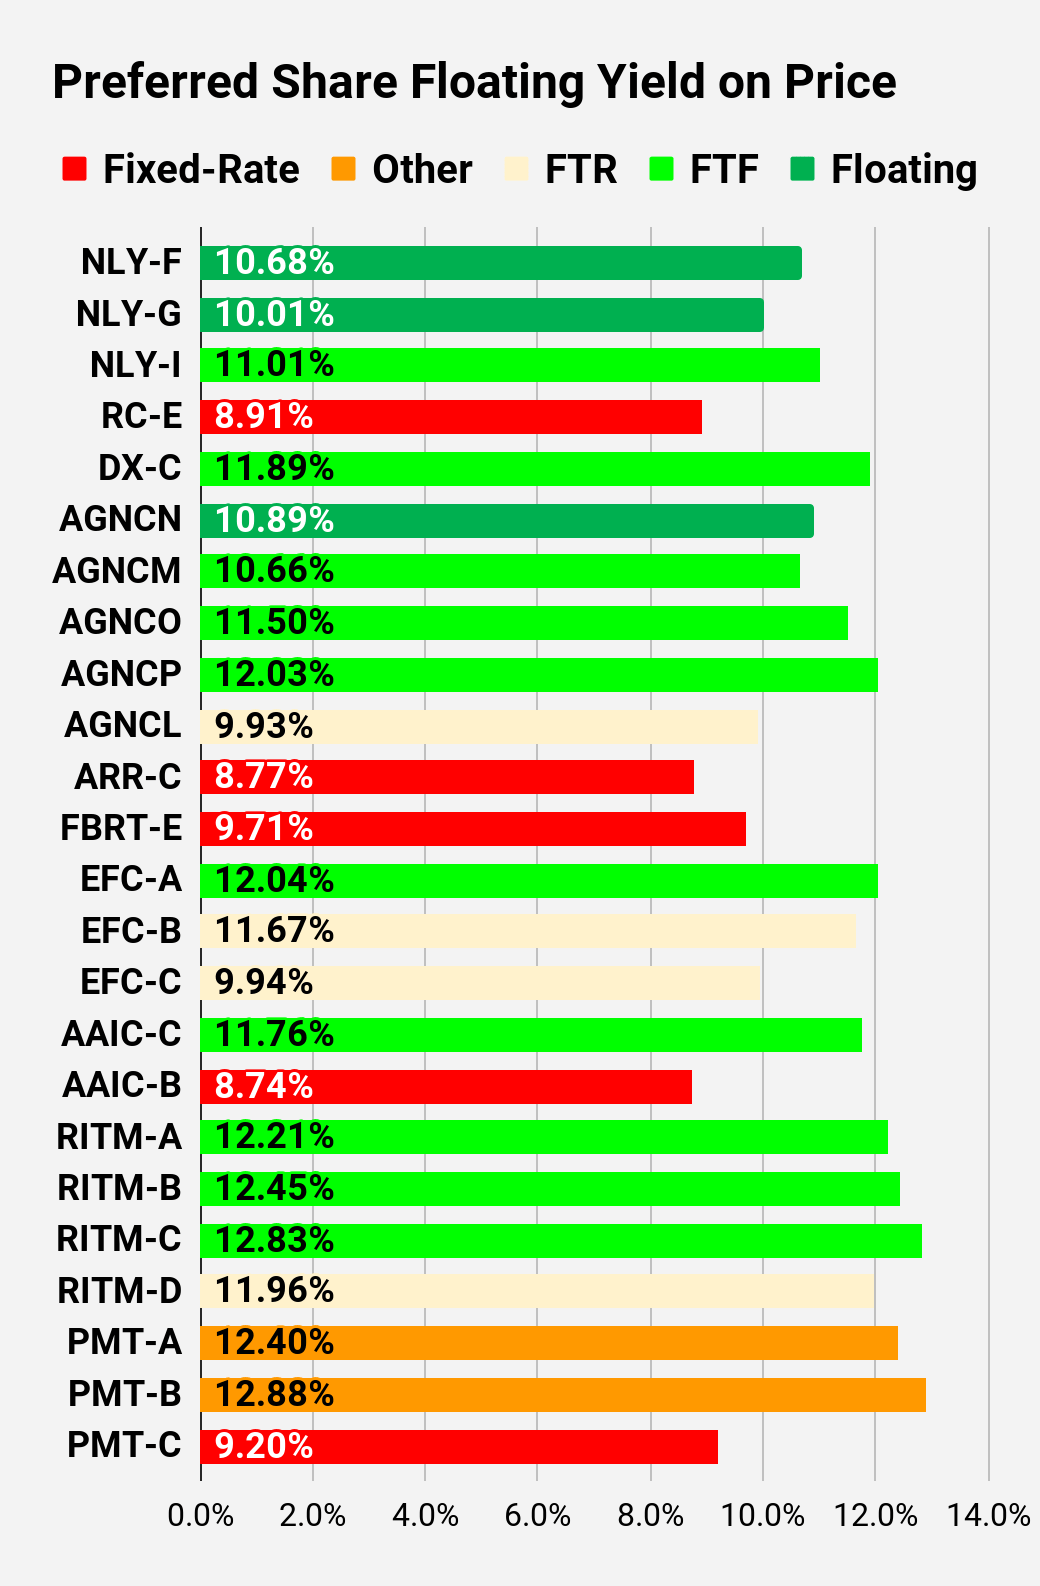
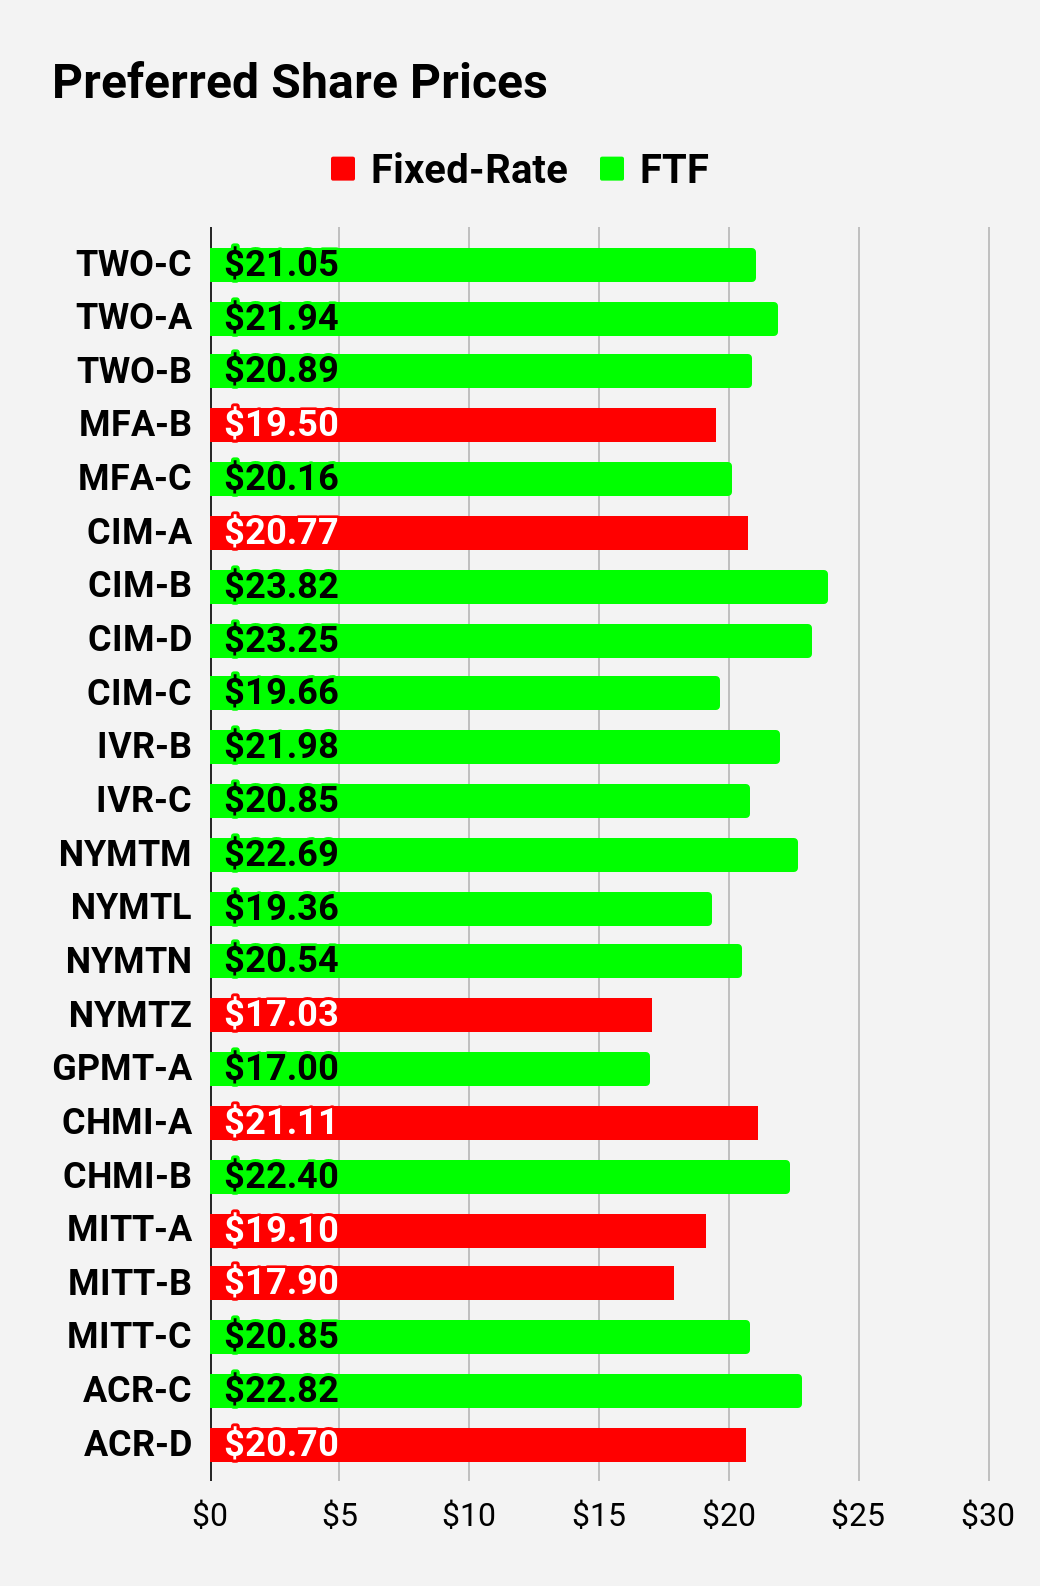
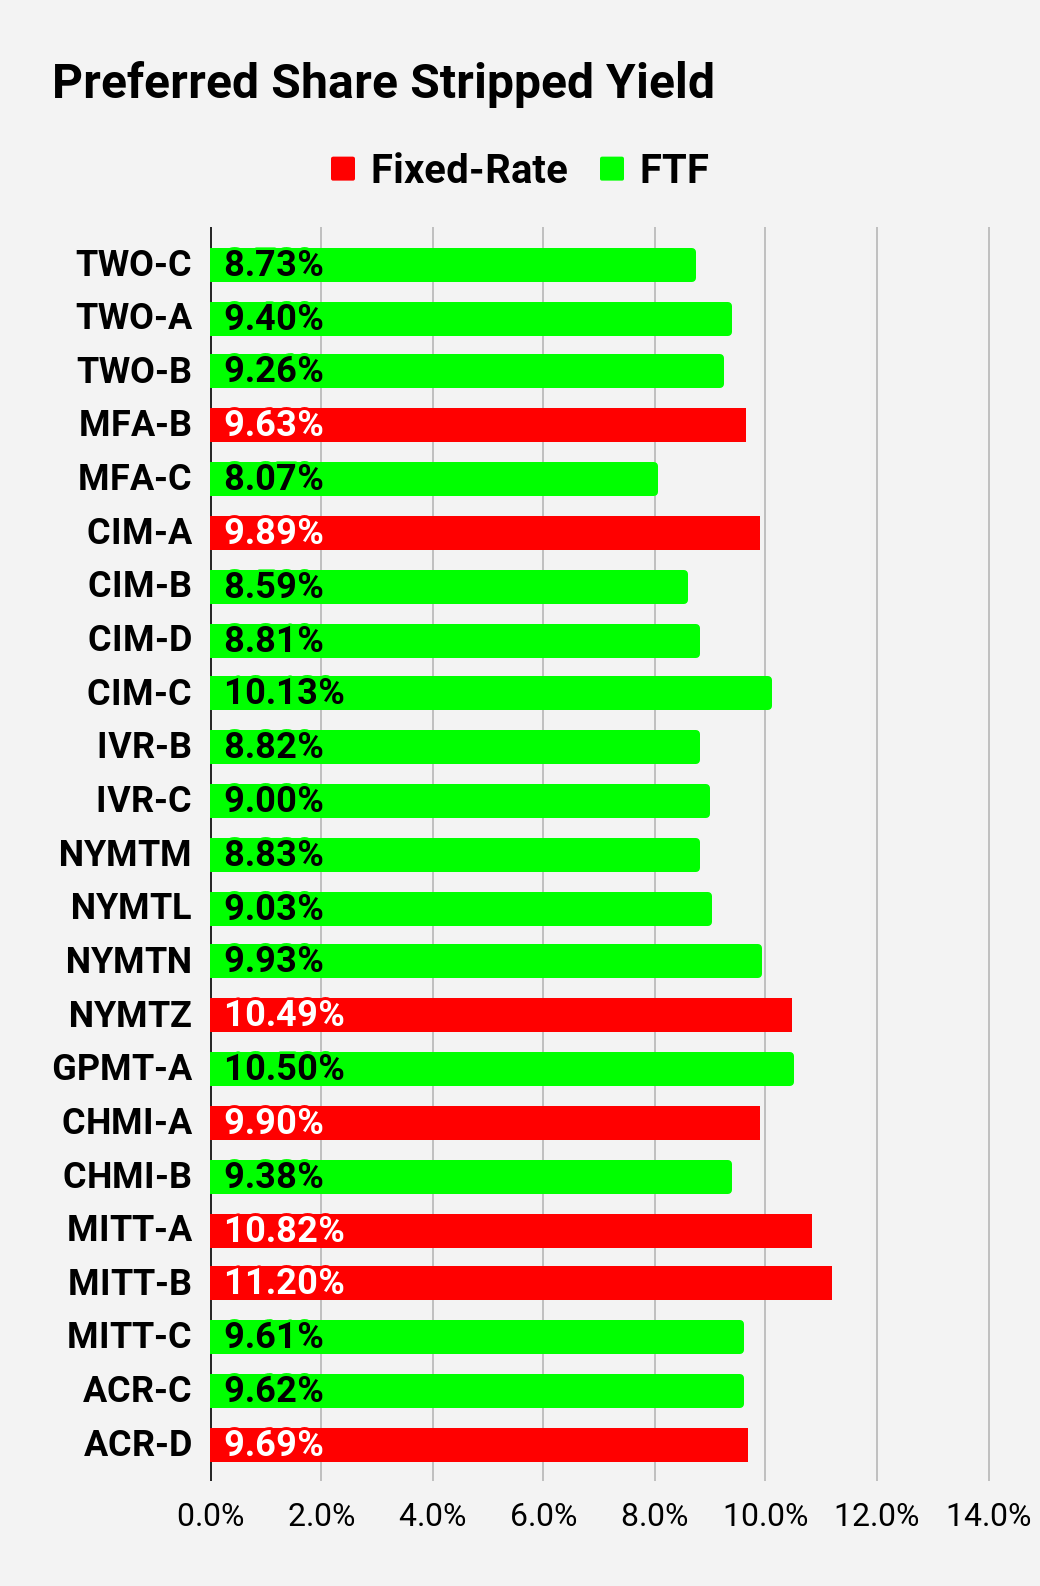
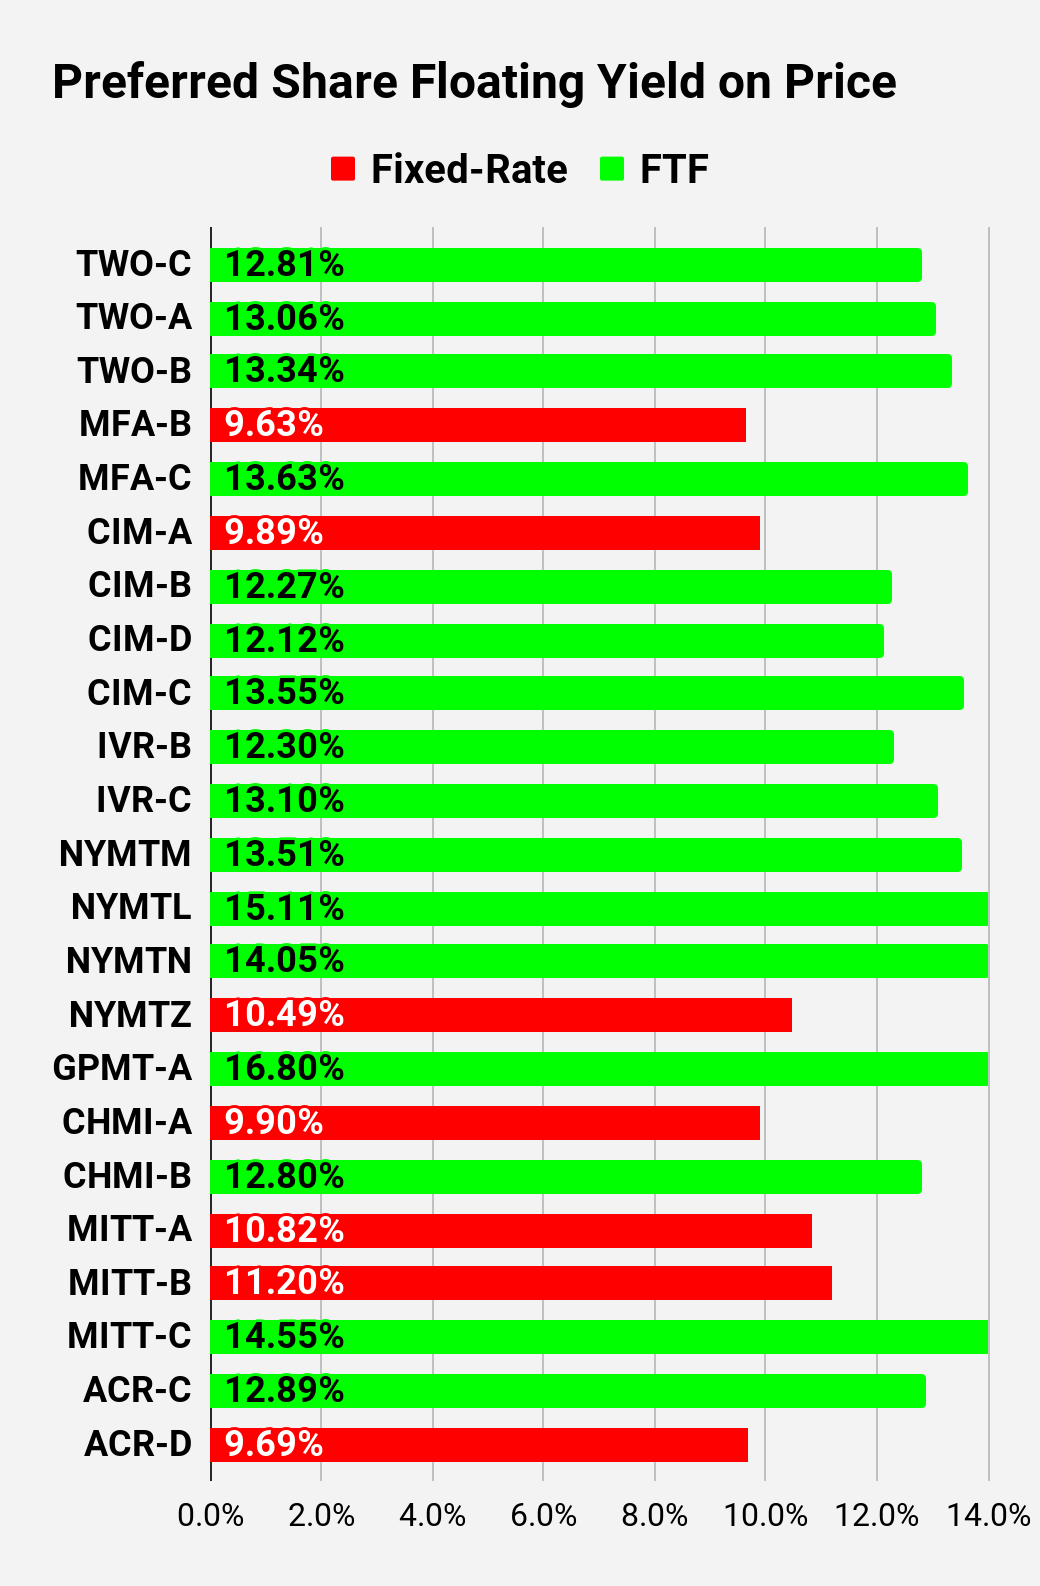
Preferred Share and Baby Bond Charts
I changed the coloring a bit. We needed to adjust to include that the first fixed-to-floating shares have transitioned over to floating rates. When a share is already floating, the stripped yield may be different from the “Floating Yield on Price” due to changes in interest rates. For instance, NLY-F already has a floating rate. However, the rate is only reset once per 3 months. The stripped yield is calculated using the upcoming projected dividend payment and the “Floating Yield on Price” is based on where the dividend would be if the rate reset today. In my opinion, for these shares the “Floating Yield on Price” is clearly the more important metric.
| The REIT Forum |
| The REIT Forum |
| The REIT Forum |
| The REIT Forum |
| The REIT Forum |
| The REIT Forum |
| The REIT Forum |
| The REIT Forum |
| The REIT Forum |
Note: Shares that are classified as “Other” are not necessarily the same. Within our Investing Group, we provide further distinction. For the purpose of these charts, I lumped all of them together as “Other.” Now there are only two left, PMT-A and PMT-B. Those both have the same issue. Management claims the shares will be fixed-rate, even though the prospectus says they should be fixed-to-floating.
Preferred Share Data
Beyond the charts, we’re also providing our readers with access to several other metrics for the preferred shares.
After testing out a series on preferred shares, we decided to try merging it into the series on common shares. After all, we are still talking about positions in mortgage REITs. We don’t have any desire to cover preferred shares without cumulative dividends, so any preferred shares you see in our column will have cumulative dividends. You can verify that by using Quantum Online. We’ve included the links in the table below.
To better organize the table, we needed to abbreviate column names as follows:
- Price = Recent Share Price - Shown in Charts
- S-Yield = Stripped Yield - Shown in Charts
- Coupon = Initial Fixed-Rate Coupon
- FYoP = Floating Yield on Price - Shown in Charts
- NCD = Next Call Date (the soonest shares could be called)
- Note: For all FTF issues, the floating rate would start on NCD.
- WCC = Worst Cash to Call (lowest net cash return possible from a call)
- QO Link = Link to Quantum Online Page
| Ticker |
| Price |
| S-Yield |
| Coupon |
| FYoP |
| NCD |
| WCC |
| QO Link |
| P-Link |
| $23.65 |
| $0.08 |
| $0.05 |
| 7.94% |
| 1/6/2024 |
| $1.58 |
| $25.43 |
| $0.08 |
| $0.08 |
| 7.98% |
| 8/1/2025 |
| $3.09 |
| $23.63 |
| $0.06 |
| $0.05 |
| 6.44% |
| 1/6/2024 |
| $1.60 |
| $23.80 |
| $0.09 |
| $0.06 |
| 8.73% |
| 1/6/2024 |
| $1.47 |
| $23.85 |
| $0.09 |
| $0.06 |
| 8.70% |
| 1/6/2024 |
| $1.44 |
| $24.30 |
| $0.09 |
| $0.07 |
| 9.29% |
| 1/6/2024 |
| $0.79 |
| $23.65 |
| $0.09 |
| $0.06 |
| 8.82% |
| 1/6/2024 |
| $1.61 |
Second batch:
| Ticker |
| Price |
| S-Yield |
| Coupon |
| FYoP |
| NCD |
| WCC |
| QO Link |
| P-Link |
| $24.92 |
| $0.11 |
| $0.11 |
| 10.68% |
| 1/6/2024 |
| $0.13 |
| $24.52 |
| $0.10 |
| $0.10 |
| 10.01% |
| 1/6/2024 |
| $0.52 |
| $24.15 |
| $0.07 |
| $0.07 |
| 11.01% |
| 6/30/2024 |
| $1.69 |
| $18.55 |
| $0.09 |
| $0.07 |
| 8.91% |
| 6/10/2026 |
| $10.71 |
| $23.65 |
| $0.07 |
| $0.07 |
| 11.89% |
| 4/15/2025 |
| $3.94 |
| $25.18 |
| $0.11 |
| $0.11 |
| 10.89% |
| 1/6/2024 |
| $0.45 |
| $23.69 |
| $0.07 |
| $0.07 |
| 10.66% |
| 4/15/2024 |
| $2.18 |
| $23.40 |
| $0.07 |
| $0.07 |
| 11.50% |
| 10/15/2024 |
| $3.24 |
| $21.75 |
| $0.07 |
| $0.06 |
| 12.03% |
| 4/15/2025 |
| $5.56 |
| $21.78 |
| $0.09 |
| $0.08 |
| 9.93% |
| 10/15/2027 |
| $10.99 |
| $20.07 |
| $0.09 |
| $0.07 |
| 8.77% |
| 1/28/2025 |
| $6.97 |
| $19.68 |
| $0.10 |
| $0.08 |
| 9.71% |
| 1/6/2024 |
| $5.75 |
| $22.80 |
| $0.08 |
| $0.07 |
| 12.04% |
| 10/30/2024 |
| $3.90 |
| $19.80 |
| $0.08 |
| $0.06 |
| 11.67% |
| 1/30/2027 |
| $10.30 |
| $23.65 |
| $0.09 |
| $0.09 |
| 9.94% |
| 4/30/2028 |
| $11.08 |
| $24.49 |
| $0.09 |
| $0.08 |
| 11.76% |
| 3/30/2024 |
| $1.46 |
| $20.43 |
| $0.09 |
| $0.07 |
| 8.74% |
| 1/6/2024 |
| $4.97 |
| $23.70 |
| $0.08 |
| $0.08 |
| 12.21% |
| 8/15/2024 |
| $2.72 |
| $22.90 |
| $0.08 |
| $0.07 |
| 12.45% |
| 08/15/2024 |
| $3.45 |
| $20.89 |
| $0.08 |
| $0.06 |
| 12.83% |
| 02/15/2025 |
| $6.12 |
| $21.87 |
| $0.08 |
| $0.07 |
| 11.96% |
| 11/15/2026 |
| $8.40 |
| $23.15 |
| $0.09 |
| $0.08 |
| 12.40% |
| 3/15/2024 |
| $2.36 |
| $22.59 |
| $0.09 |
| $0.08 |
| 12.88% |
| 6/15/2024 |
| $3.41 |
| $18.37 |
| $0.09 |
| $0.07 |
| 9.20% |
| 8/24/2026 |
| $11.17 |
Third batch:
| Ticker |
| Price |
| S-Yield |
| Coupon |
| FYoP |
| NCD |
| WCC |
| QO Link |
| P-Link |
| $21.05 |
| $0.09 |
| $0.07 |
| 12.81% |
| 1/27/2025 |
| $6.22 |
| $21.94 |
| $0.09 |
| $0.08 |
| 13.06% |
| 4/27/2027 |
| $10.17 |
| $20.89 |
| $0.09 |
| $0.08 |
| 13.34% |
| 7/27/2027 |
| $11.26 |
| $19.50 |
| $0.10 |
| $0.08 |
| 9.63% |
| 1/6/2024 |
| $5.54 |
| $20.16 |
| $0.08 |
| $0.07 |
| 13.63% |
| 3/31/2025 |
| $6.88 |
| $20.77 |
| $0.10 |
| $0.08 |
| 9.89% |
| 1/6/2024 |
| $4.86 |
| $23.82 |
| $0.09 |
| $0.08 |
| 12.27% |
| 3/30/2024 |
| $2.27 |
| $23.25 |
| $0.09 |
| $0.08 |
| 12.12% |
| 3/30/2024 |
| $2.84 |
| $19.66 |
| $0.10 |
| $0.08 |
| 13.55% |
| 9/30/2025 |
| $9.31 |
| $21.98 |
| $0.09 |
| $0.08 |
| 12.30% |
| 12/27/2024 |
| $4.97 |
| $20.85 |
| $0.09 |
| $0.08 |
| 13.10% |
| 9/27/2027 |
| $11.19 |
| $22.69 |
| $0.09 |
| $0.08 |
| 13.51% |
| 1/15/2025 |
| $4.78 |
| $19.36 |
| $0.09 |
| $0.07 |
| 15.11% |
| 10/15/2026 |
| $10.80 |
| $20.54 |
| $0.10 |
| $0.08 |
| 14.05% |
| 10/15/2027 |
| $12.47 |
| $17.03 |
| $0.10 |
| $0.07 |
| 10.49% |
| 1/15/2027 |
| $13.67 |
| $17.00 |
| $0.11 |
| $0.07 |
| 16.80% |
| 11/30/2026 |
| $13.46 |
| $21.11 |
| $0.10 |
| $0.08 |
| 9.90% |
| 1/6/2024 |
| $4.29 |
| $22.40 |
| $0.09 |
| $0.08 |
| 12.80% |
| 4/15/2024 |
| $3.56 |
| $19.10 |
| $0.11 |
| $0.08 |
| 10.82% |
| 1/6/2024 |
| $5.97 |
| $17.90 |
| $0.11 |
| $0.08 |
| 11.20% |
| 1/6/2024 |
| $7.17 |
| $20.85 |
| $0.10 |
| $0.08 |
| 14.55% |
| 9/17/2024 |
| $5.62 |
| $22.82 |
| $0.10 |
| $0.09 |
| 12.89% |
| 7/30/2024 |
| $3.81 |
| $20.70 |
| $0.10 |
| $0.08 |
| 9.69% |
| 5/21/2026 |
| $9.35 |
Strategy
Our goal is to maximize total returns . We achieve those most effectively by including “trading” strategies. We regularly trade positions in the mortgage REIT common shares and BDCs because:
- Prices are inefficient.
- Long-term, share prices generally revolve around book value.
- Short-term, price-to-book ratios can deviate materially.
- Book value isn’t the only step in analysis, but it is the cornerstone.
We also allocate to preferred shares and equity REITs. We encourage buy-and-hold investors to consider using more preferred shares and equity REITs.
For further details see:
Rates Plunge, REITs Rip, Bears Attack