SHV - Rates: Reasons The Upside Can Be Tested
Summary
- One key element ahead is the probability that the ECB will hike by more than the Fed does in 2023.
- In the US, the spread between the 10yr yield and front-end rates is remarkably stretched, as can be gleaned from the deep inversion of the curve.
- We identify the US 10yr as being exceptionally rich to the money market rates.
By Padhraic Garvey, CFA , Regional Head of Research, Americas
Most macro indicators argue for more downward pressure on market rates. However, we think things are more nuanced than that. Belated ECB and Bank of Japan tightening, and remarkably low US market rates versus the Fed’s ambitions, present reasons for market rates to back up a bit from here.
Eurozone and Japanese rates primed to provide independent upside pressure
One key element ahead is the probability that the ECB will hike by more than the Fed does in 2023. This is a factor that can push global market rates higher, as it implies a narrowing in the spread between Treasury and Bund yields, driven by independent upward pressure on Bund yields. A second related element is the upward pressure being brought to bear on Japanese government bond (JGB) yields. The 50bp cap on the 10yr JGB yield is yet again being tested by the market. This is another independent pressure that will act to narrow spreads to Treasuries, adding an upside excuse for core global yields generally.
In the US, it's a story of a remarkably stretched full curve inversion
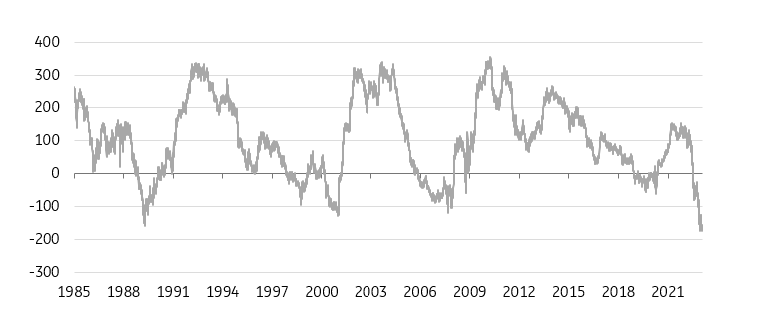
In the US, the spread between the 10yr yield and front-end rates is remarkably stretched, as can be gleaned from the deep inversion of the curve. While an inverted curve is perfectly normal as we approach the end of a rate hiking cycle, it’s the degree of inversion that’s startling. There are many ways to measure this. The graph below is one. It shows the 10yr yield currently at 1.7% below the 6mth Libor rate (we use the 6mth tenor to incorporate future hikes). This has never been so stretched (on data going back to the 1980s).
6mth Libor is a staggering 1.7% above the US 10yr
Basis points
Never before (since the 1990s at least) has the 10yr been so rich at this stage of the cycle
There is another important element to consider – timing. It is not at all unusual for the 10yr to trade below money market rates as the Fed approaches the peak in the cycle. In fact, it’s like that in practically every cycle. But the extreme, where the 10yr trades most through money market rates, tends to be just before the Fed is about to execute a first cut (having held rates at a peak for a number of months). Here, however, we have similar extremes while the Fed is still hiking. This is unprecedented.
To put some numbers on this, past cycles have typically seen the 10yr trade some 75bp below the Funds rate on the eve of a rate cut. The most extreme version was during the dotcom bust when the 10yr was some 150bp through the Fed funds rate just before the first cut. Fast forward to today, and the 10yr yield is already 83bp below the Funds rate. If the 10yr yield remains here (at around 3.5%), that stretches to 108bp after the expected hike on 1 February, and if we get a March hike, it stretches it further to 133bp. That’s against a backdrop where the Fed is nowhere near an actual rate cut.
Bottom line, we identify the US 10yr as being exceptionally rich to the money market rates, and we see independent pressure for upside to market yields from the eurozone and Japan. That’s an important counter to weak macro data that’s been driving market yields lower since late 2022.
Content Disclaimer
This publication has been prepared by ING solely for information purposes irrespective of a particular user's means, financial situation or investment objectives. The information does not constitute investment recommendation, and nor is it investment, legal or tax advice or an offer or solicitation to purchase or sell any financial instrument. Read more .
Editor's Note: The summary bullets for this article were chosen by Seeking Alpha editors.
For further details see:
Rates: Reasons The Upside Can Be Tested