PDO - RCS Vs. IGLB: PIMCO Fund Struggling With Distribution Coverage
2023-10-04 10:28:42 ET
Summary
- This is not going to be an apples to apples comparison.
- But the goal here is to minimize risk and maximize returns relative to that risk, and that is what we are trying to do here.
- Let us look at PIMCO Strategic Income Fund and see why switching to IGLB might be a fit.
PIMCO Strategic Income Fund ( RCS )
RCS is a closed end fund that invests in intermediate-term, debt securities of all shapes and forms. At August 31, majority of this fund's holdings were mortgage backed securities, followed by high yield or junk securities. Investment grade credit bought up the rear in the top trio.
RCS - Aug 31, 2023
While the fund is comprised predominantly of US securities, the globe is its playground in the quest to beat the income earned by "high quality, intermediate-term U.S. debt securities".
RCS - Aug 31, 2023
Majority of its holdings have a remaining term to maturity of 5 years or less, with the effective maturity at the portfolio level being 4.6 years.
RCS - Aug 31, 2023
The effective duration is a very modest 3 years, which shows this fund in a very good light in terms of interest rate risk. Generally speaking, duration indicates the extent to which the value of a portfolio declines with a corresponding 100 basis points change in the underlying rates. The relationship is inverse. So in the case of RCS the 3 years denotes that if the interest rates rise by 100 basis points, the portfolio value will decline by 300 basis points, and vice versa.
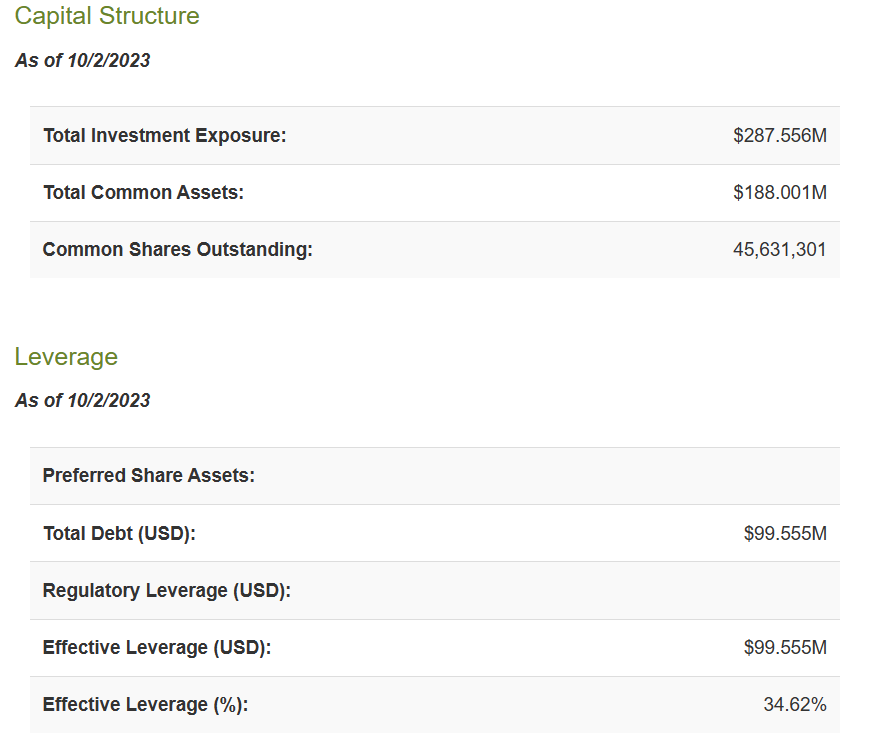
RCS, like several other closed end funds that seek to provide high income, employs leverage. The current numbers have it at more than a third of the total asset value.
This leverage is in the form of reverse repurchase agreements, explained by Investopedia as
A reverse repurchase agreement (RRP), or reverse repo, is the sale of securities with the agreement to repurchase them at a higher price at a specific future date. A reverse repo refers to the seller side of a repurchase agreement ((RP)), or repo.
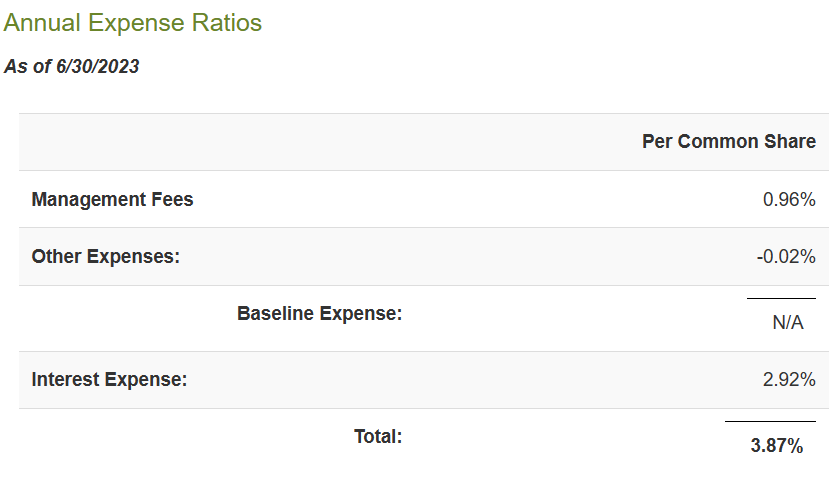
The difference between the sale and the repurchase price, constitutes the interest portion. In the case of RCS, the interest portion has shown quite the jump from the 2022 annual report to the 2023 annual report. The number that used to be 0.44% (FY ending June 2022) is now 2.92%.
This too vastly underplays the current state of affairs. Interest rates have been rising relentlessly since early 2022 and the weighted average expense ratio for the July 2022 to June 2023 period is nowhere near the current expense ratio. The latter we would estimate to be well over 5%. Despite the risks that leverage brings, this fund is very popular due to its hefty yield of close to 12%. This yield is based on its monthly payout of 5.1 cents and current price of $5.21.
iShares 10+ Year Investment Grade Corporate Bond ETF ( IGLB )
IGLB is a passive, exchange traded fund, that pursues the performance of an index comprised of investment-grade, US corporate bonds, with remaining term to maturity of greater than 10 years. The most recent numbers show that the close to half of the portfolio is invested in BBB rated securities, which is the last rung of the investment-grade scale.
IGLB
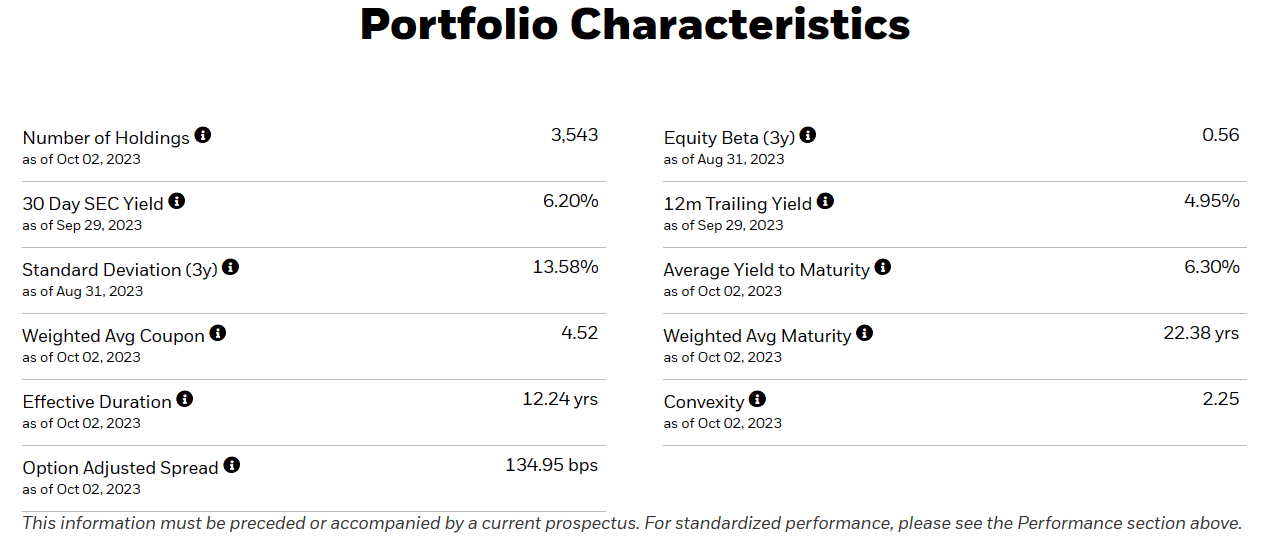
As expected, and based on this ETF's mandate, all of the holdings mature in more than 10 years, with over 60% falling in the 20+ years category. The average maturity at the portfolio level is 22.38 years.
IGLB
IGLB holds around 3,500 securities, with close to 60% of the portfolio concentrated in the top 5 sectors.
IGLB
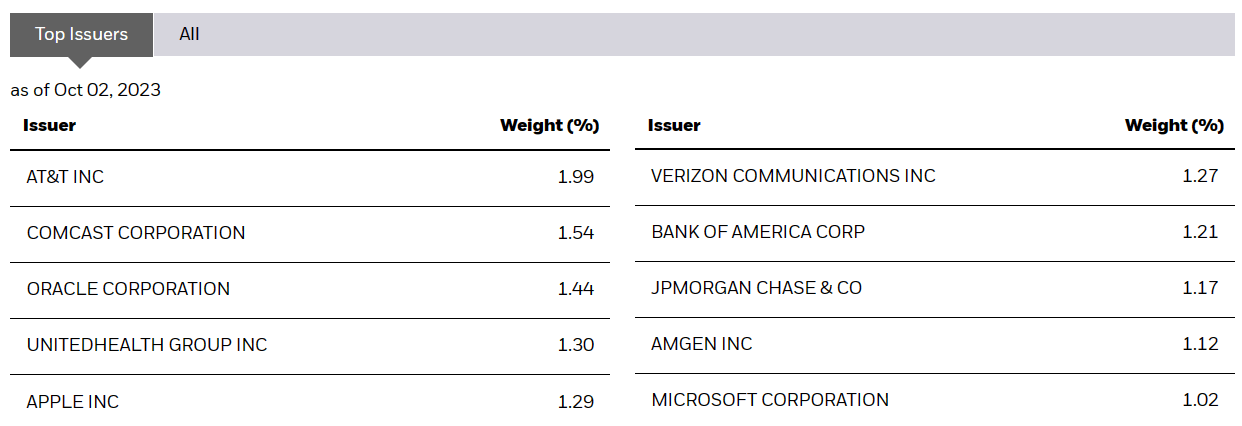
The top 10 issuers include only known names and originate around 13% of the portfolio.
The portfolio collectively has an average yield to maturity of 6.30%.
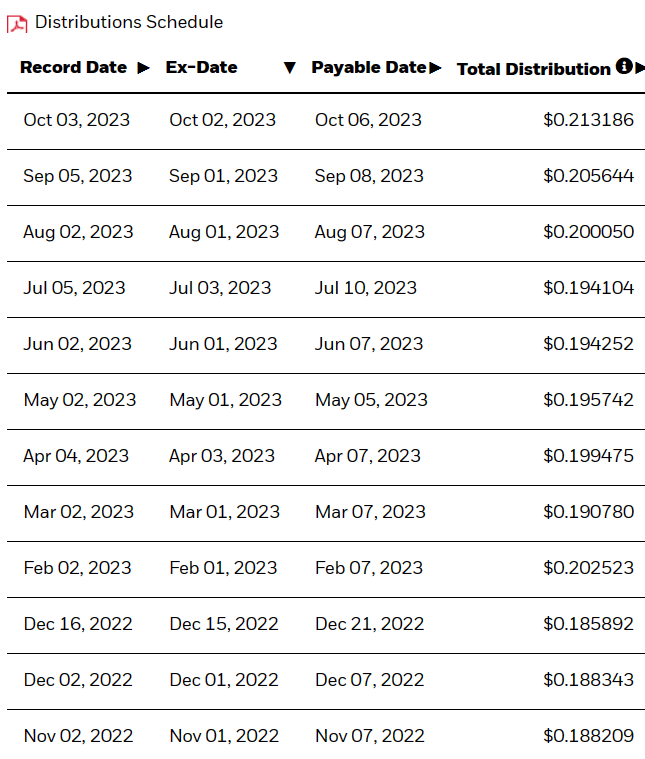
And based on the last distribution of 21.32 cents, investors currently get an yield of 5.13% for holding this fund. The comparatively higher yield to maturity indicates that there is room to grow distributions for IGLB and we can see that general trend over the last few months.
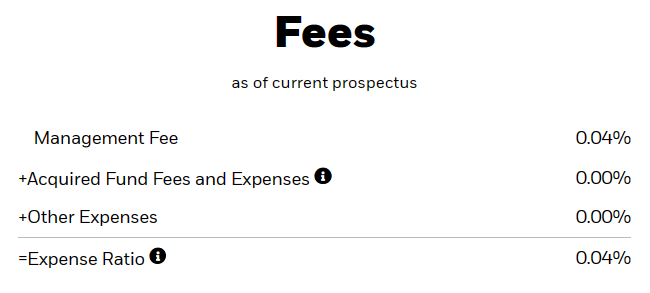
Being a passive ETF, along with belonging to the Blackrock family, affords it economies of scale. The expenses of this fund are a meagre 0.04%.
Relative Performance
Over the last 5 years, bonds have been battered and neither of these two funds will be invited to your Christmas party.
On a price basis, RCS has done far worse than IGLB, which makes sense when you take into account the hefty distributions paid by RCS and the overall negative returns.
Our larger point here is that RCS has done an ok job all things considered but these are not splendid returns over long timeframes.
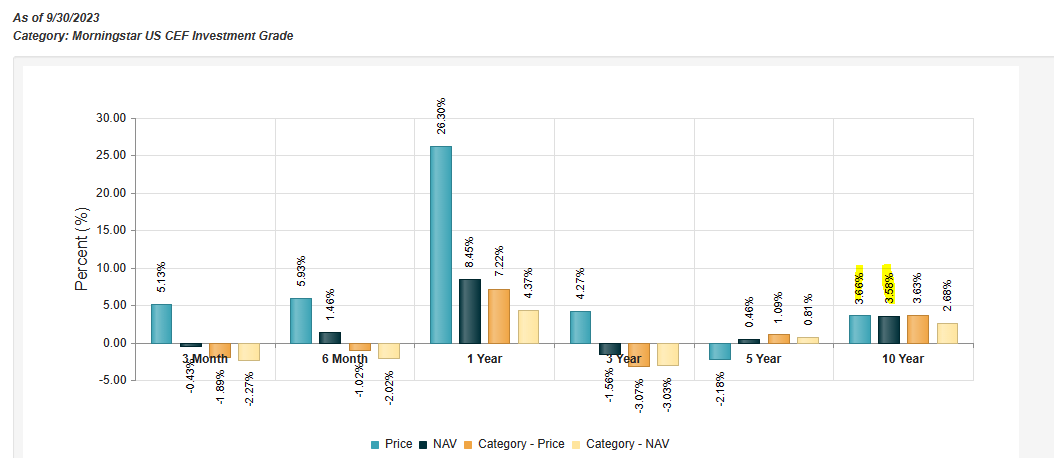
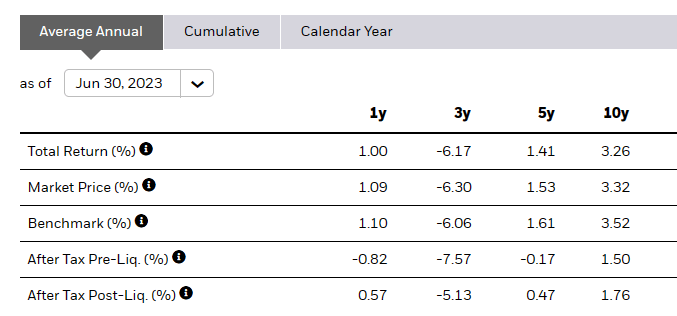
IGLB is not exactly coming out smelling like roses but the 10 year returns are comparable here, considering there was no leverage used.
IGLB has done better over 5 years but worse over 1 and 3 years. One key reason for IGLB having done worse here comes from the remarkably long duration risk that it possesses relative to RCS. If you take more duration risk in a period rising rates, you will get hurt more. But today we believe the setup is far more conducive to buying IGLB over RCS for a few reasons.
The first being that it is now attractive to lock-in long term rates. One measure we use here is the BAA bond yields spread to the S&P 500 ( SPY ) dividend yield.
Long-term corporate bonds are far better choices relative to equities. But aren't you doing that with RCS as well? No. RCS historically has stayed on the shorter end of the curve and this makes it less attractive in our opinion.
The second reason is the leverage. While we believe IGLB will navigate the turbulence of a recession, RCS is less likely to do so well, thanks to the leverage.
The final reason and the most important one is that RCS is still priced for perfection. That 26.78% premium is cruising for a bruising
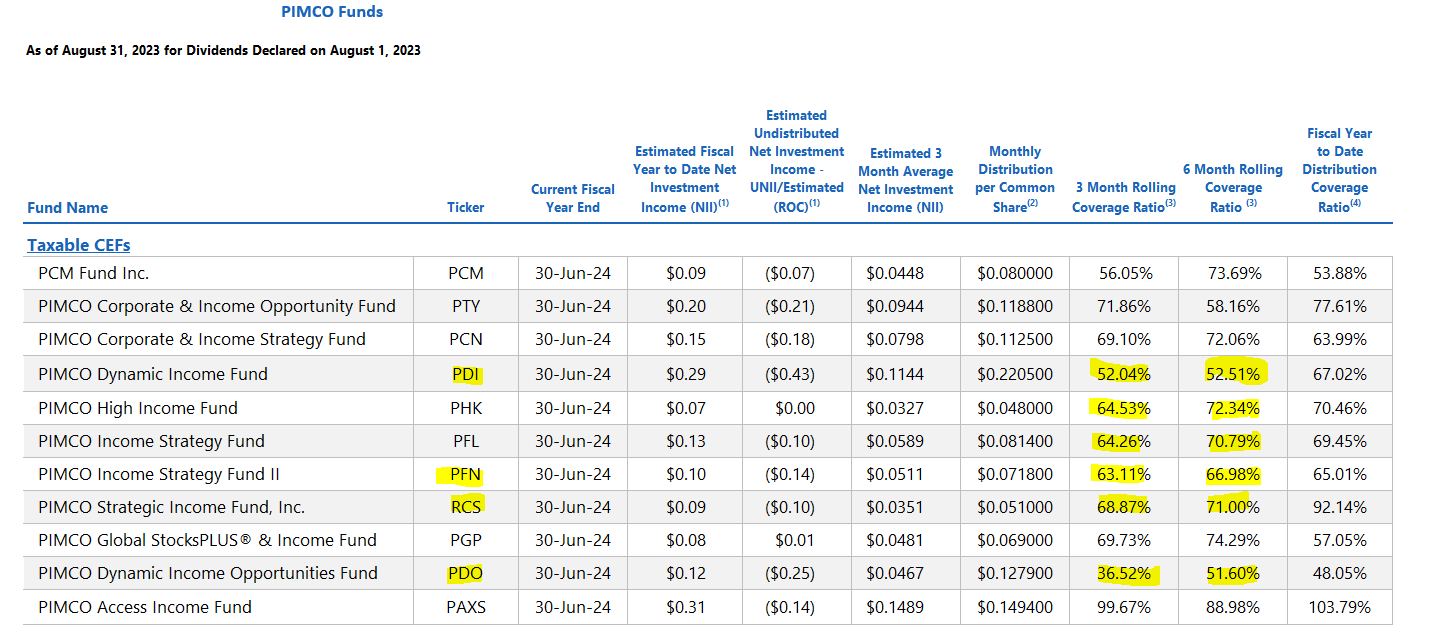
Investors may shun the idea of it moving to NAV, but we have seen that, twice in just the last 3 years! Some of PIMCO's funds are also having difficulty covering the distributions from income. PIMCO Dynamic Income Fund ( PDI ), PIMCO Income Strategy Fund II ( PFN ), PIMCO Dynamic Income Opportunities Fund ( PDO ) & RCS are all on the extremely low side.
But here is the real kicker. Look at their prices relative to their NAV. Which one stands out?
Verdict
We were one of the extremely early bond bears and dodged the bulk of the hit on duration risk. While Treasury bonds remain relatively unattractive relative to Treasury Bills (see our explanation here ), corporate bonds look scintillating relative to equities. Now this might seem like a full fruit salad of a comparison, versus apples to apples, but we hope those comparisons help investors make important decisions. Here, RCS looks like one of the worst risk setups and one we would throw out right out. IGLB or if you prefer its lower duration variant, iShares 5-10 Year Investment Grade Corporate Bond ETF ( IGIB ) are better choices. Buy IGLB/IGIB, Sell RCS.
Please note that this is not financial advice. It may seem like it, sound like it, but surprisingly, it is not. Investors are expected to do their own due diligence and consult with a professional who knows their objectives and constraints.
For further details see:
RCS Vs. IGLB: PIMCO Fund Struggling With Distribution Coverage