PARAP - RDIV: Dividend ETF With 6 Risk Factors
2023-12-04 16:01:10 ET
Summary
- Invesco S&P Ultra Dividend Revenue ETF is a fund that tracks the S&P 900 Dividend Revenue-Weighted Index and has a portfolio of 60 stocks.
- The RDIV fund is overweight in the financial sector and in the top 10 holdings.
- Valuation looks attractive, but quality, volatility, and past performance are not.
This article series aims at evaluating ETFs (exchange-traded funds) regarding the relative past performance of their strategies and metrics of their current portfolios. As holdings change over time, updated reviews are posted from time to time.
RDIV strategy and portfolio
Invesco S&P Ultra Dividend Revenue ETF ( RDIV ) started investing operations on 09/30/2013 and tracks the S&P 900 Dividend Revenue-Weighted Index. It has a portfolio of 60 stocks, a distribution yield of 4.77% and a total expense ratios of 0.39%. Distributions are paid quarterly.
As described by Invesco , eligible stocks must be in the S&P 900 Index (large and mid-caps) excluding the top 5% by dividend yield and the top 5% by payout ratio in each sector. Then, the top 60 stocks by dividend yield are weighted according to revenues, and capped at 5%. The portfolio is reconstituted and rebalanced quarterly .
RDIV is almost exclusively invested in U.S. companies (98% of asset value), with about 38% in large companies, 47% in mid-caps and 15% in small caps. The portfolio is heavily overweight in financials (40.3%). Consumer discretionary and utilities represent 13% and 12% of assets, respectively. Other sectors are below 10%. Compared to the S&P 500 index (SP500), RDIV massively overweights financials, utilities, real estate and materials. It completely ignores industrials, almost energy, and underweights mostly technology and healthcare.
Sector breakdown (chart: author - data: Invesco and SSGA)
The fund is quite concentrated: the top 10 holdings, listed below with fundamental ratios, represent 50% of assets.
| Ticker |
| Name |
| Weight% |
| EPS growth %TTM |
| P/E TTM |
| P/E fwd |
| Yield% |
| Paramount Global |
| 6.19 |
| -137.96 |
| N/A |
| 33.40 |
| 1.27 |
| U.S. Bancorp |
| 5.49 |
| -19.99 |
| 11.74 |
| 10.82 |
| 4.88 |
| The PNC Financial Services Group, Inc. |
| 5.47 |
| 8.66 |
| 9.65 |
| 10.38 |
| 4.46 |
| Citigroup Inc. |
| 5.31 |
| -13.67 |
| 7.50 |
| 7.87 |
| 4.49 |
| The Kraft Heinz Co. |
| 4.87 |
| 146.21 |
| 14.67 |
| 11.99 |
| 4.50 |
| Prudential Financial, Inc. |
| 4.76 |
| 115.10 |
| 63.20 |
| 8.31 |
| 5.12 |
| Best Buy Co., Inc. |
| 4.73 |
| -13.35 |
| 12.66 |
| 11.95 |
| 5.01 |
| Duke Energy Corp. |
| 4.62 |
| -68.34 |
| 58.87 |
| 16.55 |
| 4.43 |
| Philip Morris International Inc. |
| 4.53 |
| -8.34 |
| 18.28 |
| 15.39 |
| 5.53 |
| Ford Motor Co. |
| 4.06 |
| -31.05 |
| 6.94 |
| 5.60 |
| 5.67 |
Performance
Since inception in 2013, RDIV has lagged SPDR® S&P 500 ETF Trust (SPY) by 3.1% in annualized return. It also shows a higher risk in drawdown and standard deviation of monthly returns (“volatility” in the table below). It has also underperformed one of its most famous competitors in the dividend investing style: Schwab U.S. Dividend Equity ETF ( SCHD ).
| Total Return |
| Annual.Return |
| Drawdown |
| Sharpe ratio |
| Volatility |
| RDIV |
| 147.69% |
| 9.34% |
| -49.97% |
| 0.45 |
| 20.16% |
| SPY |
| 229.00% |
| 12.44% |
| -33.72% |
| 0.74 |
| 15.16% |
| SCHD |
| 199.53% |
| 11.41% |
| -33.37% |
| 0.69 |
| 14.57% |
Data calculated with Portfolio123.
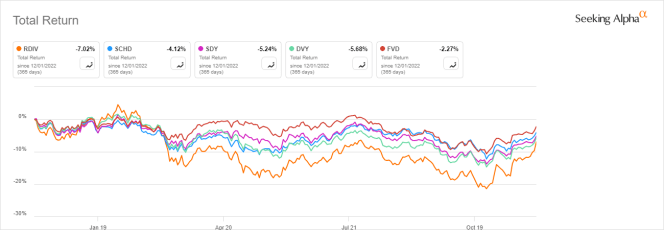
In the last 12 months, RDIV has lagged not only SCHD, but also some of the largest and most traded dividend ETFs: SPDR S&P Dividend ETF ( SDY ), iShares Select Dividend ETF ( DVY ) and First Trust Value Line Dividend Index Fund ( FVD ).
RDIV vs competitors, last 12 months (Seeking Alpha)
RDIV vs. a model based on dividend and quality
In previous articles, I have shown how three factors may help cut the risk in a dividend portfolio: Return on Assets , Piotroski F-score , and Altman Z-score .
The next table compares RDIV since inception with a subset of the S&P 500: stocks with an above-average dividend yield, an above-average ROA, a good Altman Z-score, a good Piotroski F-score and a sustainable payout ratio. It is rebalanced annually to make it comparable to a passive index.
| Total Return |
| Annual Return |
| Drawdown |
| Sharpe ratio |
| Volatility |
| RDIV |
| 147.69% |
| 9.34% |
| -49.97% |
| 0.45 |
| 20.16% |
| Dividend quality subset |
| 228.38% |
| 12.42% |
| -36.22% |
| 0.72 |
| 15.50% |
Past performance is not a guarantee of future returns. Data Source: Portfolio123.
RDIV lags the dividend quality subset. However, ETF performance is real, whereas the subset is simulated. My core portfolio holds 14 stocks selected in this subset (more info at the end of this post).
The annual sum of distribution has increased from $1.02 to $1.50 between 2014 and 2022. It is a 47% growth in 8 years, while the cumulative inflation has been about 26% in the same time, based on CPI. However, distributions have been quite flat since 2017, as plotted on the next chart.
Distribution history (Seeking Alpha)
RDIV Value and Quality
RDIV is much cheaper than the S&P 500 regarding valuation ratios, as reported in the next table.
| RDIV |
| SPY |
| P/E TTM |
| 10.95 |
| 20.79 |
| Price/Book |
| 1.04 |
| 3.69 |
| Price/Sales |
| 0.94 |
| 2.38 |
| Price/Cash Flow |
| 7.89 |
| 14.73 |
Data: Fidelity.
The fund holds 60 stocks, of which 10 are risky stock regarding my metrics. In my ETF reviews, risky stocks are companies with at least 2 red flags among: bad Piotroski score, negative ROA, unsustainable payout ratio, bad or dubious Altman Z-score, excluding financials and real estate where these metrics are less reliable. Here, risky stocks weigh about 22.6% of asset value: this is a bad point, especially since the heaviest sector is not taken into account.
According to my calculation of aggregate metrics reported in the next table, quality is very inferior to the benchmark.
| RDIV |
| SPY |
| Altman Z-score |
| 1.07 |
| 3.59 |
| Piotroski F-score |
| 4.94 |
| 5.71 |
| ROA% TTM |
| 2.08 |
| 7.23 |
Takeaway
Invesco S&P Ultra Dividend Revenue ETF holds 60 dividend stocks of the S&P 900 index, weighted based on revenues. The yield and valuation look attractive, but it shows 6 significant risk factors:
- 40% of assets is in financials.
- 50% of assets is in the top 10 holdings.
- Quality metrics are below-par.
- The fund has underperformed the S&P 500 since inception.
- It is riskier than SPY and SCHD regarding historical drawdowns and volatility.
- It has been lagging several competitors in the last 12 months.
For further details see:
RDIV: Dividend ETF With 6 Risk Factors