RDVY - RDVY: Avoid These Low-Growth Rising Dividend Achievers
2023-10-19 21:19:20 ET
Summary
- RDVY has an excellent track record, delivering a 59.61% return over the last five years that makes it second-best among all dividend ETFs.
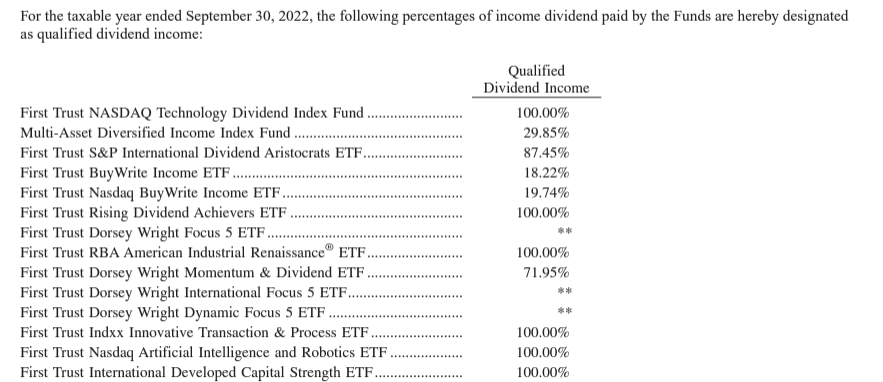
- Despite a high 0.50% expense ratio, RDVY has amassed an impressive $7.80 billion in assets and distributes 100% qualified dividend income.
- However, RDVY's current composition doesn't lend itself well to dividend growth. It overweights unpredictable Regional Bank and Oil & Gas E&P stocks, and features just 1.51% estimated earnings growth.
- A poor profit score is also concerning, suggesting RDVY can potentially underperform in both recessions and bull markets. Simply put, it's too risky today, but I will suggest three safer alternatives for the long run.
Investment Thesis
Over the last five years, the First Trust Rising Dividend Achievers ETF ( RDVY ) has been the second-best-performing dividend fund on the market, gaining 59.61% with reinvested dividends through September. However, RDVY has rotated into more Regional Banks and Oil & Gas E&P stocks in the year since I last covered it, making it more unpredictable than usual and not necessarily a prudent investment. To be sure, RDVY has some attractive qualities, including a 12.99x forward earnings valuation and a higher-than-usual 2.22% expected dividend yield. But its unpredictability and virtually zero expected earnings per share growth rate overshadow these positives and the fund's track record. Therefore, I urge caution with RDVY and will suggest three safer alternatives I hope you'll consider instead.
RDVY Overview
Strategy Discussion
RDVY tracks the NASDAQ US Rising Dividend Achievers Index, selecting 50 companies with trailing twelve-month dividends higher than the previous three and five years. This screen isn't overly strict, and with an eligible universe of the largest 1,000 stocks from the NASDAQ US Benchmark Index, the potential for high portfolio turnover is high. According to the fund's latest annual report, RDVY's historical turnover rates were between 40-65% from 2018-2022. While it's prudent to keep up with Index changes to ensure other goals besides dividend growth are satisfied, RDVY is one ETF where you must trust the process if you plan on holding for the long run. On that note, there are some red flags.
Portfolio turnover would be higher had the Index not used other screens to improve the fund's quality. Namely, qualifying companies must have higher earnings per share than three years prior, current cash-to-total debt ratios above 50%, and a dividend payout ratio less than 65%. Immediately, these screens filter out many capital-intensive stocks in sectors like Utilities and Industrials. RDVY also excludes Real Estate securities. As a result, 100% of dividend income was considered qualified in the last fiscal year.
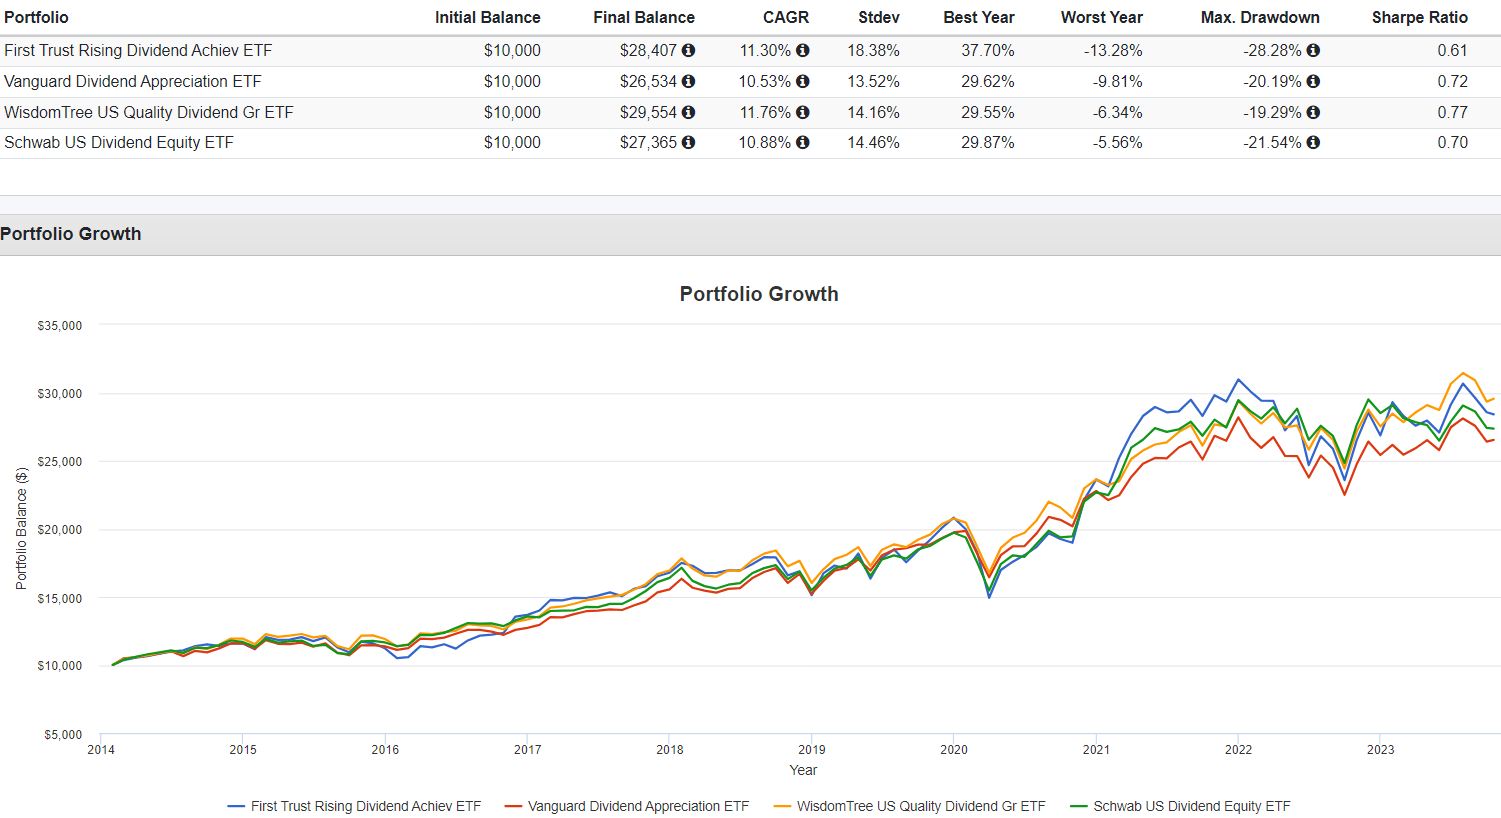
RDVY manages $7.89 billion in assets and has a 0.50% expense ratio, a poor feature for income investors because fees directly reduce distributions. Instead, RDVY's primary objective is capital appreciation, something it's excelled at since its January 2014 launch. Let's look closer at performance alongside other leading dividend growth ETFs like the Vanguard Dividend Appreciation ETF ( VIG ), the WisdomTree U.S. Quality Dividend Growth ETF ( DGRW ), and the Schwab U.S. Dividend Equity ETF ( SCHD ).
Performance
The table below highlights how RDVY has delivered an 11.30% annualized gain compared to 10.53%, 11.76%, and 10.88% for VIG, DGRW, and SCHD. The downside was substantially more volatility, as measured by its 18.38% annualized standard deviation. On risk-adjusted returns (Sharpe Ratio), RDVY was the worst of the four choices.
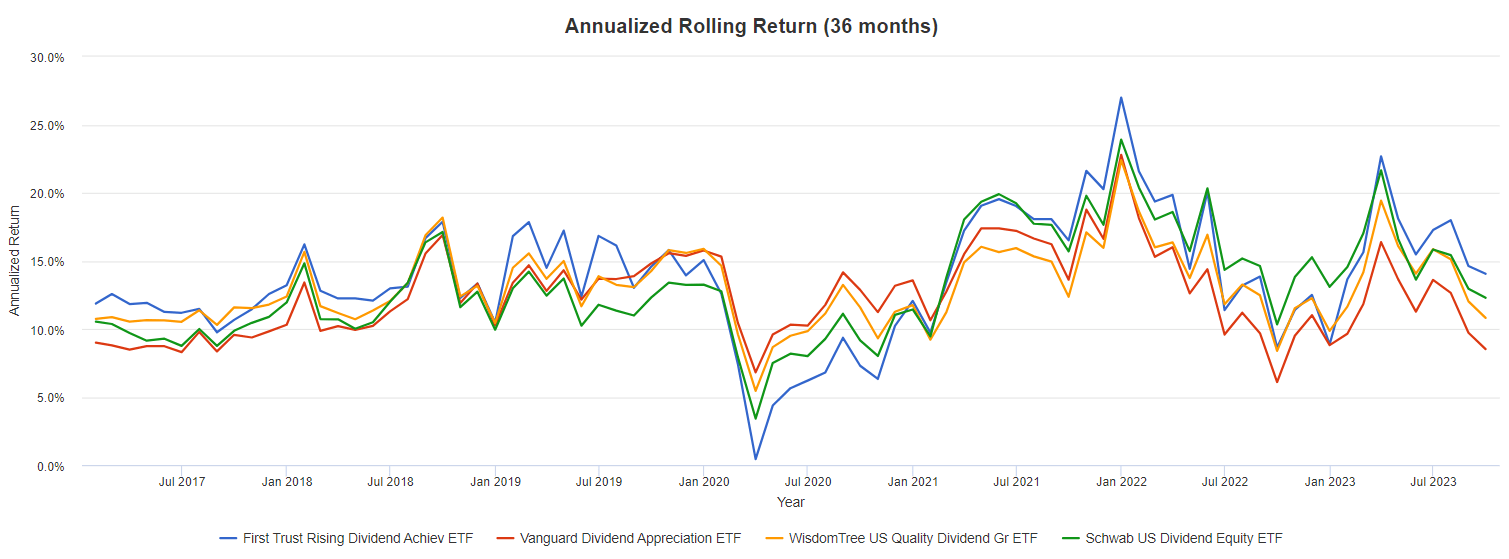
RDVY's strong relative total returns are mainly attributed to 2016 and 2019 when it outperformed VIG, DGRW, and SCHD by 8.35% and 8.89% on average. In contrast, it underperformed by 5.57% and 6.82% in 2018 and 2022, but overall, it tends to rank ahead on rolling three-year returns. RDVY spent some time at the bottom in Q1 2020 but was ahead for the periods ending 2017-2019 and has maintained its lead since mid-2021.
Dividends
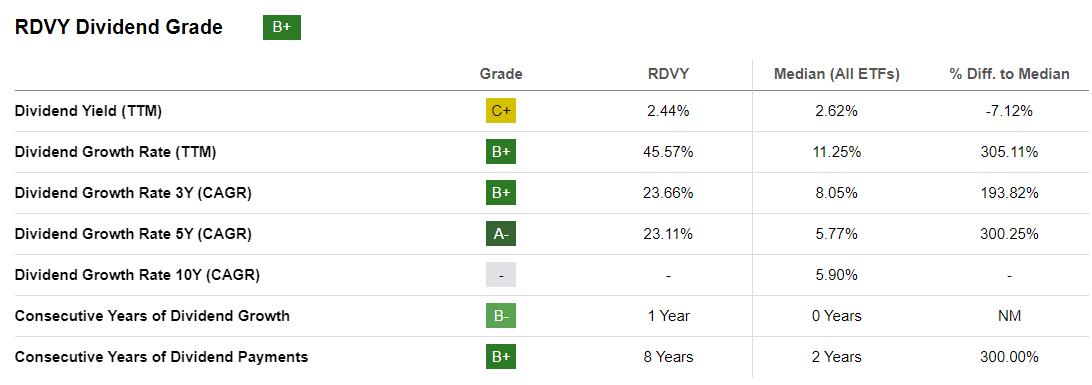
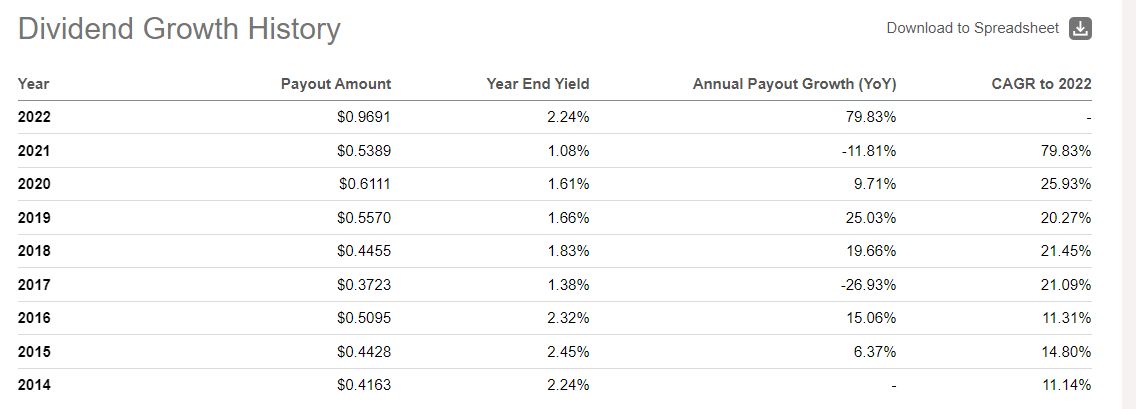
RDVY receives a solid "B+" overall Dividend Grade from Seeking Alpha. Its strengths are a 23% three- and five-year dividend growth rate, while its 2.44% trailing dividend yield is below average. As mentioned in my thesis, I expect this to drop to 2.22% based on my analysis of its current holdings.
Similar to its performance track record, some skewness exists with RDVY's dividend growth rates. The table below shows how 2022's dividend payments spiked 79.83% as the ETF transitioned from about 35% exposure to Technology stocks in May 2021 to 25% one year later . Technology exposure is about 16% today, so despite RDVY's impressive historical dividend growth rates, I anticipate less dividend growth moving forward.
RDVY Analysis
Sector Exposures and Top Ten Holdings
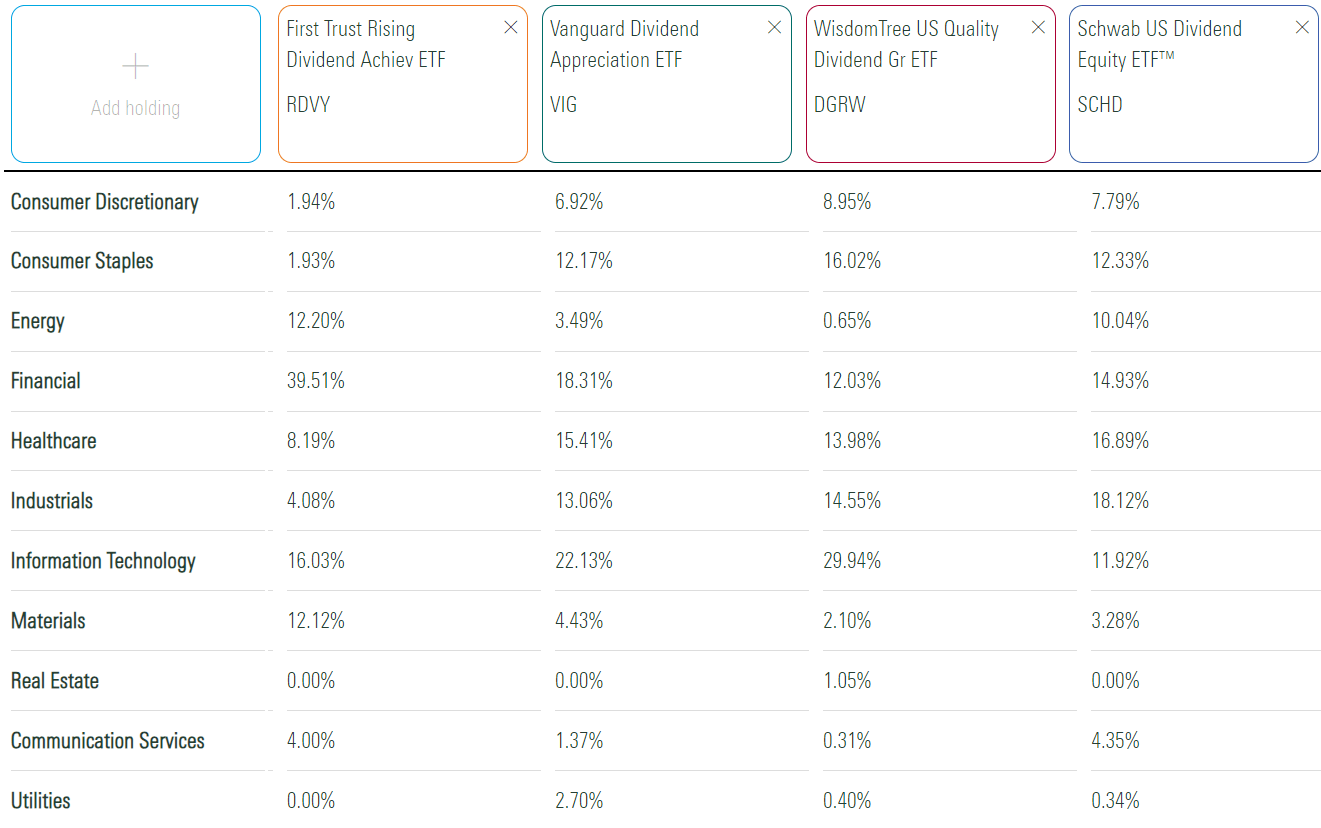
RDVY is 16.03% Technology, but the sector it overweights most is Financials at 39.51%. It's a wholly different and much more concentrated makeup than VIG, DGRW, and SCHD.
Concentrated plays in just a few sectors are why RDVY has performed well over the last decade. However, these three peers also demonstrate that there are more straightforward and less stressful ways to accomplish the same goals. For example, DGRW is more concentrated than VIG and SCHD, but even its largest exposure area in Technology is just 30%.
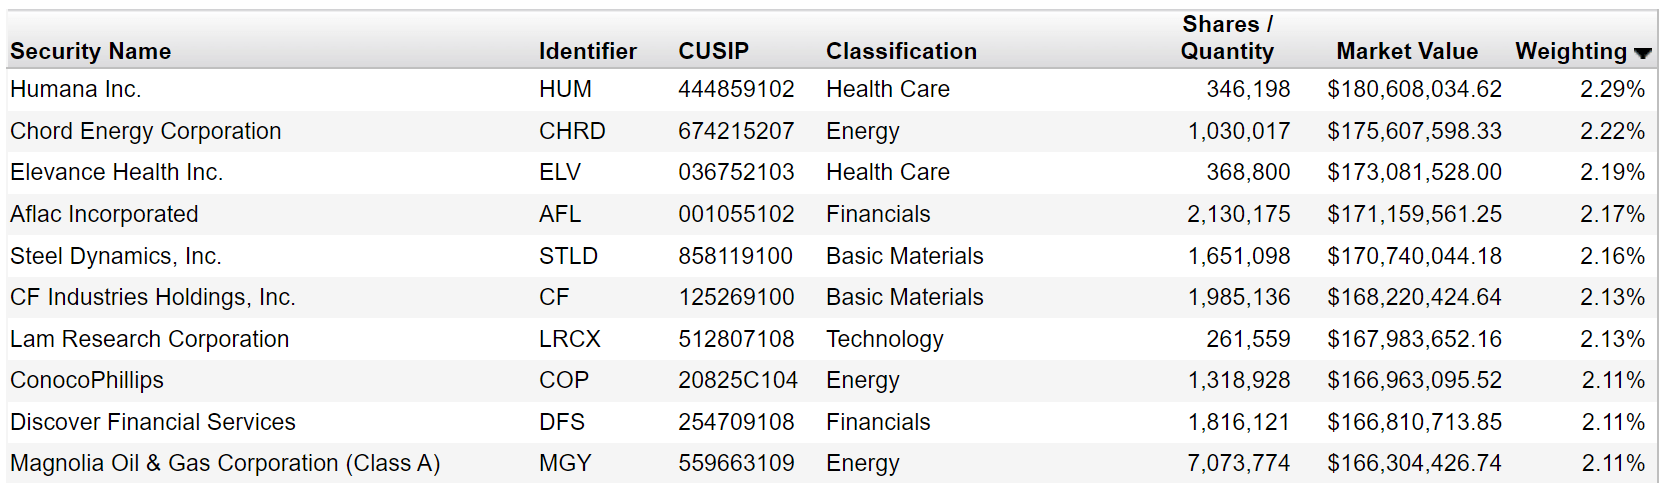
RDVY's top ten holdings are below, totaling 21.62%. As you might have guessed, it's an equal-weight fund, with weightings currently between 1.75% for Morgan Stanley ( MS ) and 2.29% for Humana ( HUM ).
Fundamentals
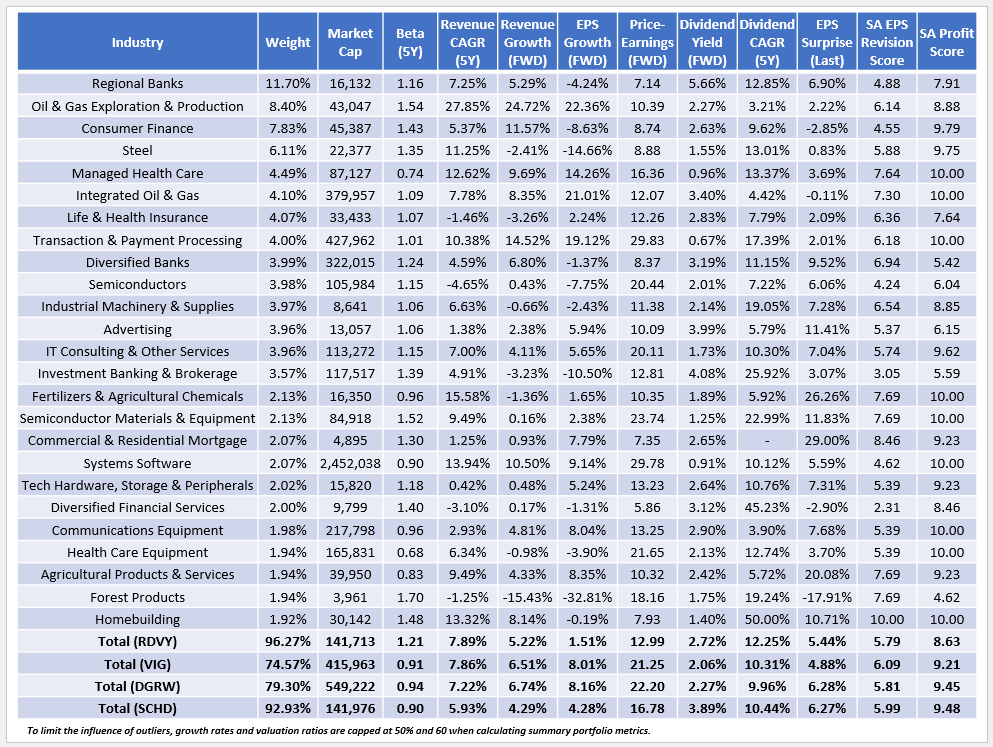
I have some issues with RDVY's fundamentals, which I've summarized below for its top 25 industries, totaling 96.27% of the portfolio. I've already discussed its historic volatility, which the current 1.21 five-year beta supports. However, a troubling feature is RDVY's 1.51% estimated earnings per share growth rate. This weak growth sharply contrasts with the 20.02% figure from October 2022 , which was 8.25% better than what SCHD featured.
Today, SCHD holds the estimated earnings per share growth advantage (4.28% vs. 1.51%), and weak growth is something I've consistently criticized SCHD for and why I believe it's underperforming YTD. Here are some additional observations:
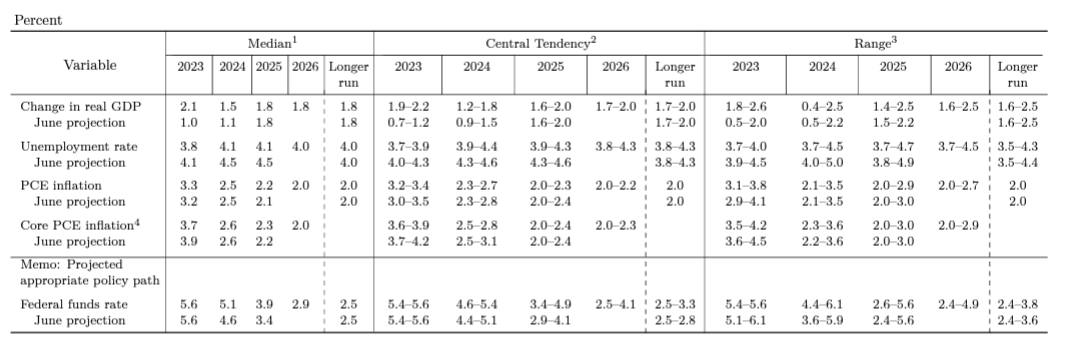
1. RDVY's constituents currently yield 2.72%, and the 2.22% estimated yield I mentioned earlier is the result of subtracting the ETF's 0.50% expense ratio. Using this same method, I estimated VIG, DGRW, and SCHD will yield 2.00%, 1.99%, and 3.83% at current prices. RDVY's constituents also have the best five-year dividend growth rate (12.25%), but most is tied to sub-industries in the Financials sector, including Regional Banks (12.85%) and Investment Banking & Brokerage (25.92%). While higher interest rates are generally better for bank margins, Federal Reserve Board members and Federal Reserve Bank presidents expect the federal funds rate to decline from 5.6% in 2023 to 5.1%, 3.9%, and 2.9% from 2024-2026. That's likely reflected in these two sub-industries' negative earnings growth rates.
2. RDVY trades at 12.99x forward earnings, a substantial discount over VIG and DGRW, and about four points cheaper than SCHD. Undoubtedly, it's RDVY's most attractive feature, and even after comparing RDVY's holdings against those in the same sector, the result is still solid. Seeking Alpha's Factor Grades operate this way, with weighted-average value scores as follows:
- RDVY: 4.89/10
- VIG: 2.73/10
- DGRW: 2.98/10
- SCHD: 4.13/10
3. Due to its high exposure to Regional Banks, RDVY's overall profit score suffers at 8.63/10. For large-cap ETFs, this is below the minimum I seek (9.10/10 - 9.20/10), and suggests the ETF won't be very resilient in a recession. RDVY's 8.40% allocation to Oil & Gas E&P stocks is also concerning, as oil prices typically fall in recessions.
Investment Recommendation
RDVY features a weak 1.51% estimated earnings per share growth rate and a low 8.63/10 profit score, two statistics that suggest it won't necessarily perform well in either a bull market or a recession. Its 2.22% estimated dividend growth rate isn't attractive to income investors, and unfortunately, declining interest rates and poor earnings growth indicate RDVY won't offer significant dividend growth either moving forward. VIG, DGRW, and SCHD provide easier paths to achieving these investment objectives, and I recommend either three over RDVY in this uncertain market. Thank you for reading, and I look forward to the discussion in the comments section below.
For further details see:
RDVY: Avoid These Low-Growth Rising Dividend Achievers