O - Realty Income And Agree Realty: Less Dumb Than The Stereotypes
2023-10-19 06:30:00 ET
Summary
- Realty Income and Agree Realty are REITs known for their external growth strategies that involve issuing new stock and new debt to fund acquisitions.
- Present stock prices leave them unable to follow this model without diluting shareholder value.
- Even so, in some ways, these REITs are better than the stereotype, leaving me more positive but still not a huge fan.
Realty Income ( O ) and Agree Realty ( ADC ) might be the two REITs most associated with external growth driven by issuing new stock. The stereotypical model is: issue new stock, pair it with leverage-neutral debt, acquire more properties, and pay out all cash earnings as dividends.
Not liking that business model, I rarely write on these two. But it is a slow time of year for meaningful new information. Besides, having perhaps been hardened to abuse after my recent articles on Safehold ( SAFE ), why not set myself up for more by writing a critical analysis of two of the most beloved REITs?
These two REITs have long emphasized buying properties leased by investment-grade tenants. Examples include Best Buy, Costco, Walmart, Dollar General, and AutoZone.
Both these REITs have advocated that this is a superior approach. In the Q2 earnings call, Joey Agree emphasized that
… close to three quarters of the annualized base rent acquired in the first six months of the year comes from leading investment grade retailers.
My view of this approach is dim. Buying highly sought and therefore overpriced properties where one can only get lease terms that are not the most favorable to the landlord (including tiny escalators) does not seem the best choice to me.
During this year of low stock prices, some SA friends were wondering whether these REITs were severely damaging shareholder value with their dilutive share issuance. Analyst Hoya Capital, in his recent article on Net Lease REITs, similarly seems to question the rampant pursuit of new acquisitions in the present markets.
My skepticism also has longer roots. The net lease sector is small and has to compete for investors against much larger and better-known sectors.
Those REITs would benefit from promoting the entire sector, but that is not what the CEOs do. Instead, they stand in a circle and shoot inward.
In particular, the arguments made by Joey Agree against other approaches to net lease strike me as utterly illogical. I was prepared to see Agree Realty behaving in ways that damaged their shareholders.
And Realty Income has long shown a description of their underwriting of investments suggesting to me that they do not understand that it is the interplay of Return on Equity and stock price that determines the growth that issuing stock can produce. I was prepared to see them doing foolish things that damaged their shareholders.
Well, it was a pleasant surprise to find that Agree Realty is not that foolish and that Realty Income may not be. But at the end of the day, I’m still not a fan of either one. Let’s take a look at how and why.
[A note before proceeding: My view is that the dividends of both these REITs are indeed very secure. The dividend growth rates will depend on the path of interest rates and the level of unwise activity. But dividend reductions are very unlikely and even those would be small.
The question is more one of sustainable growth than of dividend payment. Today many analysts and commenters seem to think that dividend growth does not matter. But nobody who lived through the 1970s would think that and nobody who lives through the next few decades will either.]
Twin Business Models
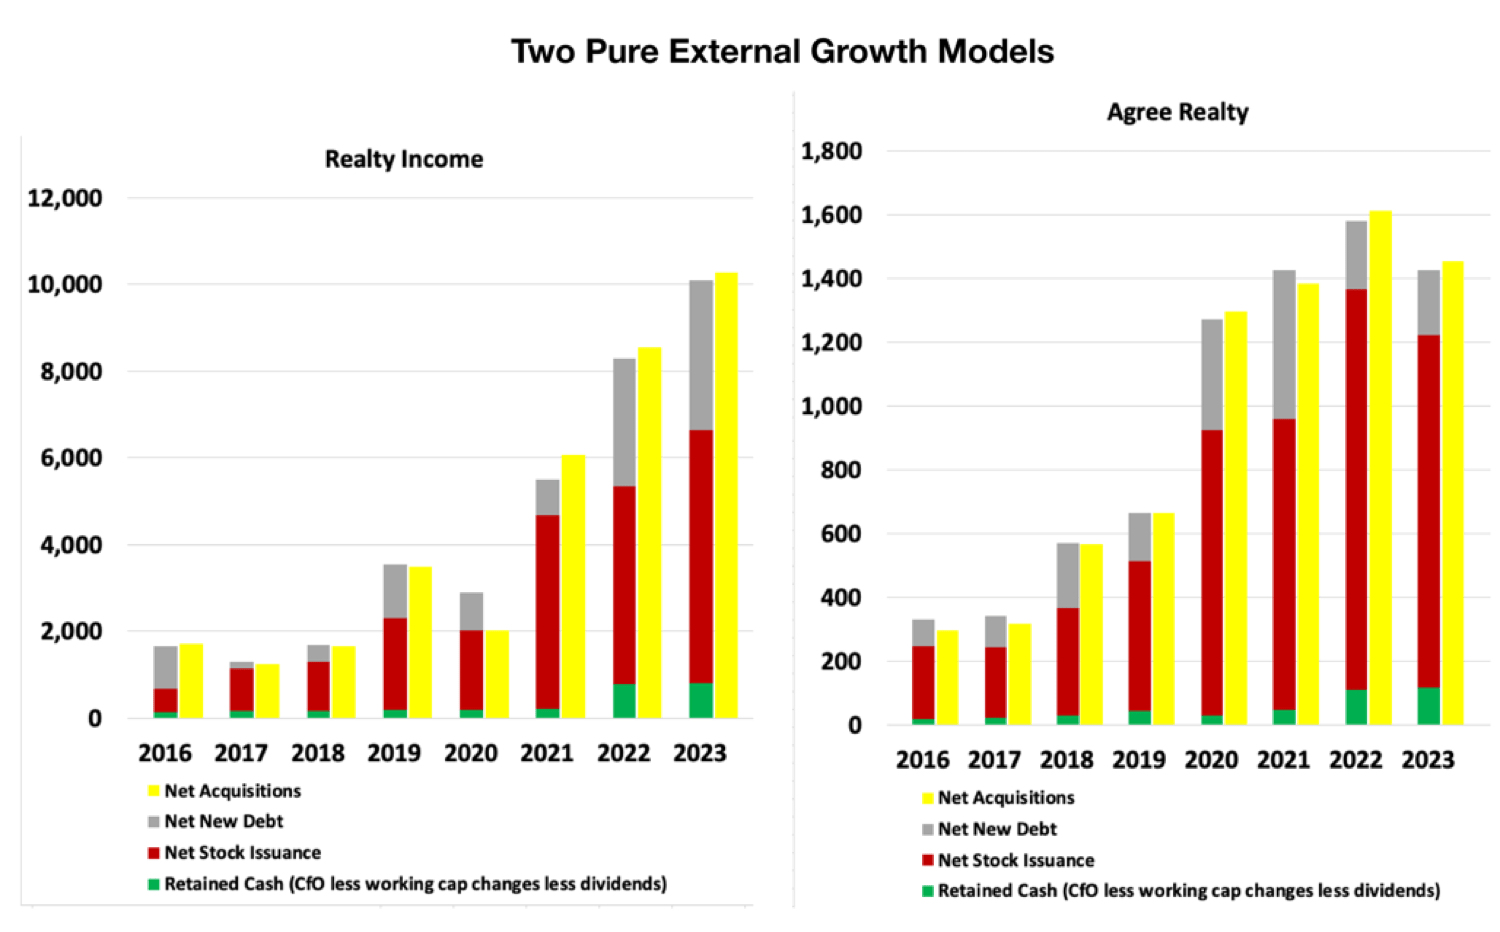
The business models of REITs show through clearly in their cash flows. here are the primary cash flows that have enabled these two REITs to grow.
First note overall how similar these graphics are. Without labels or a side-by-side comparison, one would have no idea which is which.
The graphics show, for each year, two sets of bars. The left set shows sources of funds and the right set shows uses of funds.
The green bars show retained cash (cash from operations less changes in working capital less all dividends). Such cash makes up a much larger fraction for some other REITs, notably including NNN REIT, discussed here .
But that retained cash matters disproportionately, even for these two. The reason is that using it produces pure gains.
In contrast, when you sell part of the company you generate losses in cash earnings per share, and these greatly reduce the gains you get by investing in those funds. We will look at the quantitative details below.
The yellow bars show that the only significant use of cash by these REITs has been to make acquisitions. Each of them does do some build-to-suit development, but the fraction is small so I did not try to tease it out of the total.
They also both do some dispositions, but again not a lot as a fraction. What the yellow bars show is net acquisitions including development.
The acquisitions are funded primarily by new stock issuance, shown in red, and new debt, shown in gray. Here you might note that the gray bars are a bit larger for Realty Income. They target ~40% Loan to Value, while Agree targets ~30%. (Actual averages of new debt to new gross property over the past 7 years are 42% and 34%, respectively.)
Overall, what you see here is two REITs that have long been running nearly pure external-growth business models. Sell stock, add debt, buy properties. Rinse and repeat.
Such models work great so long as shareholders make more money from the investment of the proceeds than they lose from dilution created by issuing new stock. But the market must cooperate, which we will discuss further below.
From a big-picture perspective, it may or may not be the best choice to reinvest the internally generated capital or to issue stock. If returns are low enough, it may make more sense to return that capital to shareholders. However, we will not focus on this aspect here.
Business Model Evolution or Not?
For each of these REITs, there are some recent deviations from their stereotypical growth models.
The payout ratio of Adjusted Funds From Operations, or AFFO, for 2022 was 76% for Realty Income, down from well above 80% a few years ago. Agree Realty has more consistently been near 75%.
Both these REITs now get a modest boost to growth by investing the retained earnings. Both of them could do more of that by further working down their payout ratio.
The bigger change noted by Realty Income is that their fraction of tenants with investment-grade credit ratings has been dropping. Here is some of what they said on the Q2 earnings call:
So just to continue to reiterate the point, we are not targeting investment-grade. What we are targeting are opportunities that yield the best risk-adjusted return.
Today, truth be told, we are looking at some of these investment-grade opportunities and cannot pencil the risk-adjusted returns. We are finding far more value in areas where we’re looking at subinvestment-grade tenants who are willing to give us a return profile that is commensurate with the inherent risk in that particular opportunity.
Wow. Based on what I thought I knew about this REIT, that represents a change in focus. But maybe they had careful language ignored by their many fans.
That said, the quote sounds to me a lot more like things I’ve heard for years from NNN REIT ( NNN ) than from Realty Income. Since the approach of NNN has long appealed to me; perhaps I should start liking Realty Income better.
Realty Income has taken flak for the decision described above. The usual statement is along the lines that they have decreased the quality of their new properties. In contrast, if they are smart enough to demand better lease terms from their new clients they might come out ahead.
The big-picture question is this. Is there any evidence that there actually is some cliff in risk associated with the boundary between investment-grade and qualified subinvestment-grade properties? I don’t see any.
However, it did not make me happy to hear from Realty Income that
We are once again active issuers of equity capital via the ATM, raising approximately $2.2 billion in the aggregate in the second quarter, $651 million of unsettled forward equity remains outstanding as of today.
Using an ATM does not automatically make issuing new equity the right thing to do (see below). What’s more, nothing in that earnings call addressed whether Realty Income has any focus on increasing shareholder returns as opposed to just building its empire.
So Realty Income is willing to change the credit ratings of properties they buy in order to find acceptable deals. And we will find out shortly whether Realty Income went on issuing stock at ever lower prices in Q3.
In contrast, I found a lot to like from Joey, which I confess was a surprise. Most of all:
There's absolutely no challenge running leverage higher and you won't see us issuing equity at 64.50 or wherever we closed yesterday, that's for sure. [The recent price has been in the mid-50’s.]
We don't need equity to hit the one, three [$1.3B] and stay within our current stated leverage range. And so what we'll continue to evaluate all of those markets and then importantly, the relative cost of capital in each and every single one of them.
The good news is …[that] … we don't need any capital. That was the plan coming into this year, we have strong lenders support from obviously the term loan or the 5.5 year term loan, and we can continue to remain opportunistic.
It is nice to see Agree Realty intends to avoid issuing equity when they see the stock price as too low.
Let’s look next at the implications of issuing equity with a low stock price.
Modeling Growth
In reality, there is a lot of time sequencing in the growth of cash earnings by these REITs. At the start of the year, many of the acquisitions from the previous year have so far produced only a small fraction of a year’s revenues. In addition, both cap rates and interest costs vary across time.
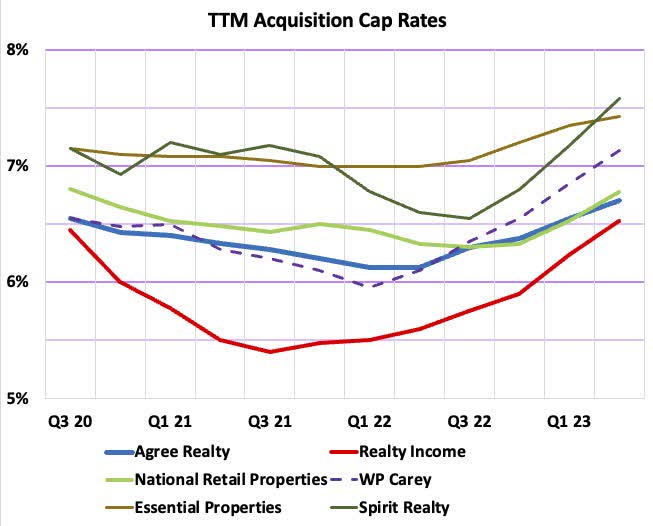
We can see that things have been changing rapidly by plotting cap-rate data gathered in this recent article by Hoya Capital, shown here.
All the REITs shown have been getting increasing cap rates for the past year, with Realty Income showing by far the largest fractional change.
The rapid changes imply that precisely modeling the exact cash flows of any REIT is not really feasible. But we can get a view of where things stand by doing a model at some point in time. Here we use the end of Q2 2023.
We will work through the elements one at a time in a very explicit way. This will let interested readers who are not adept at algebra better follow the calculations, check them, and question them.
Raising Capital
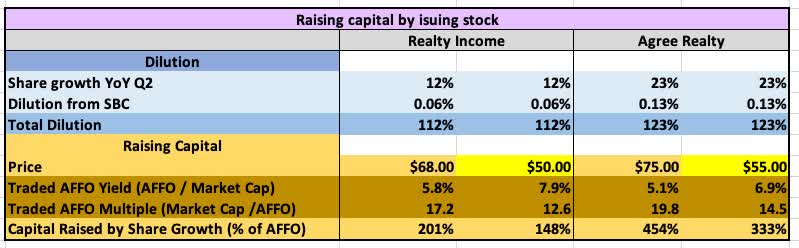
First, let’s look at the capital these two have been raising by issuing shares. You will see tables with 5 columns. There are two each for the value of some parameter for each REIT. The left ones correspond to stock prices last spring. The right ones correspond to recent stock prices.
Here for each of these REITs, we look at capital raising for the two stock prices. The recent price is highlighted in yellow.
The rows shaded blue relate to the issuance of stock and the associated dilution of existing shareholders. There is a net share growth (YoY as of Q2).
There is also some share growth resulting from stock-based compensation. (I used the impact of the current issuance. Properly one would do a weighted calculation based on the specifics of vesting.)
Overall Realty Income has diluted shareholders by 12% over the past year. Agree Realty has done 23%. Note that such dilution is not inherently bad; it depends on how per share earnings are affected (see below).
The first rows show the price last spring (shaded tan) and recently (shaded yellow). The next two rows, shaded brown, show the resulting AFFO yield and AFFO multiple produced by issuing stock.
The bottom row shows the fraction of current AFFO that is generated by the share issuance. As you can see, this is a large number for both these REITs.
Return on New Equity
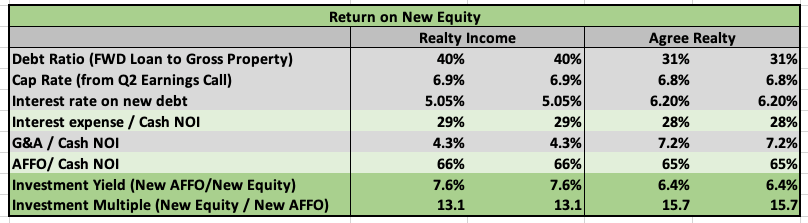
The next table shows the rate of return generated by investing newly raised equity, from any source.
Here the rows shaded light gray show data. The rows shaded light green show intermediate results, and those shaded dark green show the bottom line.
The ratio of interest expense to cash NOI is the interest rate times the Debt Ratio divided by the cap rate. Today it runs just below 30% for these two REITs.
Note that this is the only place where the interest rate enters. The return on new equity is only indirectly related to the spread between interest rates and cap rates on which so much discussion is wasted.
Subtracting the ratios of interest costs and G&A costs to cash NOI gives the ratio of AFFO to NOI for new properties. This runs just below two-thirds, typical for net-lease REITs today.
The ratio of cap rate to new equity fraction (1 - Debt Ratio) gives the ratio of NOI to new equity. Multiplying this by AFFO/Cash NOI gives the Investment Yield, the inverse of which is the Investment Multiple. These are shown in the bottom two rows.
Since the two columns for each REIT use only one cap rate, they show the same yields. In actuality, the yields earlier in the year were lower as cap rates were lower.
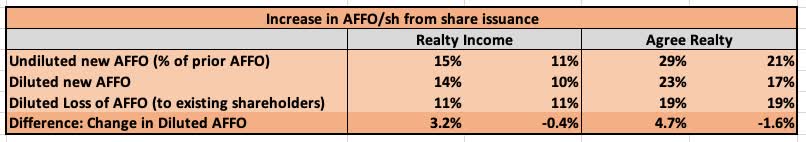
Gains and Losses of AFFO/sh After Share Issuance
The new AFFO per share is the newly raised capital times the Investment Yield. But AFFO per share is also lost from selling off a fraction of the company. The amount is the fractional loss of AFFO produced by the dilution.
This next table shows the implications of share issuance last spring vs. now. Here again, the left column for each REIT is last spring and the right one is current.
Last spring both these REITs could generate accretive per share cash earnings by selling stock and investing the proceeds. Beyond that, they both do extensive forward equity issuance, locking in the price at sale for future use. This has let them continue to make accretive equity investments even as their stock price has tanked.
But any acquisitions funded by the sale of stock at present prices are dilutive to shareholder value, as you can see in the right columns for each REIT. So it is great to know that Agree Realty is not issuing new stock, as discussed above.
But what Realty Income is doing with their ATM remains to be seen. What they say in presentations about their underwriting gives me no confidence.
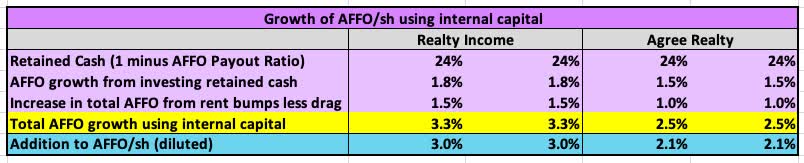
AFFO/sh Growth Using Internal Capital
What we will focus on here is the investment of capital raised by rent bumps and from retained cash. Here is how I put that together.
That retained cash (24% in both cases) is powerful. Investing it at the rate found in the green-shaded table gives AFFO/sh growth of 1.8% for Realty Income and 1.5% for Agree Realty.
The average rent bumps are as seen in the corresponding row. The related change in AFFO/sh is increased by leverage but decreased by losses of rent across the portfolio. I took the combined impact to be a wash.
The result, seen in the row shaded yellow, is that these REITs will get AFFO/sh growth in the 3% ballpark from retained earnings and rent bumps. That is actually not terrible for a REIT and could be pushed up if they retained more earnings.
The bottom row (shaded light blue) shows the reduced AFFO/sh growth from these sources after the impact of dilution. This is really important.
Any growth from investing capital raised by issuing shares comes at the costs of dilution of the growth from internal capital. Just having an investment yield above the AFFO yield is not sufficient to guarantee per-share AFFO growth on the net.
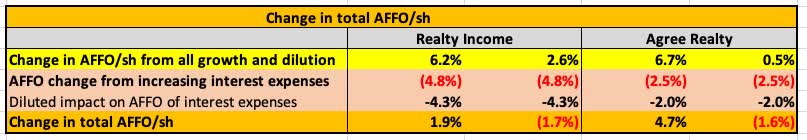
Total Growth With Impact of Interest Rates
In addition to the above sources of AFFO/sh growth, there is at present a significant negative impact of increasing interest rates. This next table adds that aspect, with the first row shaded yellow adding up the growth discussed above.
Realty Income carries more floating rate debt than Agree Realty, making the impact of increasing interest rates larger for them. Agree Realty distinguishes itself by having one of the best balance sheets amongst all REITs.
Adding the diluted effect of those increased interest expenses, one ends up with the bottom row. Based on equity issued at prices from last spring, these REITs both would have grown AFFO/sh this year.
In contrast, if the entire year were based on the current stock prices, these REITs would both have diluted their shareholders. As it stands, the guided growth of AFFO/sh is 0.8% for Realty Income and 1% for Agree Realty. This is not a surprise, reflecting the worsening of possible growth across the year.
Contrasting Descriptions
There is an interesting difference between what was conveyed in the Q2 earnings calls for these two REITs. On the one hand, we noted above that Realty Income was not finding appealing investment-grade opportunities. Quoting:
Today, truth be told, we are looking at some of these investment-grade opportunities and cannot pencil the risk-adjusted returns.
In sharp contrast, here is what Joey Agree had to say:
We've never seen the diverse set of opportunities that we've seen, the lack of competition in the market is frankly stunning. It's us and sellers expectations. And so the private 1031 buyer has vanished … The non-traded REITs …aren’t playing in this space anymore. And then the levered private purchasers can't get the leverage. So we really have our choice here. And it's an interesting paradigm to be in. And as I mentioned in the prepared remarks, I've never seen an opportunity so ripe and fruitful with that wide ranging spectrum of opportunities.
So are the opportunities too sparse in investment-grade properties or are there many such firms desperate for the capital a REIT can provide? It will be interesting to see what is said in the next calls, soon.
My Reactions to All This
On the one hand, there was more to like in these stories than the stereotypes had prepared me for. On the other hand, this is still not my favorite business model for REITs.
Key to their growth has been the ability to issue equity at prices that enabled accretive acquisitions. But as was discussed and illustrated, the stock market can shut this down. The high stock prices of the past decade are far from guaranteed, especially as we transition from a 40-year period of declining interest rates to a much less certain future.
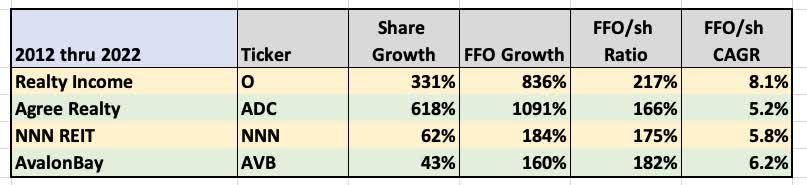
We can use this comparison over the past decade to highlight some things that concern me:
Realty Income and Agree Realty have grown their share count (and gross property) by roughly 10x across the decade. This has enabled a rough doubling of FFO/sh. [ADC would likely have more growth save for some difficulties early in the decade.]
But this was a good decade and some decades are not. Realty Income has only grown FFO/sh at only a 5.5% CAGR since 2002 vs 8.1% over the past decade. So the previous decade was not so hot for them.
What’s more, that growth for Realty Income has pushed Gross Assets up to about $50B. To continue its past growth rate, Realty Income must acquire well north of $10B in assets per year now and this would project to increase to $100B per year a decade from now.
This leads to two questions for the Realty Income cult:
- Why should we expect future decades to be like the past one, as opposed to the first of this century?
- Do you expect that Realty Income will be able to maintain its returns on equity even as it transitions to buying far more or far bigger properties? If so, why?
To my eyes, Realty Income looks like an aging dinosaur whose best years are behind them. This is whether or not they are adding shareholder value at the moment.
Agree Realty, being smaller, has more runway for this model. But keeping it going does depend on cooperation from the stock market, as discussed above.
Joey Agree expressed strong confidence, in a recent interview, that the markets would come back so that the prior model would go back to working. My view differs.
The real estate and capital markets will evolve to continue to support the expansion of real estate, without question. But this does not guarantee that the stock market will go back to supporting the growth of AFFO/sh driven by issuing new equity. Time will tell.
In contrast, compare the bottom two rows in the table. NNN REIT places far more emphasis on internal growth. Over the decade, they did not even double their share count. Yet they grew FFO/sh at a very respectable rate.
The NNN model is more efficient, requiring less growth of shares and properties to produce the same growth in earnings. This makes more sense to me and I am long NNN.
AvalonBay ( AVB ), representative here of several good multifamily REITs, also did not double their share count. (See my article .) And they grew FFO/sh at a very high rate.
I would own some of those multifamily REITs If their yields met my goals (for my present income focus). Unfortunately, neither the yields nor the minimum likely upside have become appealing enough.
Bottom Line: This exploration has given me a much more positive view of Agree Realty. My view of Realty Income also now is more positive but colored by some concerns detailed above. However, these two are still at the bottom of my list amongst the quality net lease REITs.
For further details see:
Realty Income And Agree Realty: Less Dumb Than The Stereotypes