SRC - Realty Income: High Growth High Collections At A Reasonable Price
2024-01-18 11:13:50 ET
Summary
- Realty Income Corporation has performed worse than expected in recent years, but its stock price has started to rally.
- The REIT has experienced increases in revenue and free cash flow, with healthy margins and a strong balance sheet.
- The stock's underperformance can be attributed to the beating it took during the COVID-19 pandemic, which it hasn't fully recovered from.
- Realty Income's revenue, funds from operations, adjusted FFO, and free cash flow are all up from the pre-pandemic period.
- For the reasons above, I consider this REIT a buy today.
Realty Income Corporation (O) has given investors a rough ride in recent years. Having declined 5.8% in price over the last five years, this real estate investment trust, or REIT, has performed worse than its fundamentals would lead you to predict. The total return over five years has been positive, thanks to the high dividend yield, but hasn't been commensurate with the company's performance
This year, it looks like Realty Income is beginning to buck its long-term trend. Since hitting a low of $46.22 in November 2023, it has risen 24% to $57.21. It has been an impressive rally off the lows, and there is a good chance that it could continue.
Despite O's ugly long-term chart, the REIT itself is performing quite well. According to Seeking Alpha Quant , Realty Income has experienced appreciable increases in revenue in the trailing 12 months , as well as the trailing three year, five years, and ten-year periods. The growth in earnings hasn't been as strong, although the growth in free cash flow has been above 16% in all time frames. Margins are healthy: the company scores an A+ on profitability in Seeking Alpha's rating system. Finally, Realty Income has a healthy balance sheet , with a debt to equity ratio of 0.65 and enough cash to cover a full year of property expenses .
All of this raises an important question:
Why is Realty Income stock down so much over five years? It looks like the REIT itself is performing well, so why the lackluster stock performance?
One reason is that the REIT took a beating in 2020 due to the COVID-19 pandemic. It fell 47% top to bottom in that period. During the pandemic, many States had pandemic control policies that included closing down non-essential businesses. Mall REITs in particular got hit hard , as many of their tenants (movie theaters, fashion stores) were deemed inessential during the pandemic. O, as a commercial REIT, fell in price along with its beleaguered mall REIT cousins. However, the company's own fundamentals were not much affected by the pandemic. In the second quarter - the quarter that featured the strictest lockdowns of the entire COVID pandemic - O's revenue increased 5.2%, its funds from operations, or FFO, per share increased 3.7%, and its adjusted FFO, or AFFO, per share decreased just 2.3%. The REIT had a 98.5% occupancy rate in the period. While these certainly aren't "blowout results," they were not indicative of major damage. In a period when O declined in price by nearly a half, its FFO increased 3.7%.
Nevertheless, the damage to REITs in general had its effect on Realty Income's unit price. Although the O has risen 35.5% off the COVID lows, it is still nowhere near the pre-COVID high of $79.83. This is interesting because all of the REIT's fundamentals have vastly improved compared to the 2019 (i.e., pre-COVID) levels. As you can see in the table below (TTM numbers courtesy of Seeking Alpha Quant , 2019 numbers from the 2019 annual report), most of O's highlight earnings and cash flow numbers are up from the pre-pandemic level.
| TTM |
| 2019 |
| Growth rate |
| Revenue |
| $3.89B |
| $1.42B |
| 173% (22% CAGR) |
| FFO |
| $2.7B |
| $1.04B |
| 159% (21% CAGR) |
| AFFO |
| $2.6B |
| $1.05B |
| 147% (19.8% CAGR) |
| Net income |
| $881M |
| $426M |
| 106% (15% CAGR) |
| Free cash flow |
| $1.7B |
| $722M |
| 135% (18.6% CAGR) |
So, despite O being down from its pre-pandemic stock price, its earnings and cash flow metrics have improved. Although some macro factors that have emerged in the interim period (e.g., high interest rates) have not been kind to Realty Income, they haven't stopped its earnings growth trajectory from being basically a positive one. The REIT has plenty of growth engines, including a newly acquired subsidiary that could take its FFO to new heights. For this reason, I consider O a buy at today's price.
Realty Income - Recent Trends and Future Trajectory
Before valuing Realty Income, I need to develop a thesis about where the company is likely to be in the future. I'll start by looking at the company's recent trends, then move on to factors that will influence its future performance, such as its recently acquired properties, organic growth, and interest rates.
We can start with the company's recent trajectory. Some of this was covered in the introduction (see the table above), here I'll get into a little more detail on specific accounts that make up the earnings metrics covered already. Over the last five years, Realty Income's key metrics that go into operating income increased at the following rates:
-
Revenue: 159% (21% CAGR).
-
Property expenses: 343%.
-
Selling, general and admin expenses: 216%.
-
Depreciation: 212%.
Finally, we have net interest expenses, which increased 124%.
In general, operating expenses that go into calculating earnings before interest and taxes increased faster than revenue did. Interest expenses increased slower than revenue, which is a somewhat surprising result. The Federal Reserve hiked interest rates at an extremely fast pace in 2022, which led to rising interest expenses at many companies. O's interest expenses increased in 2022 and 2023, but not at an especially fast pace compared to revenue, which was a positive development.
In 2024, that might change. This year, the company has $1.8 billion in debt maturing, which will likely have to be refinanced. Once it is refinanced, it will probably be at higher rates, so that could take a bite out of Realty Income's earnings going forward. As the chart below shows, the company has a lot of maturities coming up in the next few years, and with $344 million in balance sheet cash, it can't simply pay for them using money that it has on hand. So, interest expenses are likely to increase more going forward than they did in 2023, when hardly any debt (just $137 million worth) came up for refinancing.
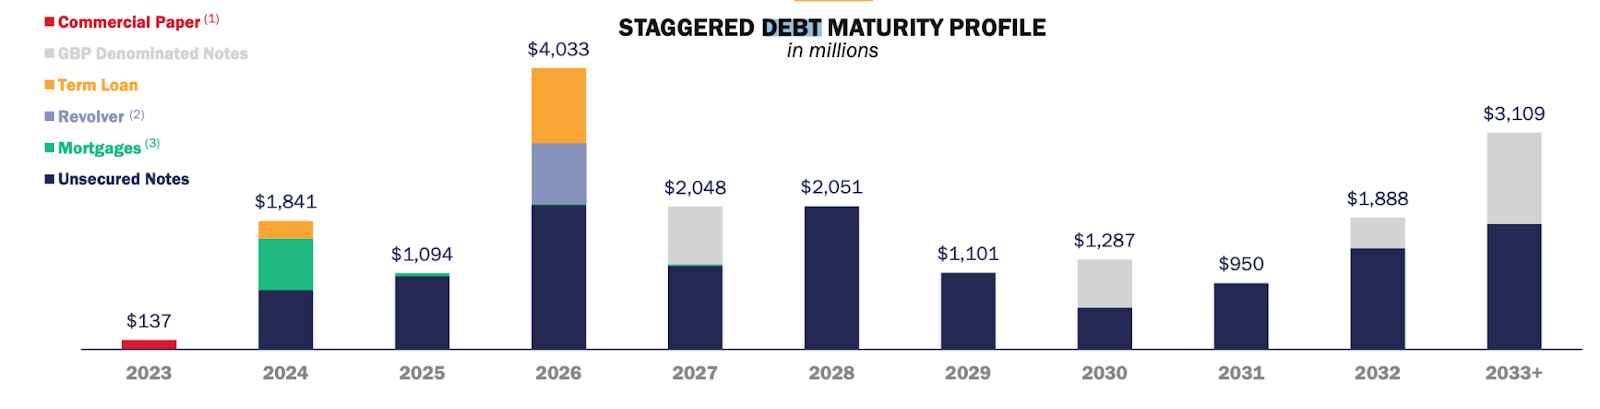
Based on the chart above, I predict that Realty Income's interest expenses will increase over the next five years. In the trailing 12 month period, O had $653 million in interest expense on $20.99 billion in debt, for a 3.12% cost of debt. The company expects its cost of debt to average 5.5% over the next 10 years, and the schedule of refinancings combined with the current high interest rate environment argues that they are right about that. So, I'd expect interest expenses to reach about $1 billion per year by the end of the next five-year period.
O cost of capital (Realty Income)
Next up we have the company's growth drivers. Its top 5 clients are Dollar General, Walgreens, Dollar Tree, 7-11 and EG Group. All of these companies have investment grade credit ratings, and that shows up in Realty Income's own results in the form of a near-100% collection rate . So, I'd expect O's revenue to be at least stable. On top of that, the company just completed the acquisition of Spirit Realty Capital (SRC), a deal that it says will increase AFFO by 2.5% over the next 12 months. Finally, commercial office rent is expected to rise by 1.2% per year in the coming years. That isn't a lot of growth coming from rent hikes alone, but on the other hand, O has a very good balance sheet, which argues that it has room for more deals in the years ahead.
For these reasons, I agree with the analyst consensus of 10% annual revenue growth and 9.9% annual earnings growth in the near term. Unfortunately, O has diluted its equity in the past, including on the Spirit Realty deal. For this reason, I'd expect the growth rate in EPS to be slower than the growth in net income, at about 5% per year.
Valuation
Having done a forward looking analysis of Realty Income as a company, it's now time to value the shares. According to Seeking Alpha Quant, O trades at:
-
44 times earnings.
-
14 times FFO.
-
14.5 times AFFO.
-
14.93 times operating cash flow.
-
1.33 times book value.
-
10 times sales.
These figures are mixed. 10 times sales and 44 times earnings are both quite high for a REIT, but the FFO multiples are rather low. FFO and AFFO predict dividend-paying ability better than GAAP earnings do, so I'd put more weight on those, and say that Realty Income is a moderately valued REIT.
We can also value Realty Income in terms of discounted cash flows. O had $4.23 in free cash flow per share in the TTM period. If it grows at 5% annualized over the next five years (consistent with the rate that I forecast EPS would grow at), then it slows to a 0% sustainable growth rate after that, we end up with a $75 fair value estimate using a 7% discount rate. The 7% discount rate here is 4% (the 10-year treasury yield) plus a 3% risk premium. The relatively low risk premium here is justifiable because I'm assuming a free cash flow ("FCF") growth rate far below the company's historical norms, while the company has known growth drivers in the form of a recent accretive acquisition and moderate projected organic growth in commercial office rents.
The Bottom Line
The bottom line on Realty Income is that it is a beaten-down REIT whose performance is much better than its stock price would tend to indicate. Over the last 5 years, it has grown its FCF per share by 25%, yet its stock price has fallen in the same period. O's declining price has resulted in it having a modest valuation of just 14 times FFO, 14.5 times AFFO and 1.3 times book value.
To be sure, the O REIT is subject to certain risks-chief among them, the risk of unexpectedly high interest rates in the years ahead. If inflation starts rising and the Fed has to resume hiking rates, then O's earnings will suffer. Apart from that, though, Realty Income Corporation stock has a lot of factors in its favor while trading at a reasonable price. On balance, it appears to be worth the investment.
For further details see:
Realty Income: High Growth, High Collections At A Reasonable Price