TMV - Recession Risk Status This Year
Summary
- My indicator shows that we are not yet in a recession.
- There are risks that we will experience one sometime this year.
- All the indicators show a decline in economic strength, and the most reliable ones are indicating a drop toward recession.
How close are we to a recession? Based on my recession indicator , we are not now in one, but we seem to be headed for one - probably this year. The good news is that the market bottom will coincide with it.
I wrote about my indicator almost three years ago and, at that time, I stated that we were not in a recession but possibly close to one. As it turned out, the recession did not hit until February 2020, so the indicator was correct at the time - just premature. This is the normal progression of these types of indicators. We cannot jump ahead of them to estimate the time that remains before the inevitable beginning of a panic sets in. However, at the same time, we can use the information to enhance our state of preparedness and enhance the risk aversion elements of our portfolios.
I developed my indicator about four years ago and intended to show the state of the economy as close to real time as possible. I use data from the Fed found on their FRED website. The indicator is based on those data that most reliably show economic strength and weakness. I am open to revising the constituent elements as I find good ones that fit. The elements of my indicator are discussed below.
We know that several economic statistics decline before and then during a recession. Nobel Laureate F.A. Hayek and the Austrian economists made several statements regarding some of these, but primarily they said that the main victim of recession is employment.
The Austrian school of economics, in my opinion, has the most accurate understanding of the business cycle. Hayek founded a research institute to study the business cycle (The Austrian Institute for Business Cycle Research) back in 1926 and wrote several books on the subject. His book, " Prices and Production ," is considered his original elucidation of the theory he developed with Ludwig vonMises. There are now many books on the theory from which one can learn the details. Mises and Hayek both predicted the Great Depression (1929-44) and why it would happen back in 1924.
Gottfried Hobbler, another Austrian economist, noted in his 1948 thesis for the League of Nations that psychological attitudes also contribute to the onset of recessions. If market participants expect the bust to imminently occur, they will act accordingly and reorganize their affairs to get ahead of the crowd. If enough actors are of like opinion, their adjustments will prematurely provoke the recession. I am in the process of finding the right indicator to add to the composite indicator to account for this effect. I hope to improve the results in the future.
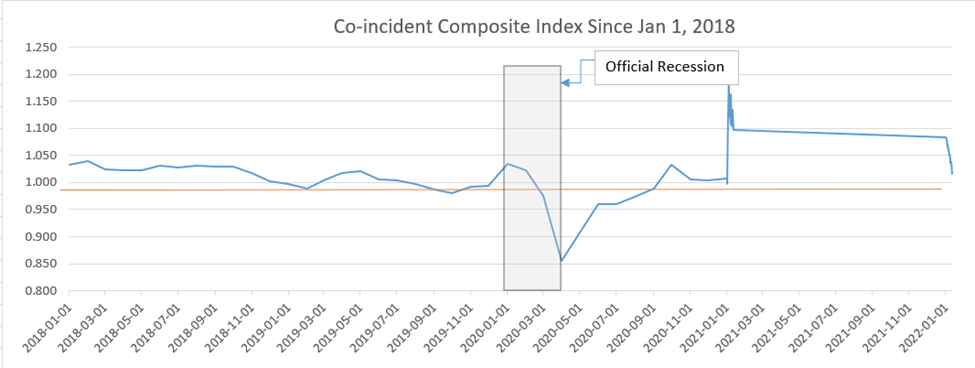
Currently, we find the indicator is telling us that we are likewise in a normal mode. We are not currently in a recession nor should we be in the immediate future. It is currently falling, which is troublesome, but remains solidly in positive territory. As one can see from the graph below, the value is at 1.017 with recession at about 0.97 or so. This value can vary; however, the most important characteristic is a rapid decline of the trendline. The average level during the "good" times is about 1.030. The peak shown was due to the very low levels of the S&P 500 two years ago. The momentum of the market was extreme at that date (April 1, 2021), which shows as a peak. The difference between the official recession date and the indicator is that I think that the official date was slightly premature.
My Recession Indicator Chart since Jan 1, 2018 (FRED database and Yahoo Finance)
As I study my indicator, I find that the line drops during the initial phases of a recession. That is what we are currently experiencing, which gives me concern. Another aspect of the recession in general is that the bottom of the market (during the bear) usually happens during one. The current level of the market, which now seems to be getting old in the tooth, may have already happened. In that case, we may very well be seeing the start of the next economic downturn. On the other hand, if that is the case, we are seeing the best buying opportunity in years.
Other typical indicators, such as the yield curve, are also quite bearish. The two main yield curves watched by economists - the two-year/90-day curve and the 10-year/90-day curve - are currently inverted, which are probably the best single indicators. The Fed is slamming on the brakes hard to slow inflation by making borrowing expensive. Borrowing from banks is the main source of the increase in the money supply, which is inflation. The rise in prices is a result of inflation, not inflation itself, seasonally adjusted.
The sectors that suffer during a recession are consumer purchasing and home sales, along with rising unemployment, increased personal bankruptcies, and young people unable to get jobs. This is the result of tightening by employers lowering costs. This has already started to happen, even though participation among 25- to 54-year-old workers has remained steady over time - and in the last two years has increased. This was mainly due to the sharp decline during the COVID-19 problem.
Below are the components of my indicator (data is provided by the FRED database).
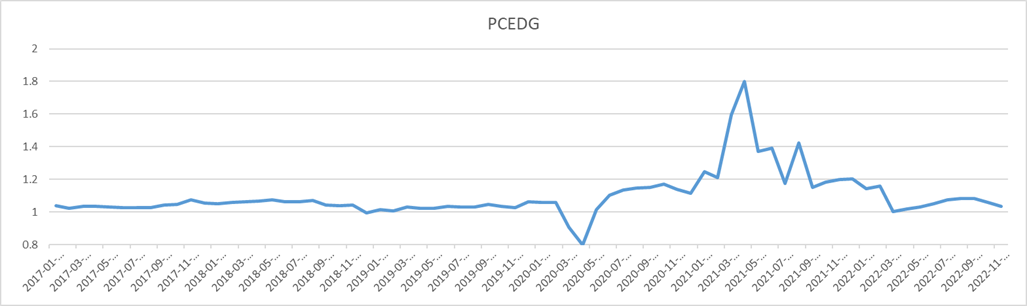
- PCEDG: Personal Consumption Expenditures Durable Goods - billions of dollars, monthly/seasonally adjusted annual rate
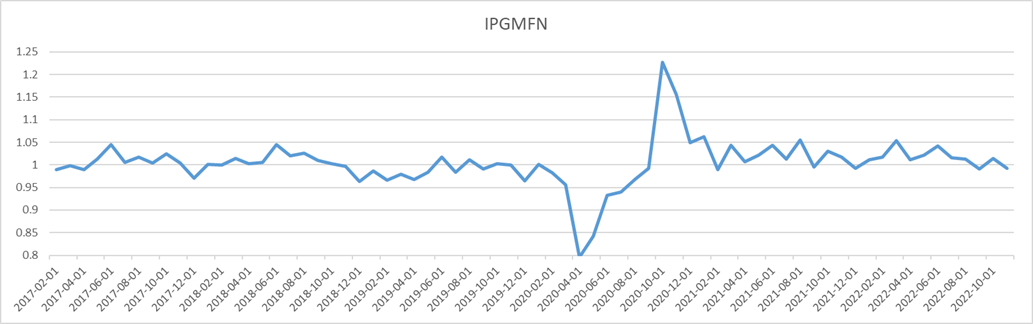
- IPGMFN: Industrial Production Manufacturing (NAICS) - index 2012 = 100, monthly not seasonally adjusted
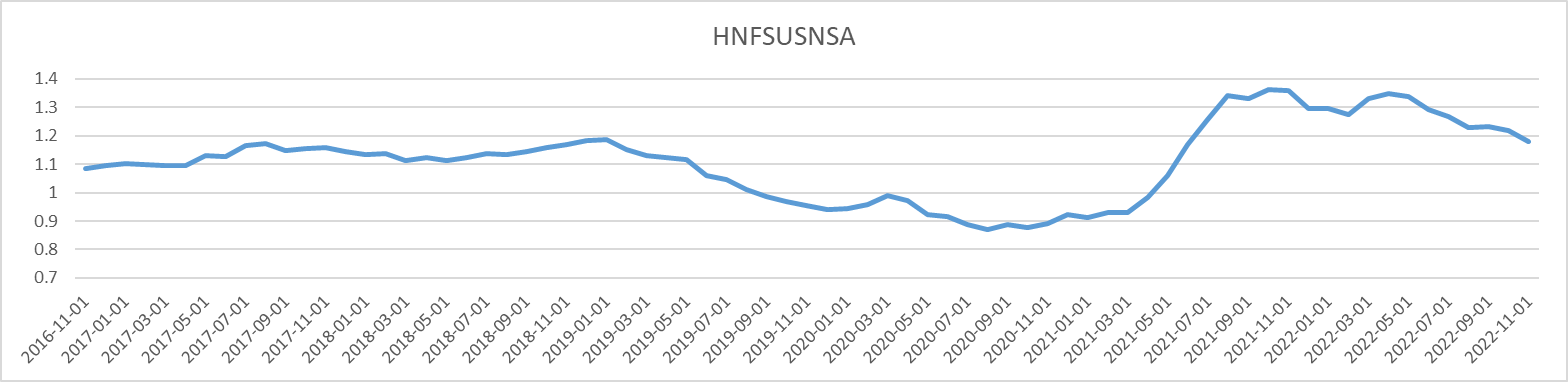
- HNFSUSNSA: New One-Family Houses for Sale in the United States - thousands of units, monthly not seasonally adjusted
- IPGMGFN: Industrial Production Manufacturing (NAICS) - index 2012 = 100, monthly not seasonally adjusted
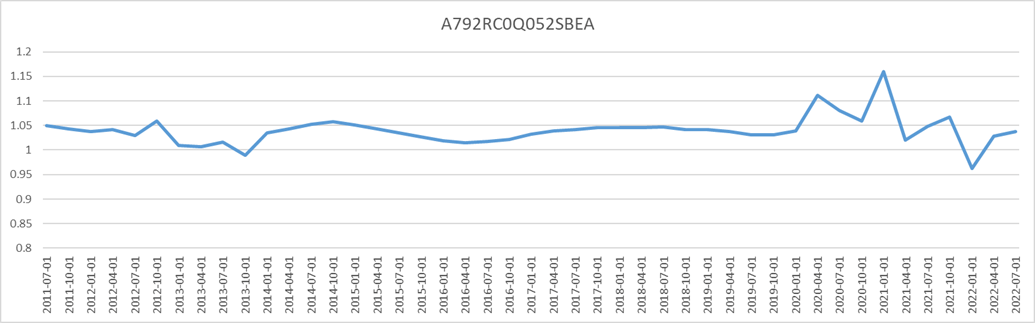
- A792RC0Q052SBEA: New Industrial Production Manufacturing (NAICS) - index 2012 = 100, monthly not seasonally adjusted
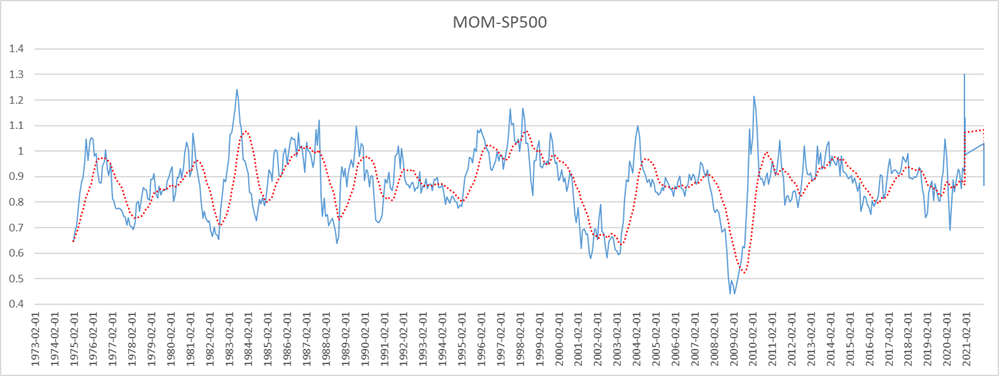
- S&P 500 Momentum - 12-month period multiplied by a fraction
Long Term Charts
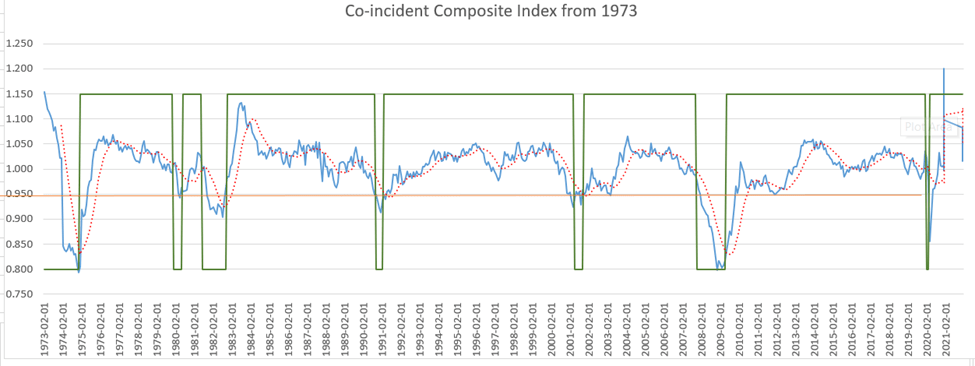
Each of the separate components of this indicator has been declining since April 2021. Even the stock market, which many traders believe is the best indicator of the current economy, has been in decline. The momentum I use is 12 months, but up to 24 months is still useful. All data is monthly data. The chart below is my indicator going back to 1973 to illustrate its accuracy. The black line represents the official recession periods.
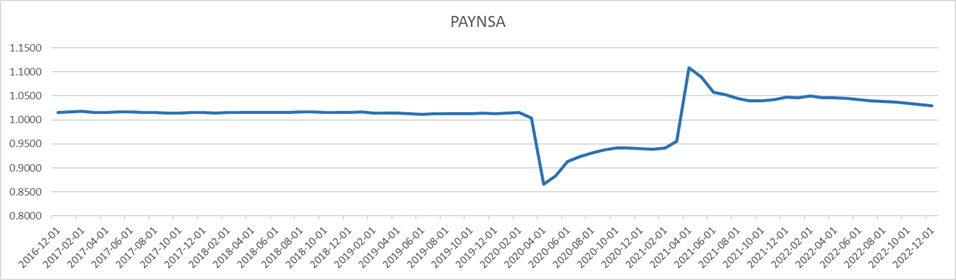
Co-incident Composite indicator since 1973 (My Excel Spreadsheet) PAYNSA Chart (FRED database) PCEDG Chart ( FRED database) IPGMFN Chart (FRED database) HNFSUSNSA chart (FRED database) A792RC0Q052SBEA chart (FRED database) SP500 12-month Momentum chart (Yahoo)
Summary
We are currently not in a recession, but the indicator is at a moderate level and falling. The good news is that this might also be the beginning of a great buying opportunity. Obviously, from the insight we gain from my indicator, we should be aware that the market might be bottoming out, but that the problems that occur during a recession can be expected. No one knows just when the recession will occur (no one ever does), but one must take steps to prevent personal disaster.
There are several ways to profit during a recession, or at least not suffer too much. Typically, there are sectors of the market that usually advance. Since interest rates are climbing, watch for trend changes in the general stock market. The Direxion Daily S&P 500 Bull 3x Shares ETF (SPXL) is a good vehicle, as are the S&P 500 index funds. Look for trend changes in the bond ETFs like the Direxion Daily 20+ Year Treasury Bull 3x Shares ETF (TMF) and Direxion Daily 20+ Year Treasury Bear 3x Shares ETF (TMV).
In my opinion, trend changes are outstanding indicators of new intermediate and long-term moves in most securities. Financial ETFs like the Direxion Daily Financial Bull 3x Shares ETF (FAS) and the Direxion Daily Financial Bear 3x Shares ETF (FAZ) are perfect ways to take advantage of changes in the general trend and protect one's assets during recessions. Treat them like any other security and watch them for long-term moves. Lastly, as I said above, watch for changes in the general trend of your favorite stock issues as bottoms occur during recessions. Remember: The trend is your friend.
For further details see:
Recession Risk Status This Year