QQQ - Recession Watch: Soft Landing Or 2025 Recession? Here's What You Need To Know
2023-10-06 07:00:00 ET
Summary
- The most anticipated recession in history is still likely, because of sticky inflation forcing the Fed to hike and hold until something breaks.
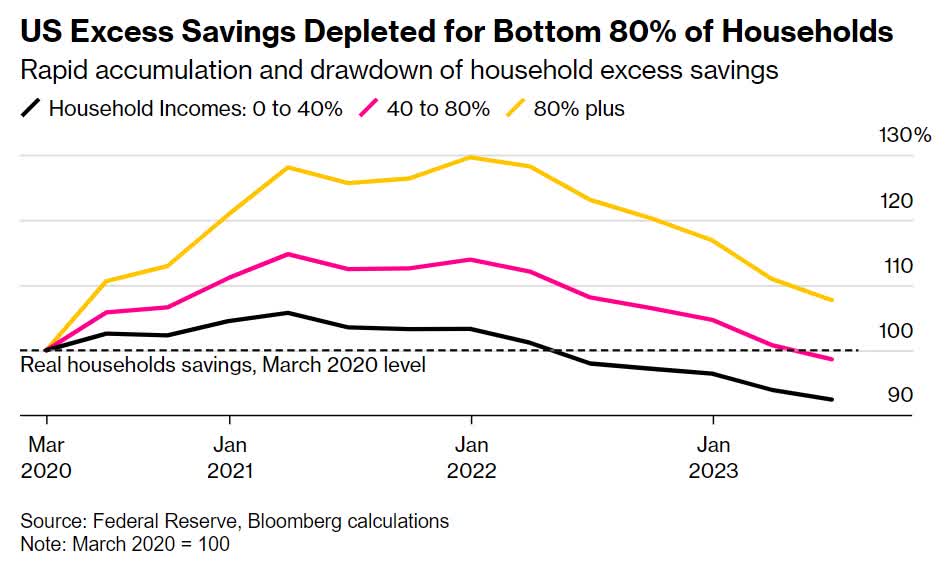
- Excess savings have run out for the middle class and poor, and credit card spending can only sustain the economy so long.
- Inflation is still high and credit card rates are at record levels, and now student loans are sucking $503 per month out of 40 million households.
- The recession is likely to begin between July 2024 and Q1 2025, though it might begin as late as second half 2025.
- The base case is for the market to bounce around near current levels before fundamentals catch up with the S&P 500 Index and it falls around 20% to 30% to fresh lows, finally hitting the final bottom. Fortunately, there are deep value blue chips you can safely buy today that are already priced for this recession and might be near a bottom or have already bottomed.
This article was coproduced with Dividend Sensei.
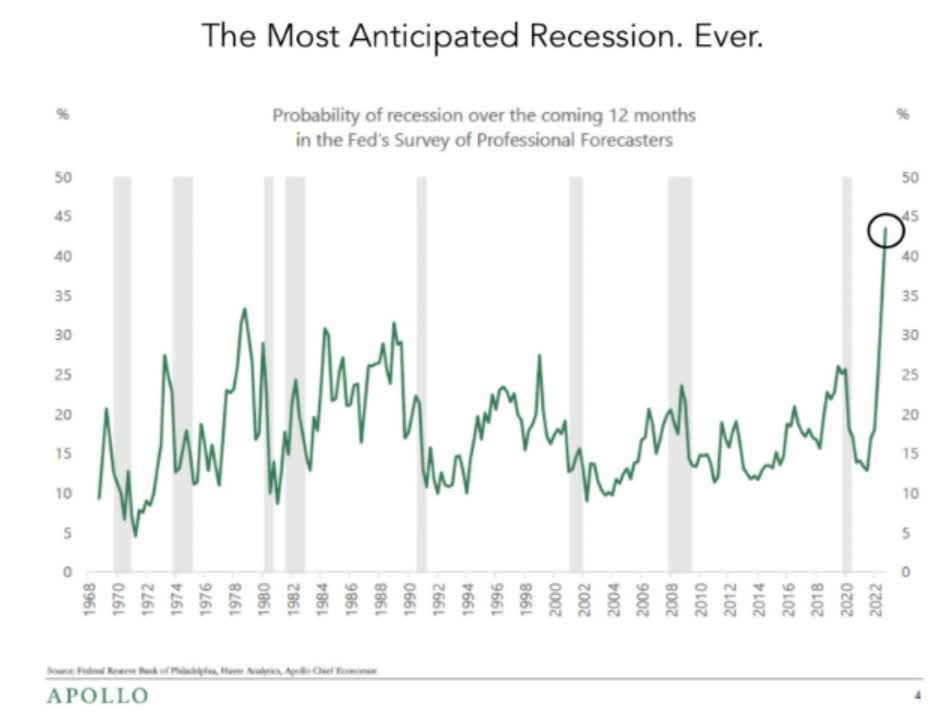
Does it feel like the recession of 2022, and then 2023, and then 2024 is the most anticipated recession in history?
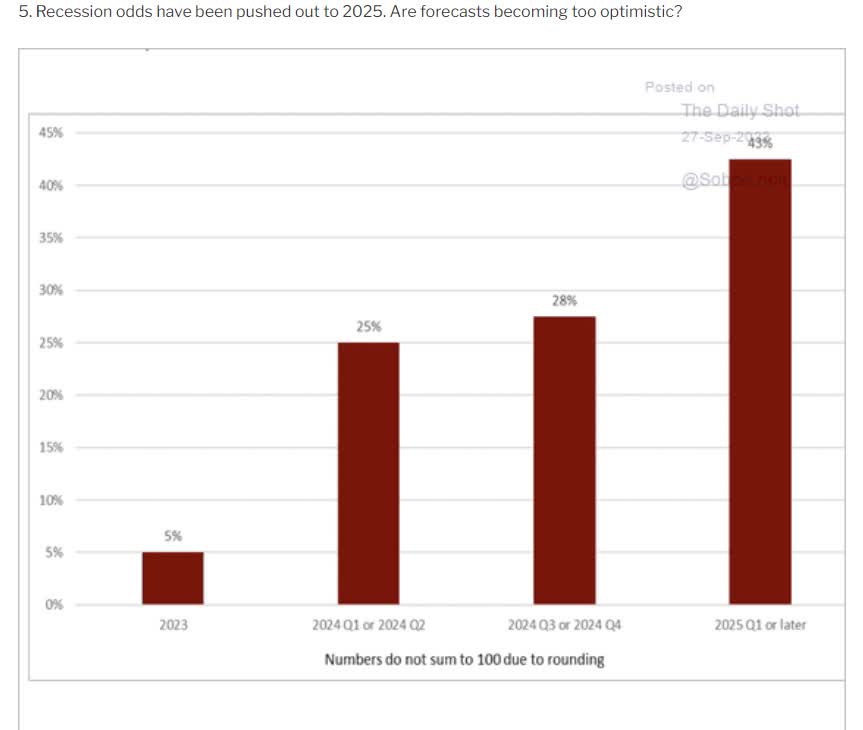
That's because it was, and still is... except now it's the recession of 2025.
Before you throw too much flack at economists, keep in mind that we're facing something unprecedented: $9 trillion in stimulus for which there are no models.
Excess savings, as measured by how much Americans have in their checking or savings accounts compared to pre-pandemic levels, have just started to run out for the middle class, and the rich are still sitting on $8K in extra cash.
The poor started running out in early 2022, just as the Fed started hiking rates.
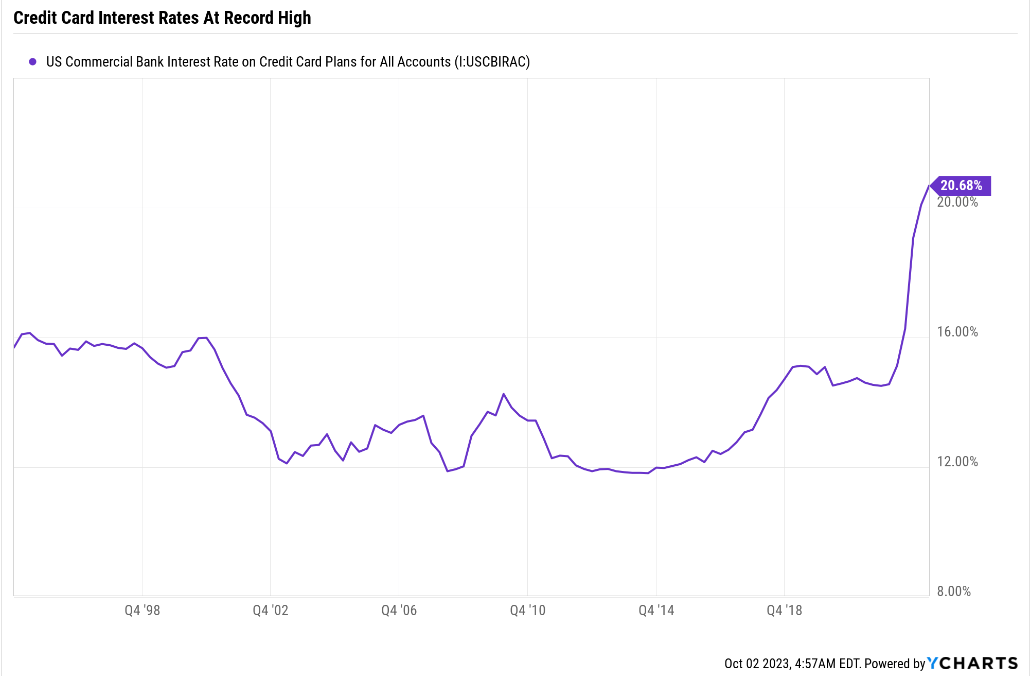
Credit card companies quickly took the opportunity to crank up rates from 14% to 20%, having never lowered them during the Pandemic.
Now the highest inflation in 42 years is starting to bite.
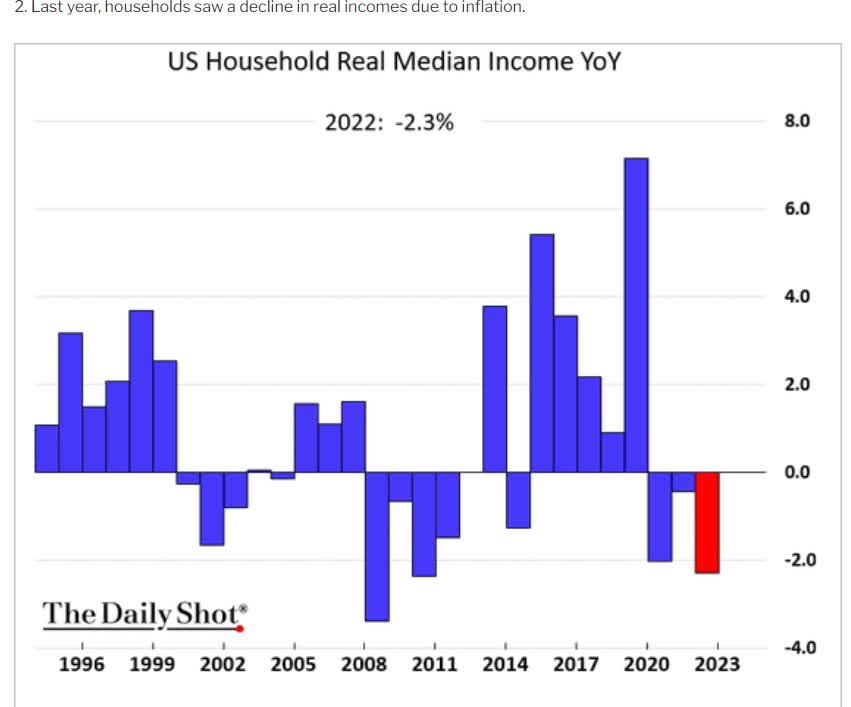
For three years now, median household income has been negatively adjusted for inflation, which explains why Americans are so angry despite an impressively resilient economy and the best job market in 54 years.
So, let's quickly review what's going on with the economy, what that likely means for corporate earnings, and when we can historically expect this bear market to end finally.
What's Going On With Inflation
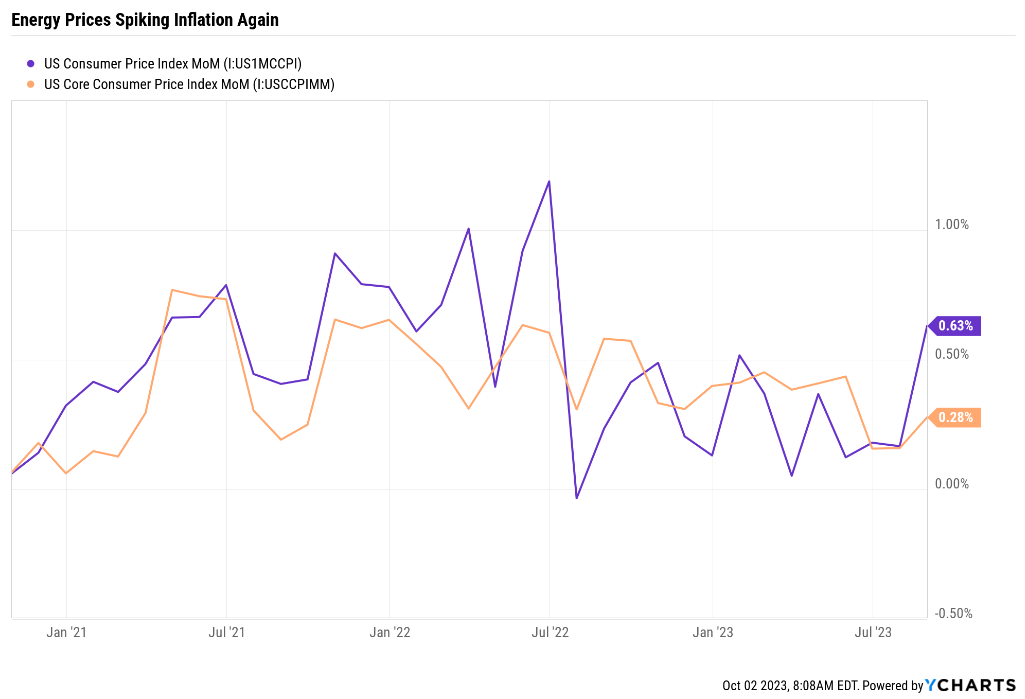
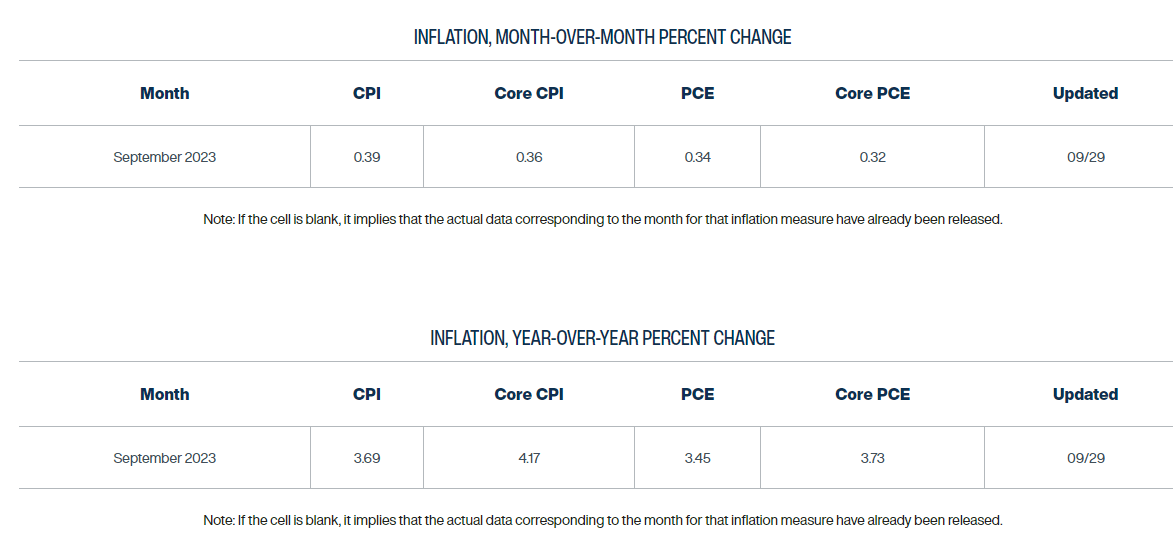
Headline inflation is CPI, and it spiked to 0.6% month-over-month thanks to higher energy prices.
Core CPI was still up 0.28%, or 3.6% annualized.
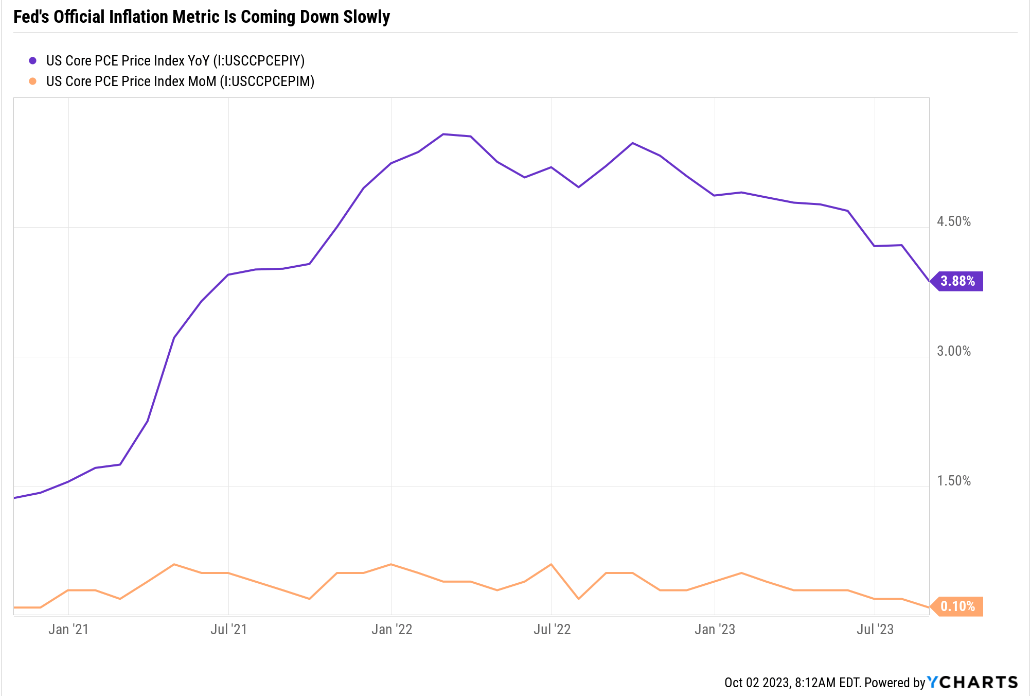
Core PCE (personal consumption expenditures) is the Fed's official inflation gauge. That's what the 2% long-term target is about, and while the MoM annualized rate was 1.2%, the year-over-year continues to remain stubbornly high.
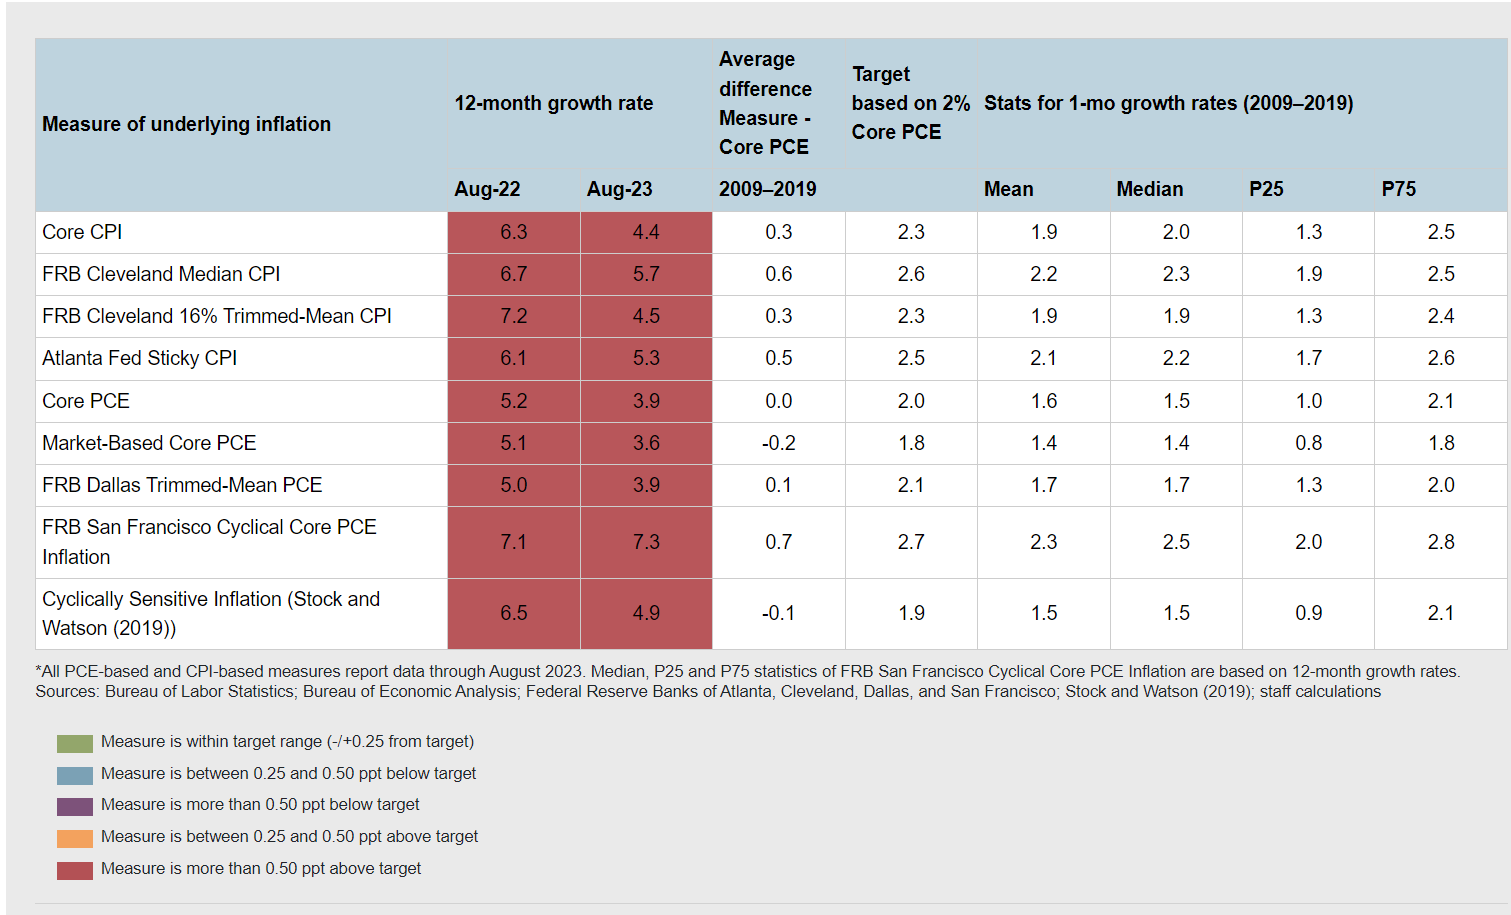
The Fed has other inflation gauges and considers itself to be very badly failing at controlling inflation.
- using its grading criteria.
Okay, but what about the future? What does the Fed forecast regarding inflation in the next few months?
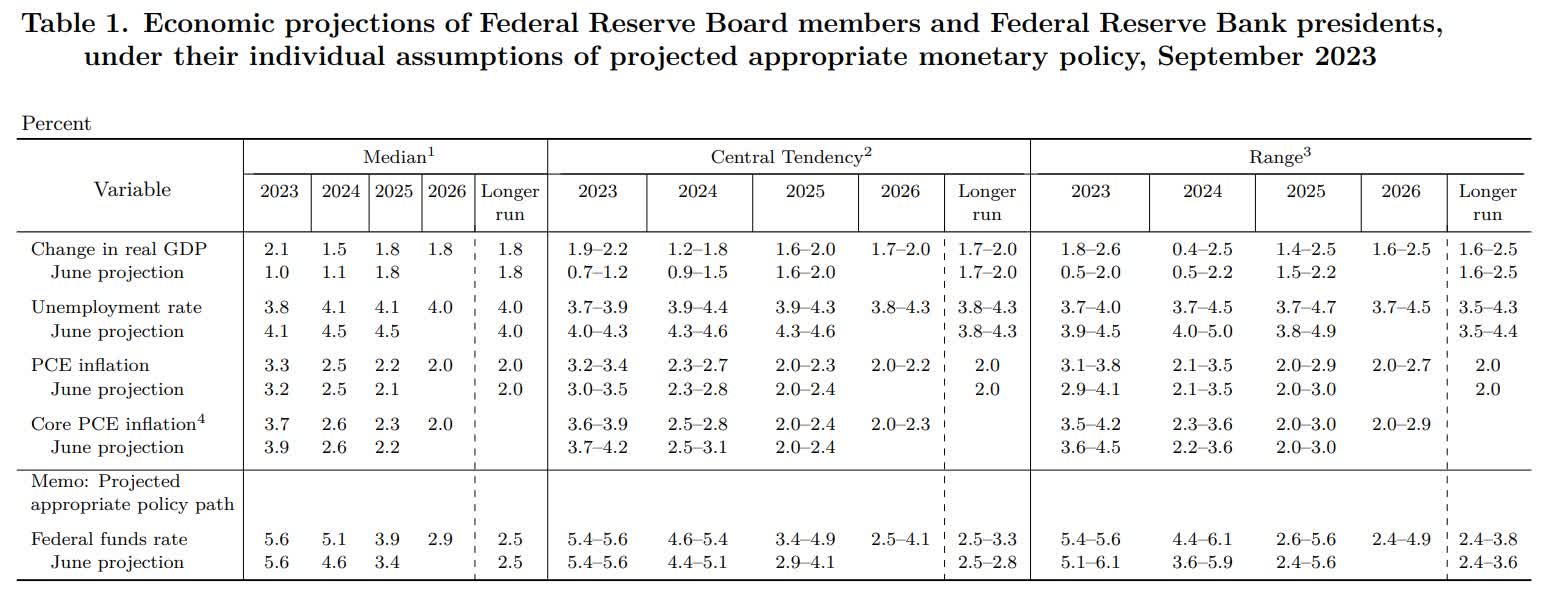
The September inflation reports will come out in mid-October, and you can see some minor improvement is expected, with 3.7% core PCE.
But the bad news is the Fed is expecting monthly core PCE to triple to 0.32%.
- 3.9% annualized core PCE.
Meanwhile, CPI is expected to come in at the same 3.7% it is now, and annualized monthly CPI at 4.9%.
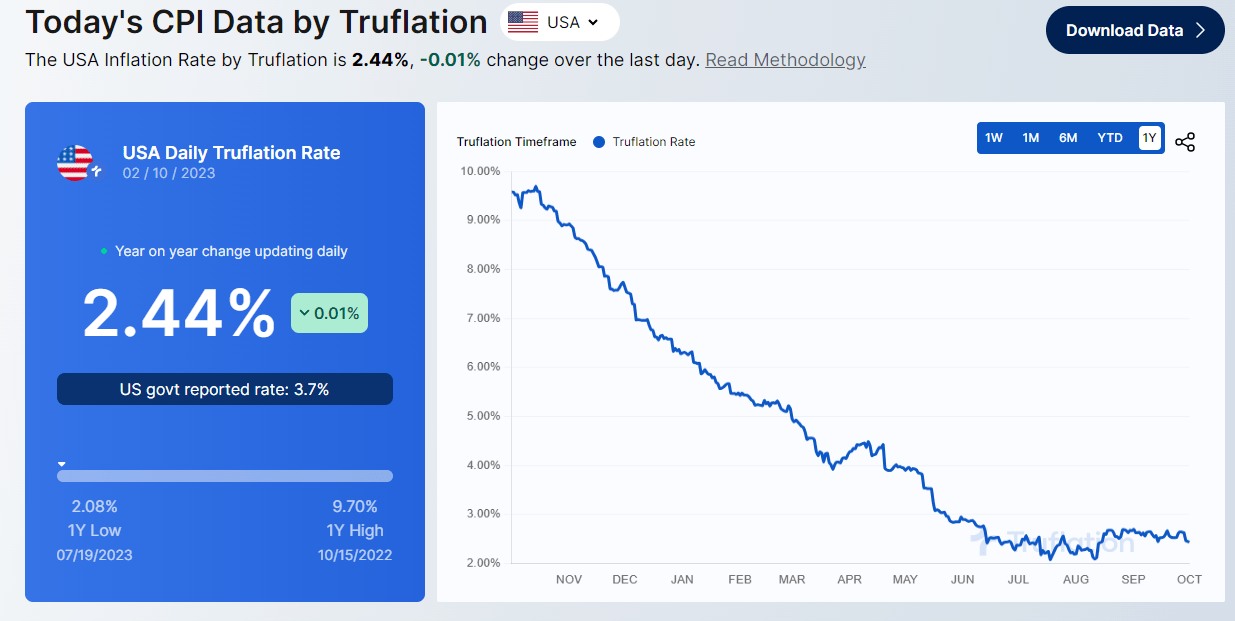
Using the same CPI basket as the government uses, 10 million real-time data points, updated daily, show inflation stuck about 0.4% above the Fed's long-term target.
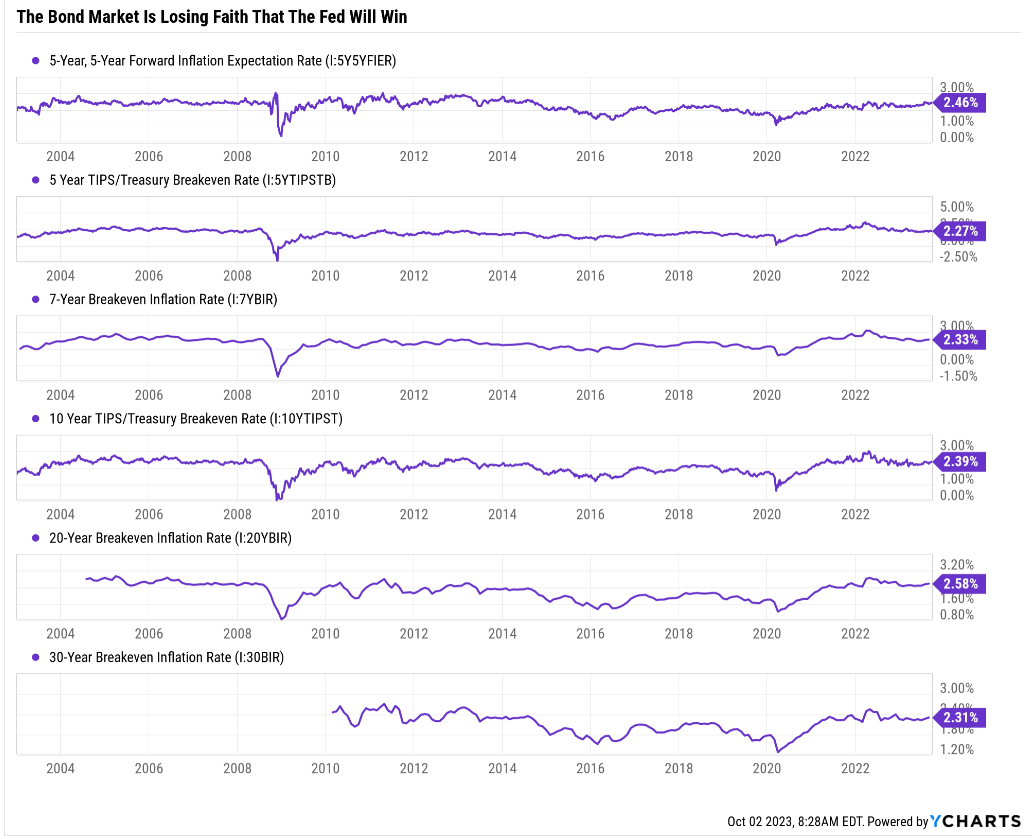
The bond market expects 2.3% to 2.6% long-term inflation, and here's the Fed's favorite long-term inflation gauge.
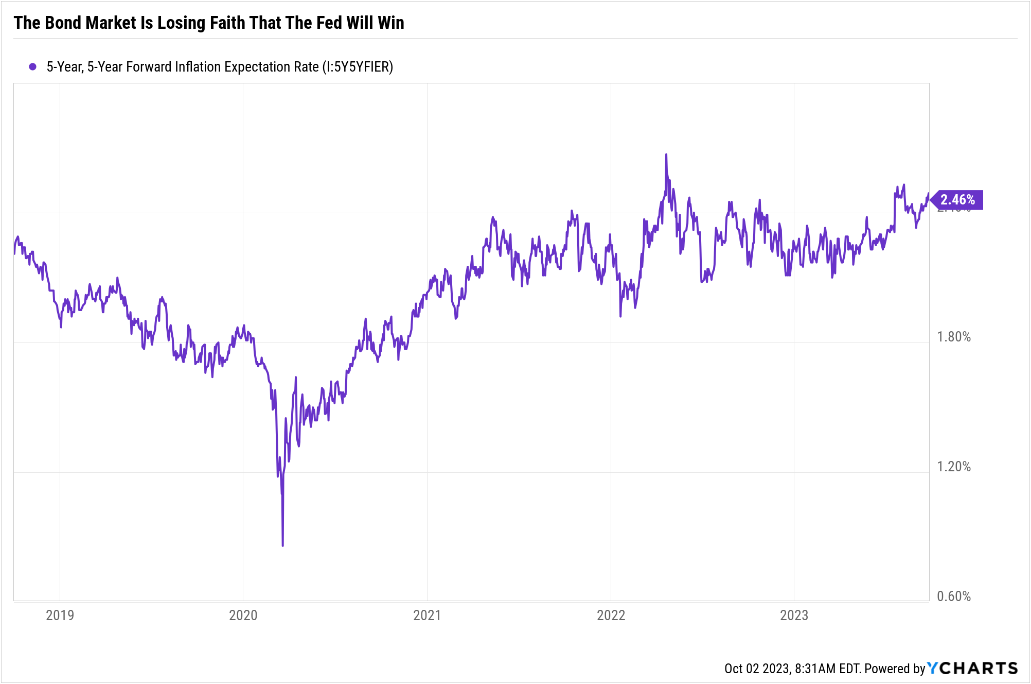
The Fed's favorite bond inflation expectation gauge has been slowly drifting higher over time as inflation gets stuck, and the Fed doesn't seem to have the stomach to keep hiking.
The Fed's official forecast is for one final hike in November and then to keep rates at 5.5% until November 2024.
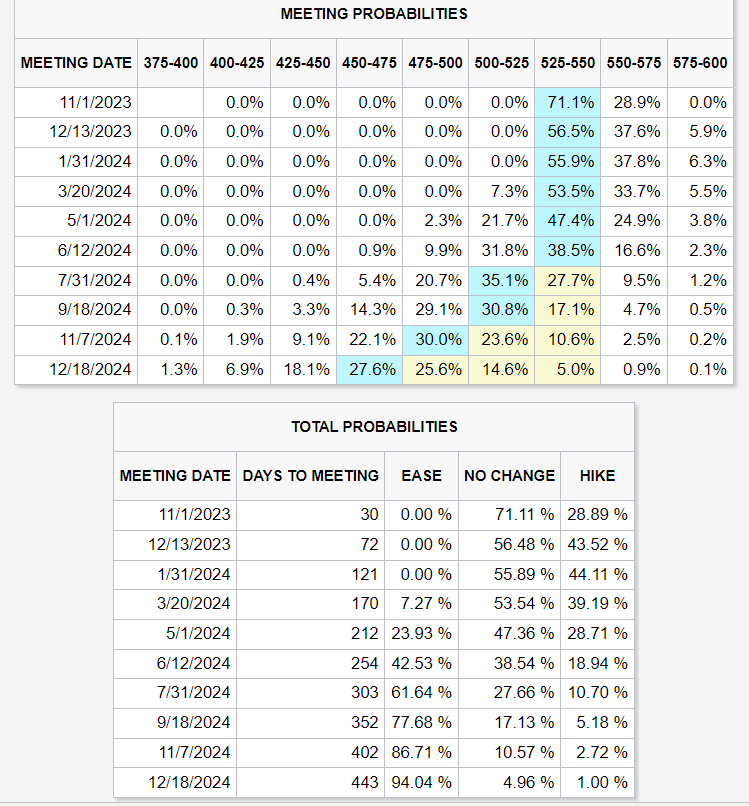
The bond market doesn't think the Fed will hike anymore and thinks a July cut is the most likely.
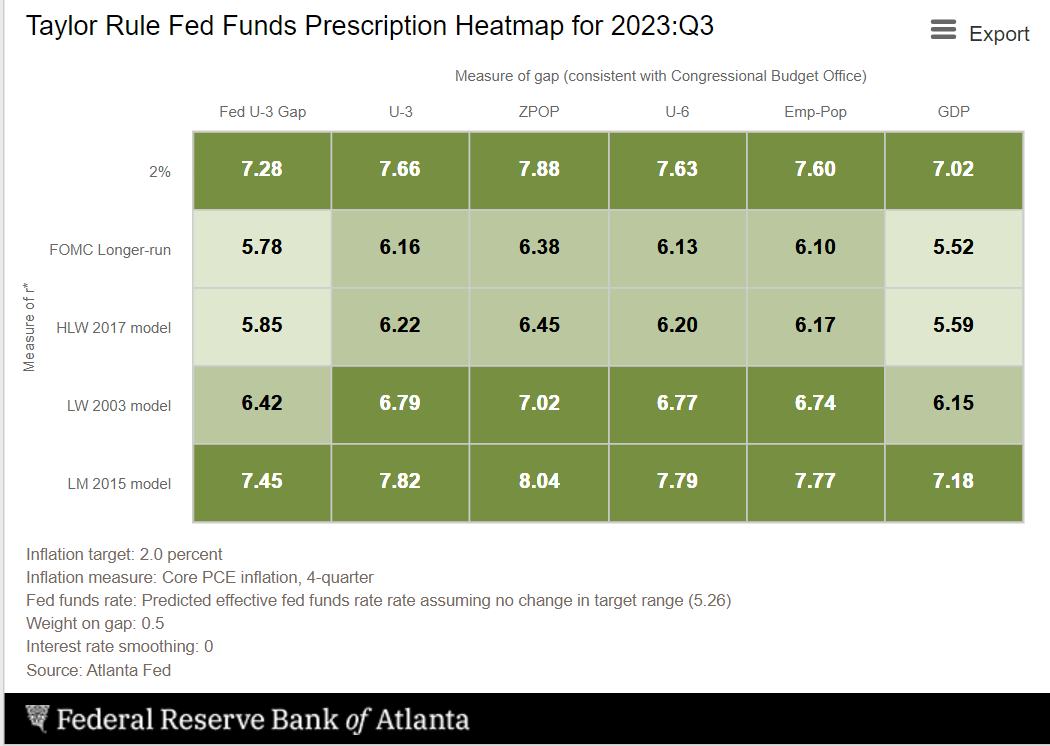
The Fed's own 2% inflation targeting model says the Fed should be at 7% to 8% right now.
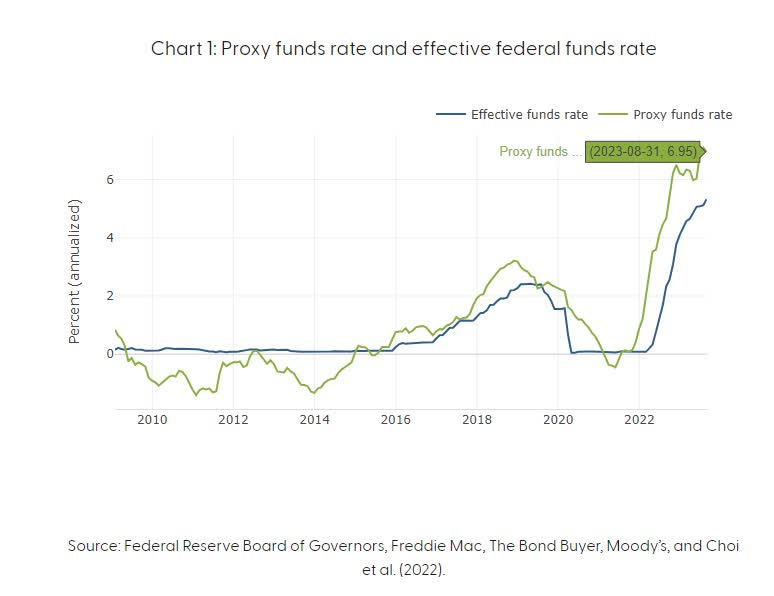
The San Francisco Fed's model estimates the Fed is at 7%, including QT and the regional banking crisis.
The Fed wants to take its time with hikes because it still believes it can achieve a smooth landing.
That's never occurred with inflation starting at 5+%, but the Fed thinks it might be able to achieve it. In fact, its base case is that it will achieve a soft landing, gaming inflation with no significant increase in unemployment.
So here's what that likely means for you in terms of short-term rates.
- Fed either 5.25% or 5.5% for most of 2024
- high-yield savings accounts hovering around 5%
- risk-free short-duration T-Bills 5% to 5.5%
- borrowing costs rising steadily.
Just a reminder that credit cards are at their highest level in history.
When the Fed was at 6% in the late 90s credit card rates were 16%.
When they were zero during the Pandemic, they were at 14%.
And now they are 21% and likely to keep climbing at a steady rate.
What's Going On With Long-Term Interest Rates
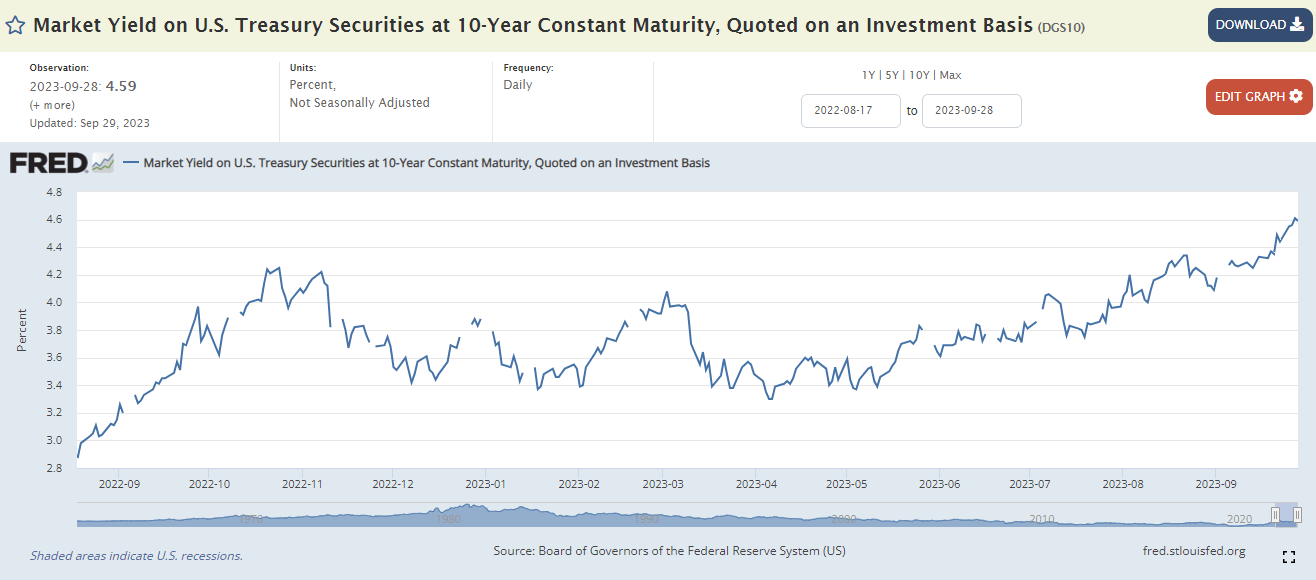
In the last 3 months, 10-year yields (US10Y) are up 0.7%, in an unexpected move that has shocked most economists.
The reason is that the bond market is now becoming less certain about what the Fed will do and where inflation will wind up.
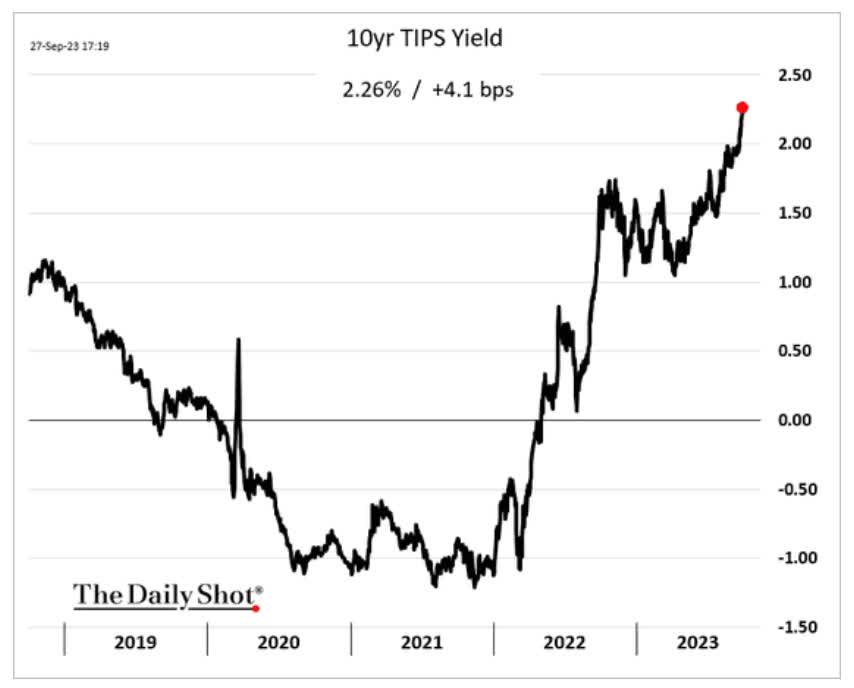
Last week the real yield, 10-year Treasury - 10-year inflation expectations, hit 2.38%, the highest in 16 years.
During the Pandemic, the Fed put rates on the floor, and the bond market was so certain that inflation would remain tame forever that it was willing to speculate on negative rates like in Europe.
That is how real yields can go negative.
The historical real-yield since 1790 is 1.5%, which we normalized to in early 2023 and then took off to new highs in recent weeks.
What causes real yields to soar this quickly when inflation forecasts aren't rising?
The uncertainty around where the Fed will tolerate inflation.
The Fed's official line is "We remain committed to 2% long-term inflation" which it now expects to occur in 2027.
However, the bond market thinks the Fed will tolerate its upper-end range of 2.5%.
Some economists are calling for the Fed to tolerate 3% to 4% inflation, which would mean 4.5% to 5.5% 10-year yields would be normal and healthy.
Add in $1.5 trillion in bond sales this year and a lack of Japanese buyers, and you have a very illiquid market for these new bonds.
Bank of America thinks the worst-case scenario is that real yields climb to 3% or 0.6% higher than now.
- about 5.25% 10-year yield
- about 5.5% 30-year yield (US30Y) (same as Bill Ackman).
What's Going On With The Economy
OK, so the Fed is almost done hiking, or so it says; the bond market is certain the Fed is done hiking, and long rates have soared, squeezing capital costs across corporate America.
Is the surge in yields why NextEra Energy (NEP) cut its guidance in half, triggering a 33% decline in 2 days? Yes.
Is it triggering a wave of defaults in office properties that likely explains WPC's coming 20% dividend cut? Very likely.
But what about the actual economy?
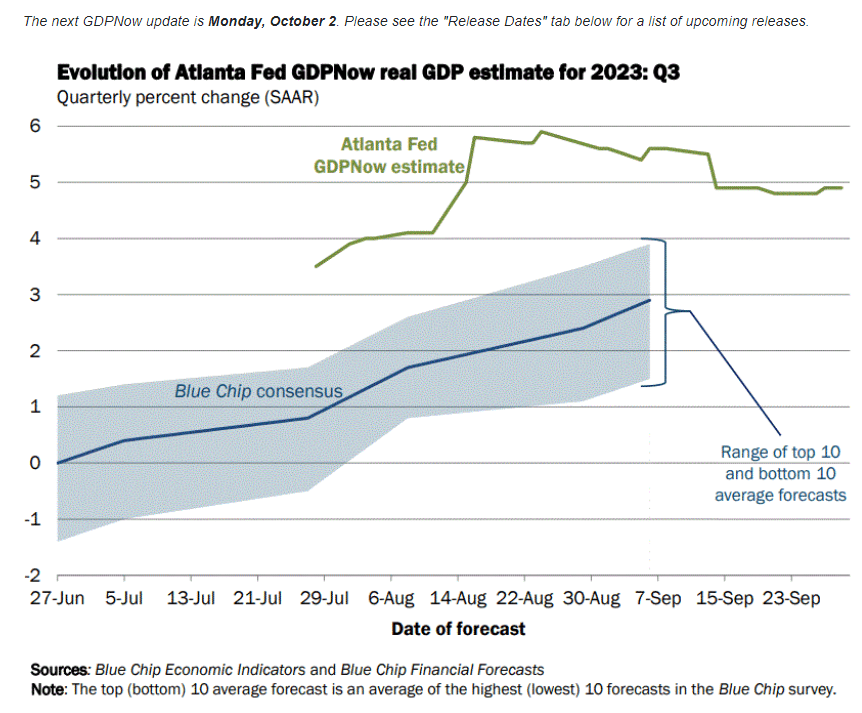
The Atlanta Fed's real-time economic model says we're growing 5% annually. And GDP numbers are always adjusted for inflation.
Note that the blue-chip consensus estimates a still strong 3% and that has been rising steadily from 0% for months.
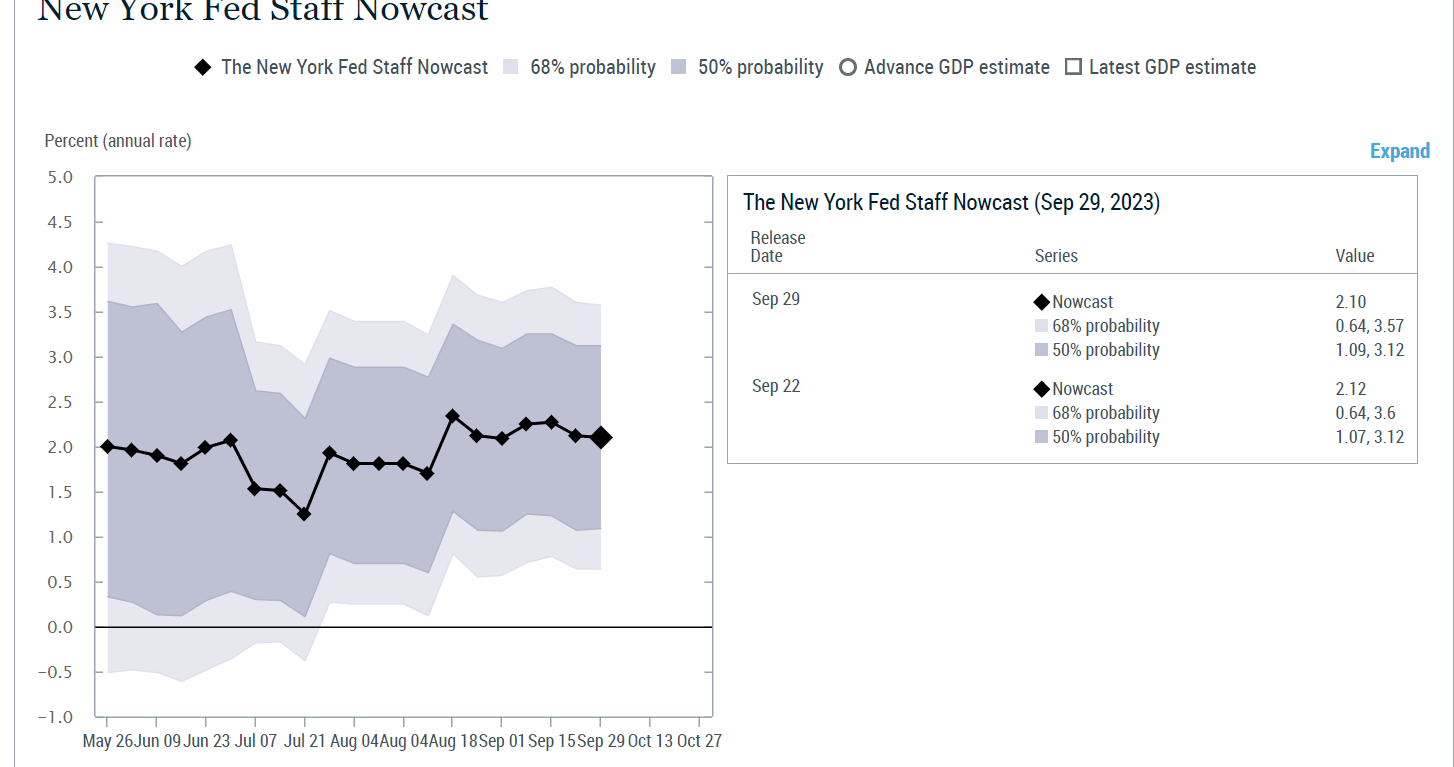
The NY Fed's model says we're growing at 2%, the long-term economic potential.
But note the margin of error is now above zero, so we can pretty much rule out being in a secret recession somehow hidden in the data.
The long leading indicators had been getting even more negative, led by interest rates, but notably this week several measures of financial conditions improved. " - NDD .
As far as the weekly economic data goes, the long-term indicators are still pointing to recession, agreeing with the conference board's leading indicators.
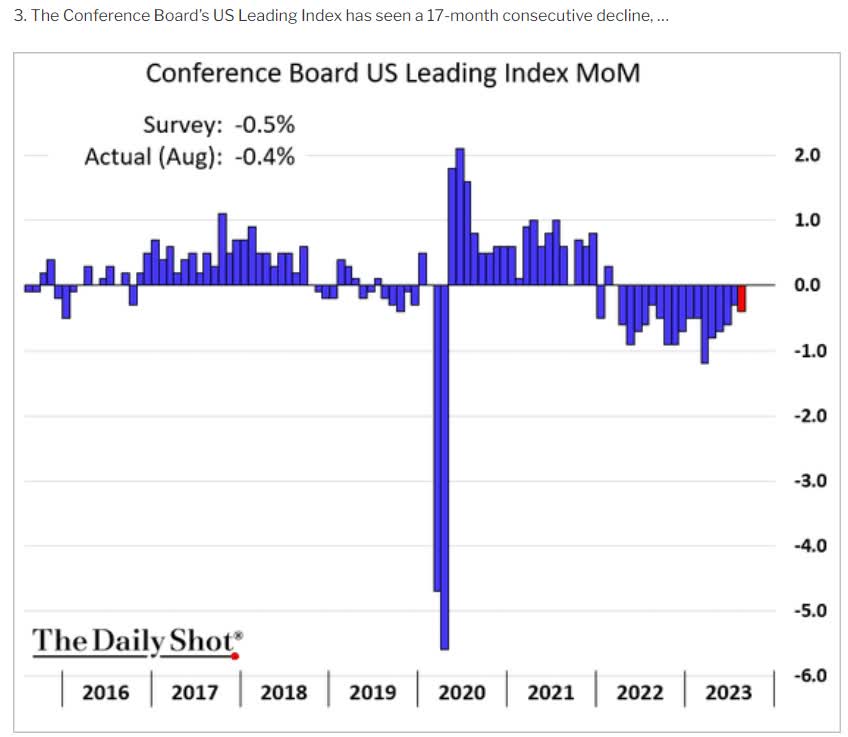
Since August 2022 the economy has been getting weaker each month according to the conference board.
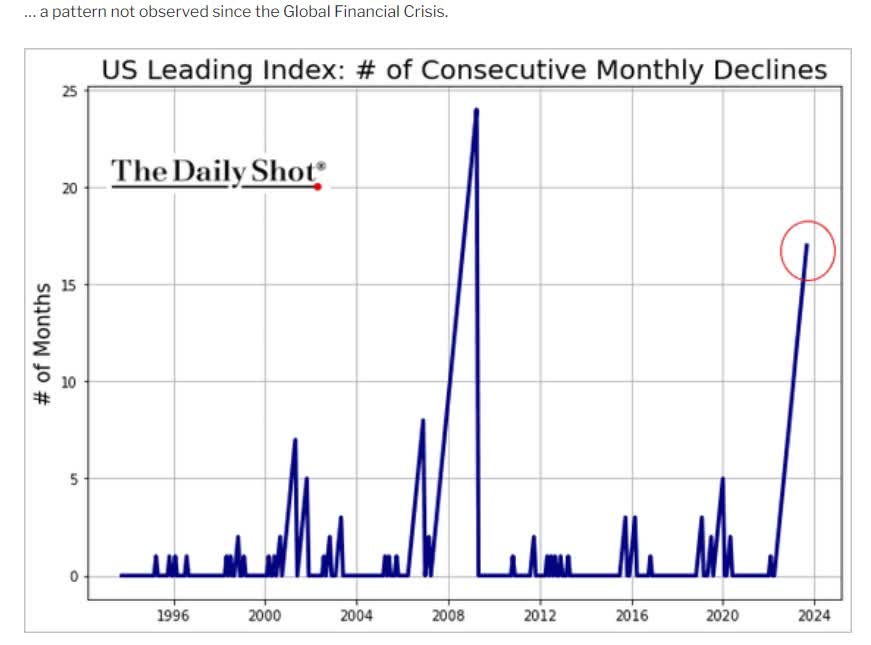
That's the 2nd longest streak in the history of this survey.
Note that the only time that had a longer period of declining economic leading indicators was before the Great Recession, when it took 42 months of Fed hikes before we went into recession.
Long and variable lags can take a lot longer than people imagine.
Especially with so many consumers and businesses bringing on lost rate debt that will either have to be repaid or rolled over at much higher costs years from now.
Some economists have claimed that the Fed's hikes will move through the economy with lightning speed because the Fed telegraphs its plans ahead of time and everyone on Wall Street knows to check CME to get real-time interest rate probability estimates.
On the other hand, and this is what I personally believe, if most Americans gorged on debt and locked in low rates years ago, then why should you expect 5.25% worth of rate hikes done in record time to instantly hit the economy?
My sister just had to get a new car at an 8% interest rate. Now that's a $600 bill each month.
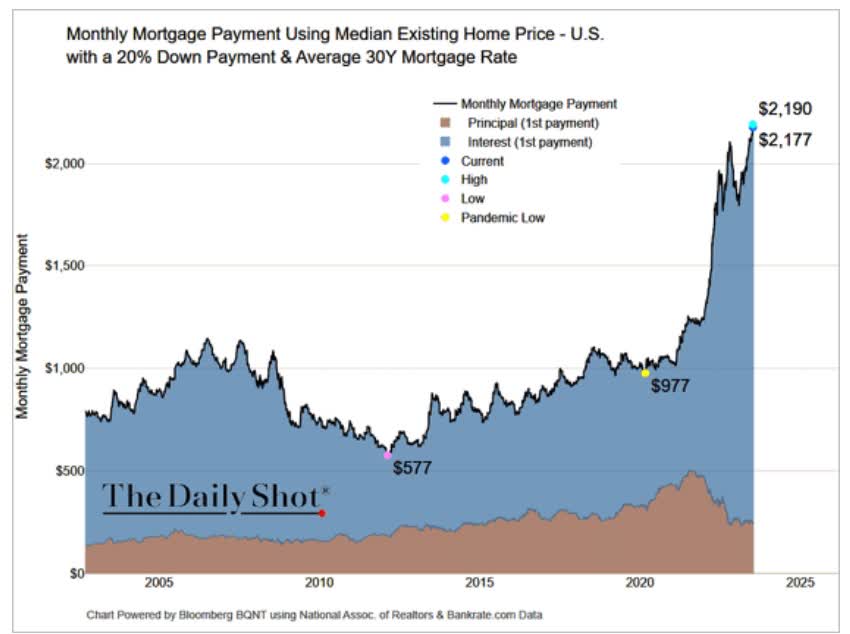
Mortgage rates?
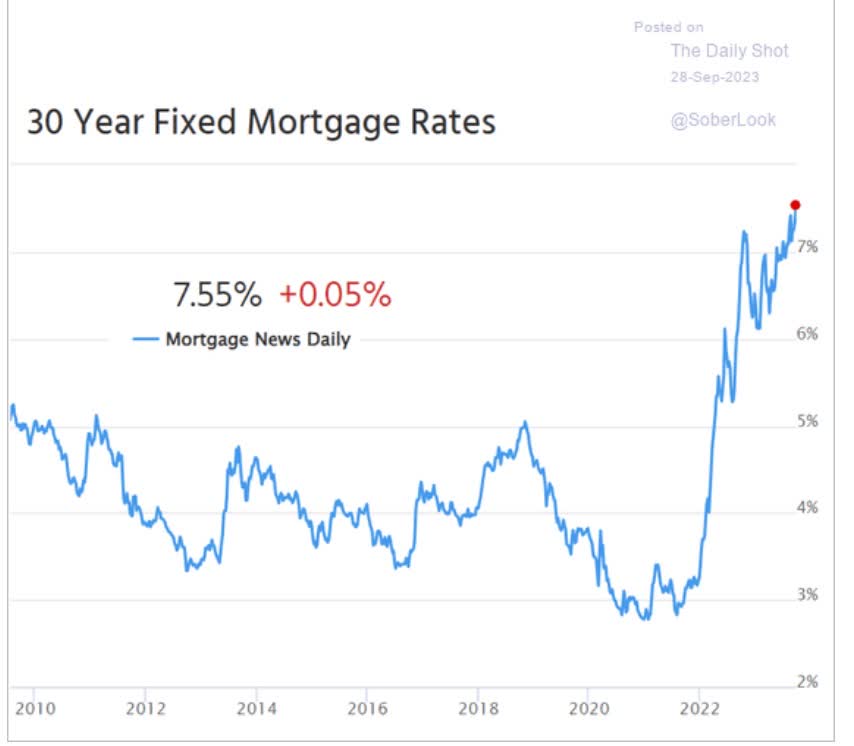
They have just hit new highs, and existing home sales have fallen off a cliff.
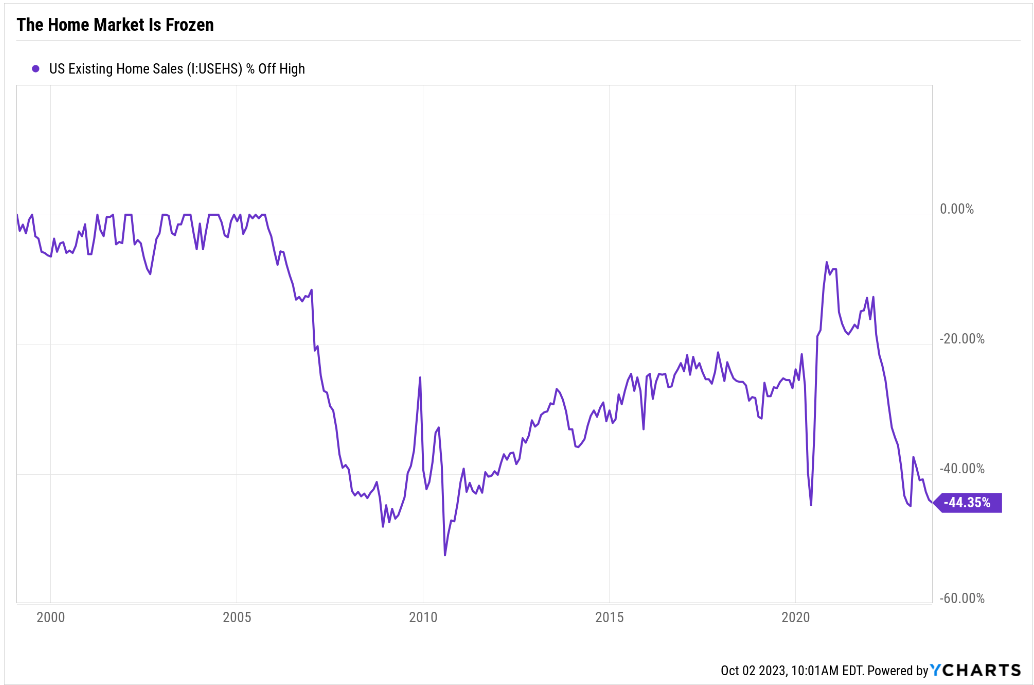
Existing home sales are at the lowest level in 12 years thanks to mortgage costs soaring 4X since their 2013 lows.
OK, so home prices must be crashing right?! Down 10%, 20%, 30%, right?
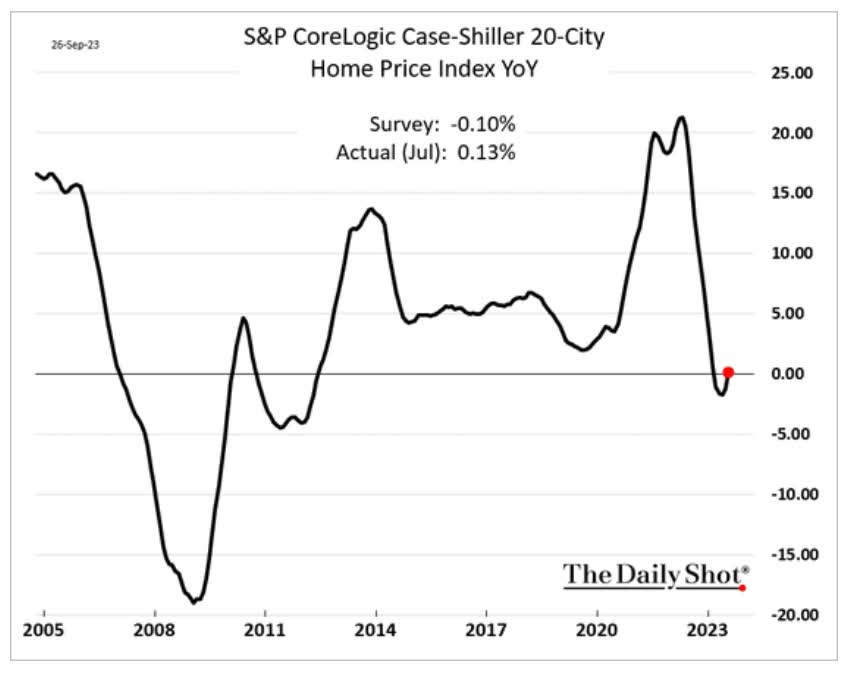
Nope, home price inflation fell from over 20% to slightly negative for a month, and is now back to zero.
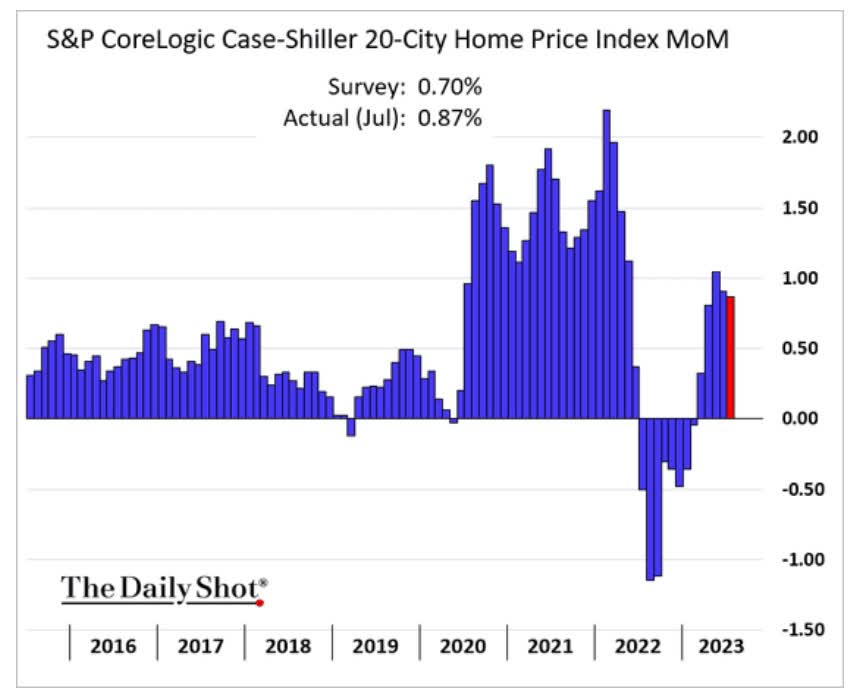
Home prices are now soaring again, almost 1% month over month and that's the 5th consecutive month of rising prices.
- 11.4% annualized rate of home price increases.
So you can see why JPMorgan (JPM) CEO Jamie Dimon is a bit worried that the Fed might have to keep hiking to levels that would have even recently seemed absurd or insane.
Seeking Alpha
Indeed, we're not ready for 7% Fed Funds rates because, according to the San Fran Fed, we're already there, and 7% rates would be equal to 9% rates.
The proxy rate factors in the Fed's reverse money printing right now.
Imagine it's 2006 and the Fed never did QE at all. Now imagine the Fed hikes from 0% to 7% in 18 months.
And now imagine that this won't cause a recession at some point. Tough to imagine right?
What's Going On With Earnings (Hint: The Analysts Are Overly Optimistic)
Analysts are wildly optimistic that after a 6% decline in earnings in 2023 caused by inflation coming down, earnings growth will rebound 11% and then accelerate further to 13% in 2025.
For context, 6% is the historical earnings growth rate, and analysts think that big tech's continued dominance will drive 8.5% earnings growth long-term.
But isn't a recession expected in 2024 or in 2025 at the latest? Yes it is.
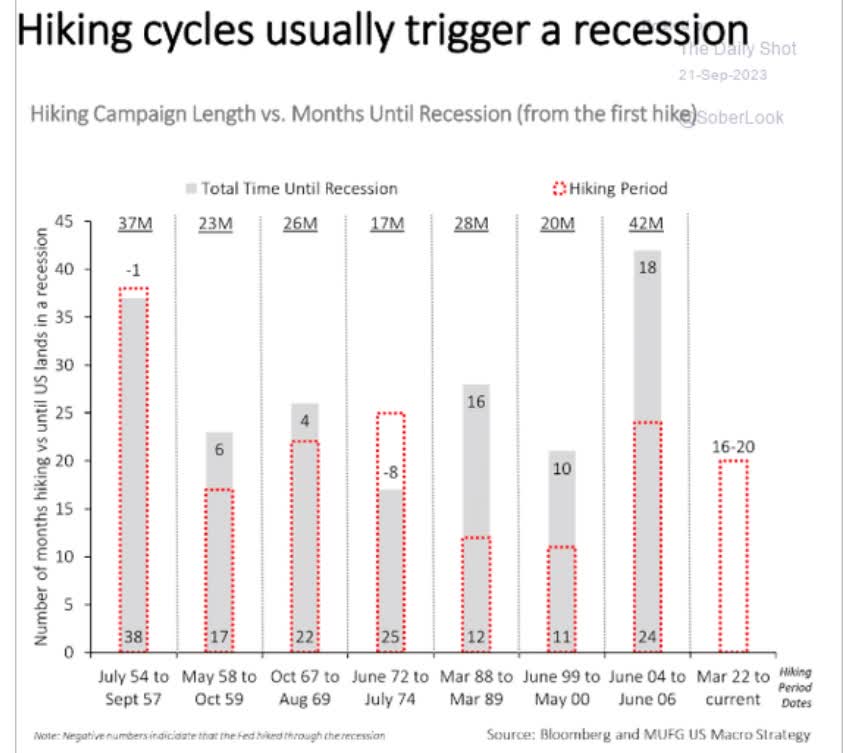
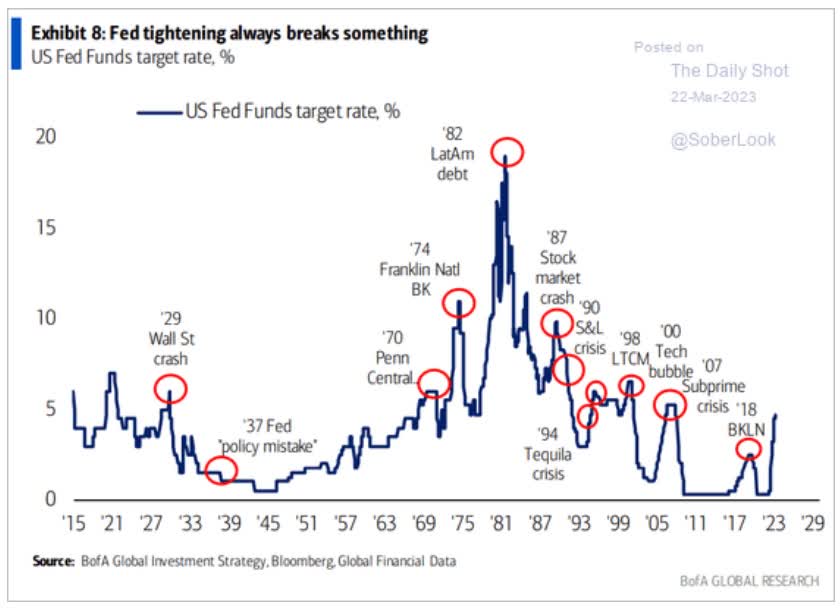
The Fed always hikes and leaves rates high until something forces it to cut.
So, how often do earnings go up in a recession? How often do they rise 25%?
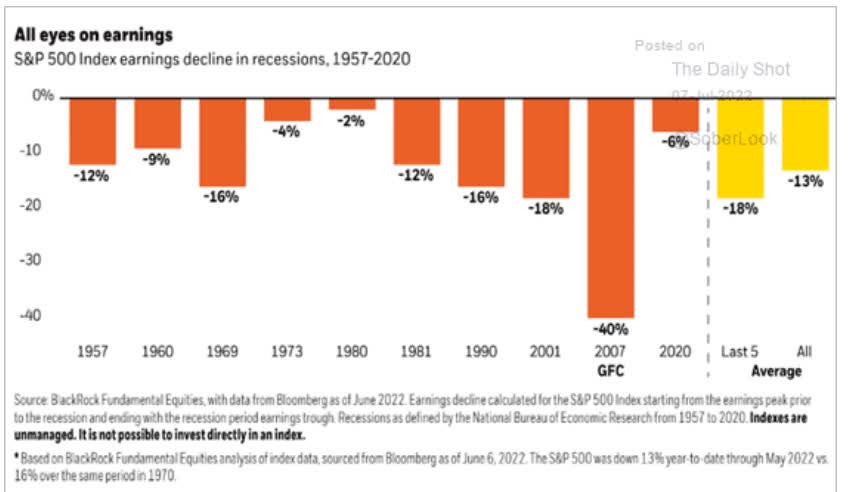
Earnings never go up in a recession, not even when inflation is raging at 15% as it was in 1980 and prices for everything were soaring.
So how do you explain earnings roaring 25% higher in a recession that only ends because the Fed cuts rates because inflation collapses and prices are no longer rising?
Simple, they can't.
So, here's what that means for the stock market assuming a recession at any time in 2024.
S&P Bear Market Bottom Consensus Model Recession 2024 (Doesn't Matter When It Begins)
| Earnings Decline |
| S&P Trough Earnings |
| Historical Trough PE Of 14 (13 to 15 range) |
| Decline From Current Level |
| Peak Decline From Record Highs |
| 0% |
| 276 |
| 3858 |
| 10.0% |
| -20.0% |
| 5% (consensus) |
| 262 |
| 3665 |
| 14.5% |
| -24.0% |
| 10% |
| 248 |
| 3472 |
| 19.0% |
| -28.0% |
| 13% (historical average |
| 240 |
| 3356 |
| 21.7% |
| -30.4% |
| 15% |
| 234 |
| 3279 |
| 23.5% |
| -32.0% |
| 20% (Morgan Stanley, Moody's) |
| 220 |
| 3086 |
| 28.0% |
| -36.0% |
(Source: DK S&P Valuation Tool, Bloomberg, FactSet.)
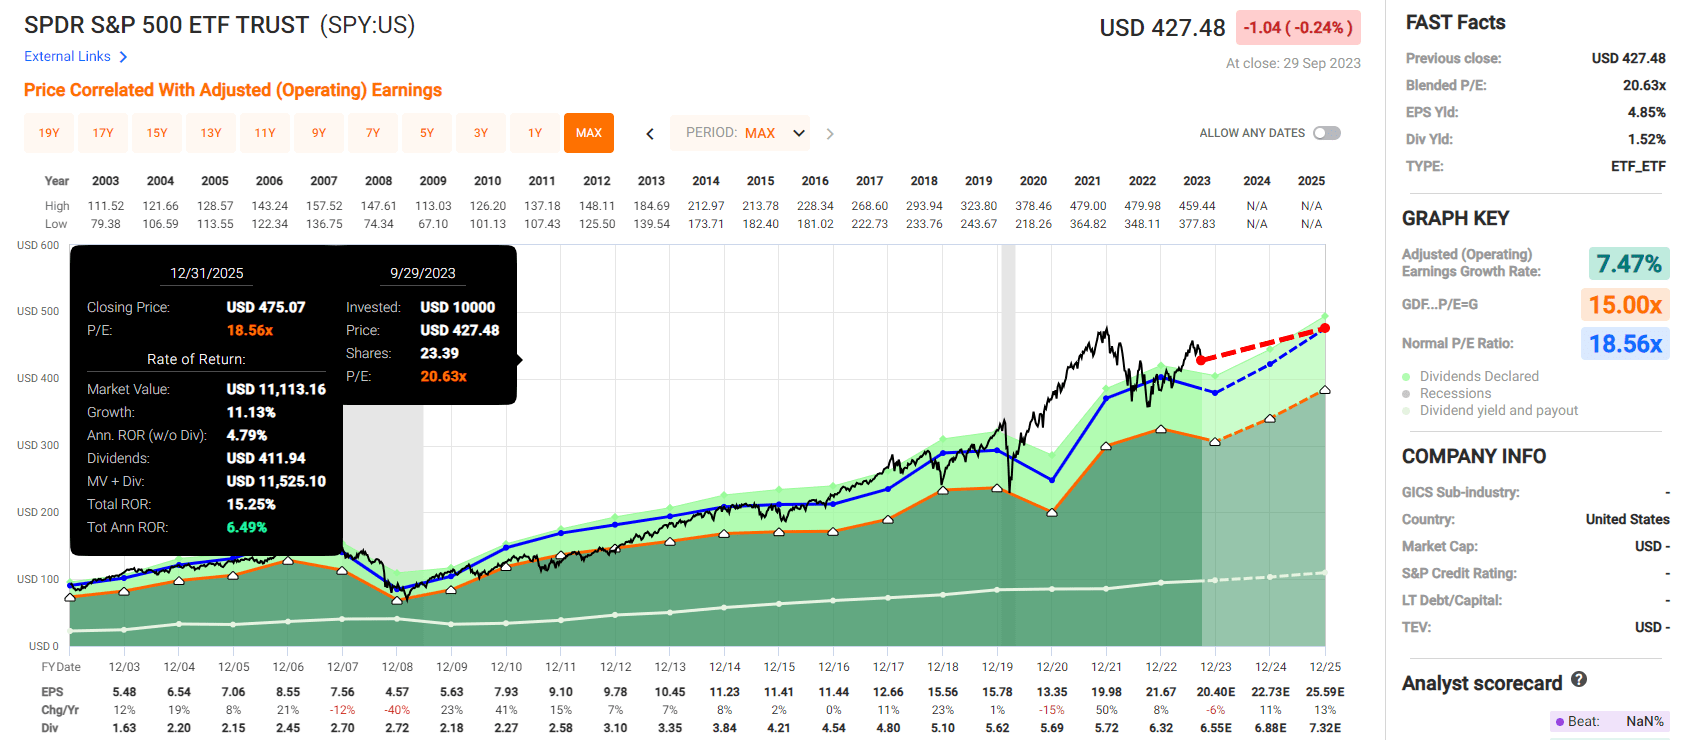
Can you see why I'm not exactly recommending anyone buy the S&P 500 (SPY) or Nasdaq (COMP.IND) right now?
- S&P is 5% historically overvalued assuming no recession
- Nasdaq is 30% overvalued assuming no recession
Bottom Line: The Recession Is Still Likely, It's Just Delayed Again
Injecting $9 trillion into the economy via stimulus and QE has made predicting the most anticipated recession in history tougher, but the data still says we're headed for a recession.
It's just likely to be in 2024 or possibly even in 2025.
- the longest lag from 1st Fed hike to recession is 42 months
- September 16th, 2025 in this case.
Fortunately, a recession won't be a problem for the best quality blue chips.
It's not always easy to know what those are.
- Boeing (BA) was an Ultra SWAN until the Pandemic destroyed its dividend.
- Simon Property (SPG) was an Ultra SWAN until the Pandemic forced a dividend cut.
- 3M's (MMM) years of deteriorating fundamentals - and now likely far larger than expected legal liabilities - pose a high risk of a dividend cut, and a 2024 or 2025 recession could be the final nail in that coffin.
But other than a handful of suffering blue-chips, most of the SWANs, Super SWANs, and Ultra SWANs are holding up great in the face of soaring interest rates and all manner of political craziness, including geopolitical stress not seen in 80 years.
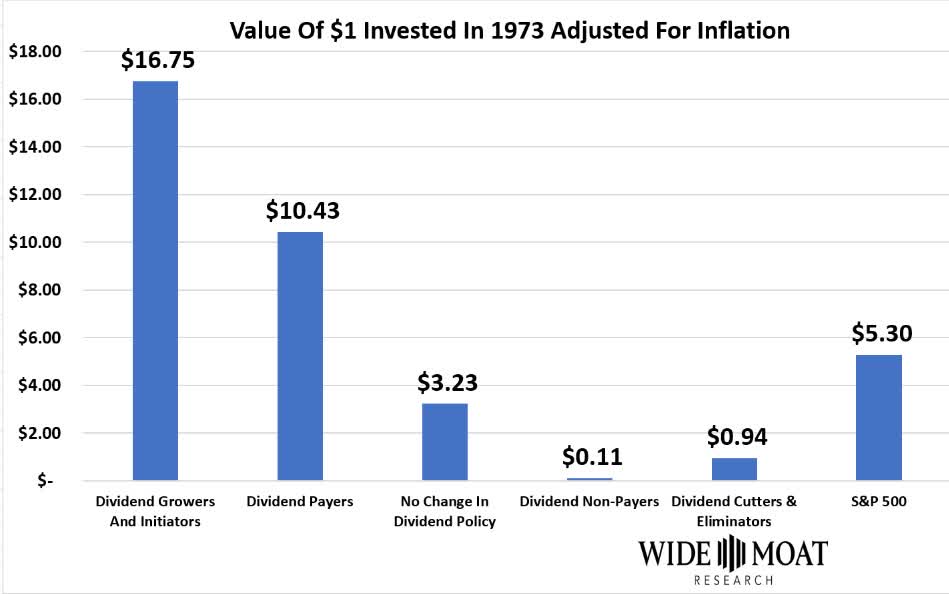
That shows the power of dividend blue-chip investing.
It's the best investment strategy of the last 50+ years, and something I'm willing to bet my life savings on, and the hopes and dreams of my entire family.
For further details see:
Recession Watch: Soft Landing Or 2025 Recession? Here's What You Need To Know