IVW - Recessions Often Aren't Bad For Stocks
2023-04-27 03:11:54 ET
Summary
- The historical record shows U.S. stock market performance following recessions hasn't always been bad.
- In fact, U.S. stocks have often done quite well soon after the onset of recessions.
- If the current time period ends up being classified as a recession, it will likely have started six or seven months ago.
- On average, stock returns starting six or seven months after recessions actually begin have been quite strong.
Stock performance around NBER recessions
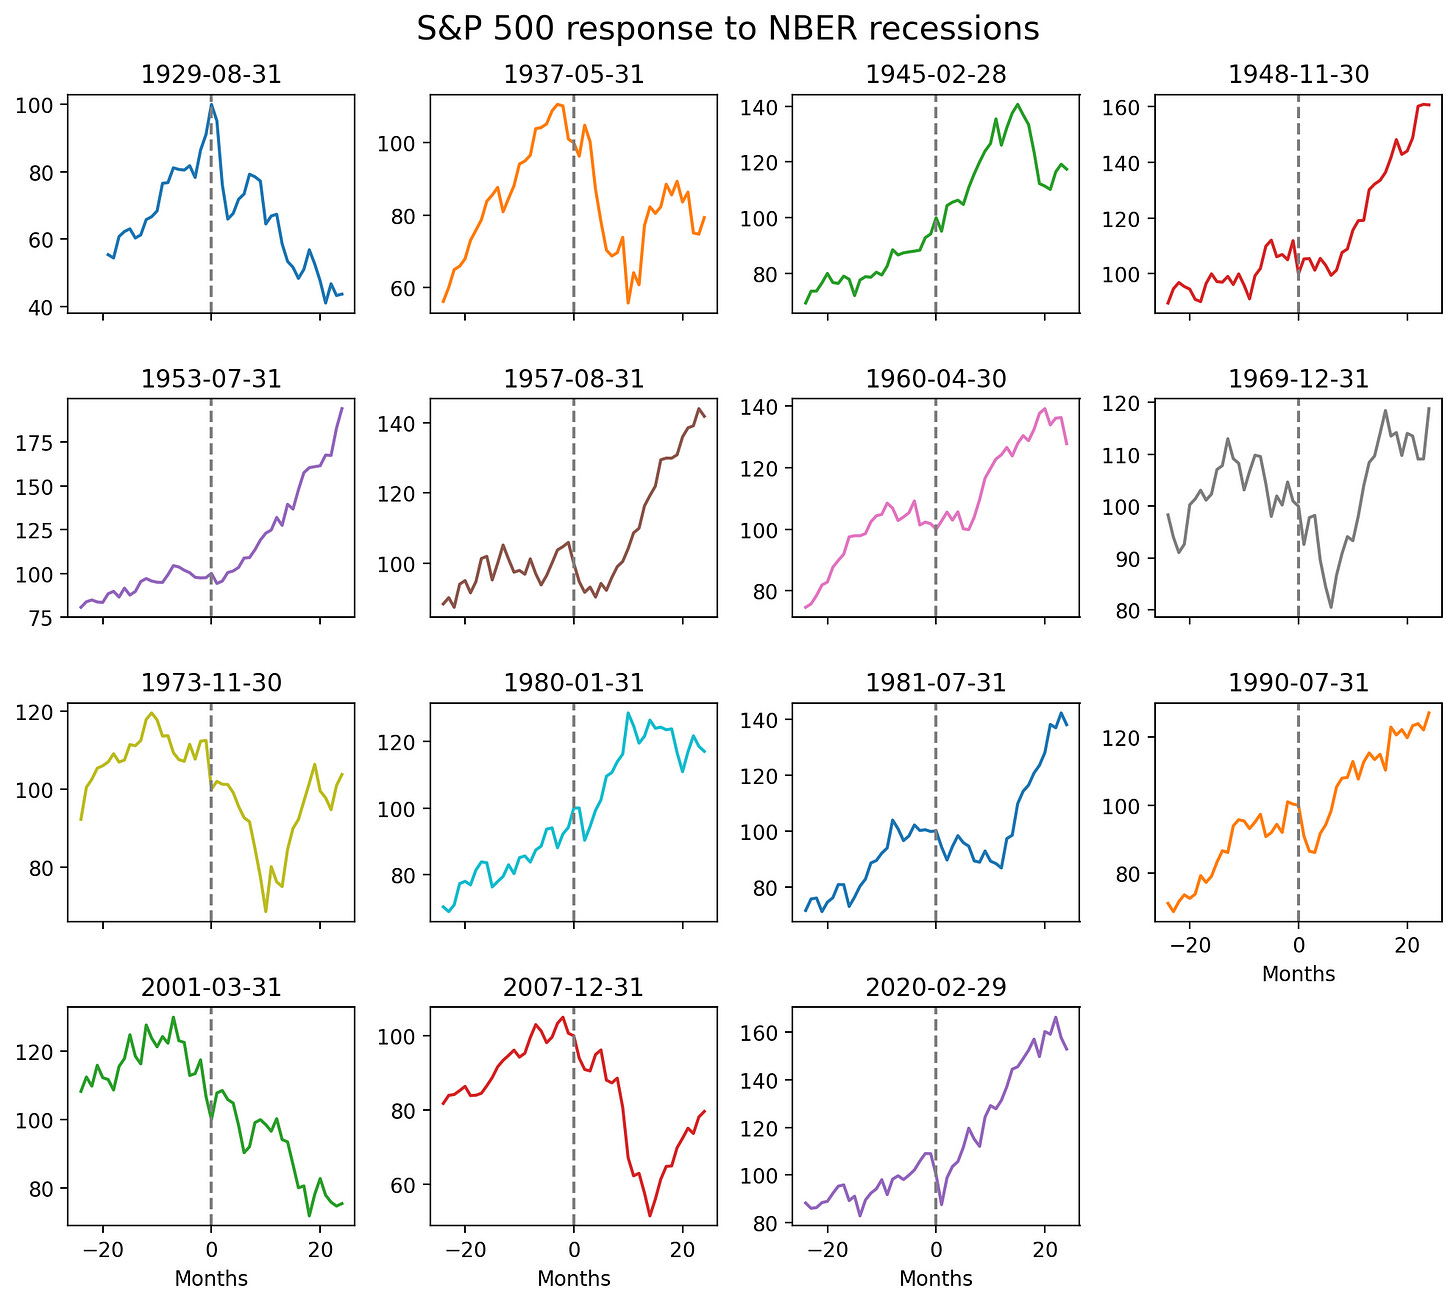
Investors and the financial media have devoted considerable attention recently to the likely impact of the oft-forecasted recession set to arrive later in 2023. One recent article lists all of the National Bureau of Economic Research (NBER) recession start dates going back to 1929 and points out that the stock market did not bottom until several months or years after each NBER-identified recession began. Digging a little deeper into this claim, the figure below shows the performance of the S&P 500 in 24-month windows before and after each NBER recession start date. The S&P 500 is normalized to a value of 100 at the end of the month in which the recession began.
Month 0 is the date of the NBER recession start. The S&P 500 is normalized to a value of 100 in month 0. Each panel is labeled with the recession start month. (QuantStreet)
As the figure makes clear, there were four recessions where, 24 months after the recession start date, the S&P 500 fell in price (one of these was the Great Depression). There were 11 cases where a recession started and the S&P 500 finished at a higher price level (and often much higher) 24 months later. So the record of how bad recessions are for stock market returns is decidedly mixed. They are certainly not all bad.
A quick note on terminology: The x-axis in the figure is labeled from -24 (24 months before the recession started) to +24 (24 months after the recession started). This [-24, -23, …, 23, 24] labeling is called event time to differentiate it from calendar time which is how we often look at stock prices.
The next figure shows what happens when the 15 above charts are averaged. Think of this as the average S&P 500 performance in the 24 months before and after the start of an NBER recession. As before, the x-axis of the figure is measured in event time and the S&P 500 is normalized to a value of 100 in month 0 (the start of the recession).
The blue shaded region shows the confidence interval around the average S&P 500 performance estimate. (QuantStreet)
On average, the stock market performs well headed into a recession, then has a difficult six months or so once the recession starts, and begins to do well again starting in about month 6 after the onset of the recession. The blue shaded region around the average stock market performance line indicates the confidence interval around the return estimate. The wider the band, the less certainty there is around the average outcome.
One contributor to this uncertainty is the inclusion of the Great Depression in the analysis. Excluding this episode, as the next figure does, makes the average stock return following recession start dates even better, and the amount of uncertainty over this average outcome also drops.
This chart excludes the Great Depression episode from the analysis. The blue shaded region shows the confidence interval around the average S&P 500 performance estimate. (QuantStreet)
To summarize: Once an NBER recession begins, stocks on average go up by just under 20% over the following two years, and this number increases to over 20% if you exclude the Great Depression from the analysis.
Are we already in a recession?
The key to connecting this historical analysis to today is to understand where the NBER recession start date would actually be, if the NBER ultimately decides to label the current time period a recession. To get a sense of this dynamic, the next figure shows the average performance of year-over-year growth in industrial production ((IP)) in the 24 months before and after an NBER-identified recession begins.
Month 0 is the NBER recession start month. The blue shaded region shows the confidence interval around the average year-over-year IP growth around NBER recession start dates. (QuantStreet)
The NBER identifies recession start dates at times when economic growth is still fine (on average, year-over-year IP growth at the start of a recession is just under 5%). IP growth subsequently slows, reaching a nadir of -10% year-over-year change in month 12 after the recession start, and then reaccelerates in the following 12 months. On average, year-over-year IP growth becomes positive in month 18 after the onset of a recession.
An important consideration is that the NBER identifies recession start dates only after the fact. They don't tell you in real time that a recession has started. To connect the historical analysis to today, we therefore need to ask whether we are currently in a recession, or whether the oft-forecasted recession has yet to begin. The next chart shows the U.S. seasonally adjusted IP series (in levels, not in changes) normalized to a value of 100 in 2017.
Bloomberg
It's a little hard to see, but the peak (of 103.53) in IP in this cycle was reached in September of 2022. Under the interpretation that we are now in a recession, this date might be selected as the after-the-fact NBER recession start date, in which case we are already seven months into the recession. If that is the case, then:
-
Looking back at the first figure suggests we are now at the point in an economic recession where stocks begin to go up on average.
-
Looking back at the year-over-year IP growth figure suggests that, if the historical average scenario plays out, IP will bottom out in another five months, before growth resumes.
Of course, it is possible that we are not in a recession at all, and that IP will continue to grow off its December 2022 trough.
Takeaways for investors
This article is not taking a stand on whether or not we will have a recession. The point is that, if we will have a recession, we are likely already seven months into it, in which case stocks ought to do well going forward, if the historical patterns hold. If we are not in a recession, then the concern about stocks falling because we're in a recession does not apply. Either way, the argument about an imminent fall in stocks because of a predicted recession is not consistent with the historical precedent and the current economic situation.
As always, investors should carefully consider their own risk preferences and liquidity needs when constructing their personal portfolios.
For further details see:
Recessions Often Aren't Bad For Stocks