SEIC - REGL: A Dividend Growth ETF Beating Its Peers In 2022
Summary
- REGL is an equal-weight mid-cap dividend-growth ETF.
- Its top 3 sectors are financials, industrials and utilities.
- Valuation and quality metrics are average, and so is total return relative to competitors.
- However, its volatility is quite low and the dividend growth rate is excellent.
- It has outperformed several popular dividend-growth ETFs in 2022.
This dividend ETF article series aims at evaluating products regarding the relative past performance of their strategies and quality metrics of their current portfolios. As holdings and weights change over time, updates are posted when necessary.
REGL strategy and portfolio
The S&P Midcap 400 Dividend Aristocrats ETF ( REGL ) has been tracking the S&P MidCap 400 Dividend Aristocrats Index since 2/03/2015. It has 46 holdings, a distribution yield of 2.36% and a total expense ratios of 0.40%. Distributions are paid quarterly.
As described by ProShares in the prospectus, eligible companies must be in the S&P Midcap 400 index and have increased dividend payments every year for at least 15 years. The Index contains a minimum of 40 stocks which are equally weighted with a limit of 30% for any sector. If fewer than 40 stocks pass the rules, companies with shorter dividend growth histories will be included. The Index is reconstituted once a year and rebalanced quarterly.
The fund invests exclusively in U.S. based companies, 42% in mid-caps and 58% in small caps (in Fidelity classification). The heaviest sector is financials (26.3%), followed by industrials (20.5%) and utilities (20.2%). Other sectors are below 13%. Compared to the parent index and mid-cap benchmark S&P 400 ( MDY , IJH , IVOO , SPMD ), REGL overweights financials, utilities, materials and consumer staples. It underweights consumer discretionary, healthcare, real estate, and ignores energy and technology.
Sector breakdown ( chart: author; data: ProShares)
The top 10 holdings, listed below, weigh 24.6% of asset value. There is no position weighting more than 3%, so risks related to individual companies are low.
| Ticker |
| Name |
| Weight |
| EPS growth %TTM |
| P/E TTM |
| P/E fwd |
| Yield% |
| RenaissanceRe Holdings Ltd. |
| 2.71% |
| -1137.26 |
| N/A |
| 31.64 |
| 0.76 |
| Royal Gold, Inc. |
| 2.65% |
| N/A |
| N/A |
| 37.74 |
| 1.18 |
| SEI Investments Co. |
| 2.50% |
| 0.02 |
| 16.87 |
| 18.20 |
| 1.40 |
| UGI Corp. |
| 2.49% |
| -28.30 |
| 8.36 |
| 13.63 |
| 3.47 |
| Ryder System, Inc. |
| 2.43% |
| 138.65 |
| 5.61 |
| 5.67 |
| 2.74 |
| New Jersey Resources Corp. |
| 2.39% |
| 133.83 |
| 17.95 |
| 20.53 |
| 3.05 |
| Sensient Technologies Corp. |
| 2.37% |
| 19.45 |
| 23.77 |
| 23.61 |
| 2.09 |
| National Retail Properties, Inc. |
| 2.35% |
| 20.04 |
| 27.36 |
| 25.84 |
| 4.58 |
| Black Hills Corp. |
| 2.34% |
| 2.96 |
| 18.39 |
| 18.14 |
| 3.42 |
| Essential Utilities, Inc. |
| 2.34% |
| 8.74 |
| 27.54 |
| 27.41 |
| 2.34 |
Performance
Since inception in February 2015, REGL has outperformed the mid-cap benchmark in return and in risk-adjusted performance (Sharpe ratio).
| Tot. Return |
| Annual Return |
| Drawdown |
| Sharpe ratio |
| Volatility |
| REGL |
| 118.88% |
| 10.39% |
| -36.37% |
| 0.63 |
| 15.24% |
| S&P MidCap 400 |
| 95.80% |
| 8.85% |
| -42.18% |
| 0.45 |
| 18.79% |
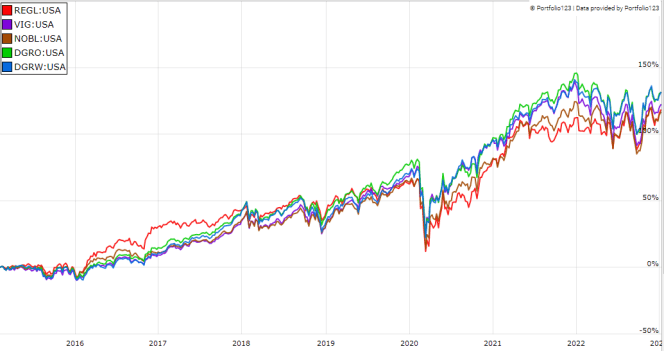
The next chart compares REGL since inception with some popular dividend-growth ETFs, which are more oriented to large cap stocks. It is in the bottom of the pack, but very close to NOBL and VIG.
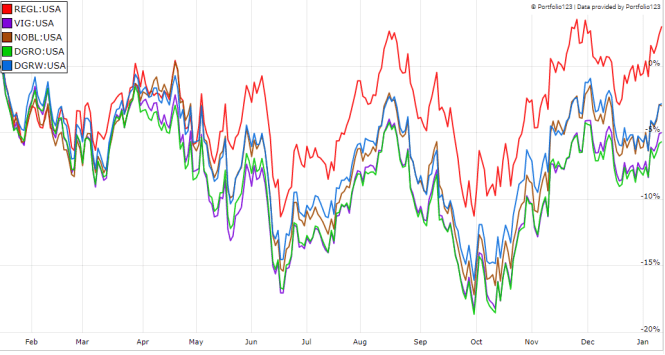
However, it has beaten its peers by over 5 percentage points in the last 12 months. It has even hit an all-time high in December.
The sum of annual distributions has increased from $0.65 to $1.66 per share between 2015 and 2022. The annualized dividend growth rate on this period is 14.3%, which is excellent. As a reference, the Vanguard Dividend Appreciation Index Fund ( VIG ), very popular among dividend-growth investors, shows an annualized dividend growth rate of 7.3% in the same time.
Comparing REGL with a reference strategy based on dividend and quality
In previous articles, I have shown how three factors may help cut the risk in a dividend portfolio: Return on Assets , Piotroski F-score , and Altman Z-score .
The next table compares REGL since inception with a subset of the S&P 500: stocks with a dividend yield above the average of their respective indexes, an above-average ROA, a good Altman Z-score, a good Piotroski F-score and a sustainable payout ratio. It is rebalanced annually to make it comparable with a passive index.
| Tot. Return |
| Annual Return |
| Drawdown |
| Sharpe ratio |
| Volatility |
| REGL |
| 118.88% |
| 10.39% |
| -36.37% |
| 0.63 |
| 15.24% |
| Dividend quality subset |
| 122.32% |
| 10.61% |
| -36.33% |
| 0.61 |
| 16.48% |
Past performance is not a guarantee of future returns. Data Source: Portfolio123
REGL is close to my dividend quality benchmark, which is a good point for the fund. My core portfolio holds 14 stocks selected in this subset (more info at the end of this post).
Portfolio valuation and quality
REGL is slightly more expensive than its parent index regarding valuation ratios:
| REGL |
| MDY |
| Price/Earnings TTM |
| 15.97 |
| 13.5 |
| Price/Book |
| 2.21 |
| 2.31 |
| Price/Sales |
| 1.57 |
| 1.25 |
| Price/Cash Flow |
| 12.72 |
| 11 |
Data: Fidelity
REGL holds 46 stocks, of which 5 are risky regarding my metrics. In my portfolio reviews, risky stocks are companies with at least 2 red flags among: bad Piotroski score, negative ROA, unsustainable payout ratio, bad or dubious Altman Z-score, excluding financials and real estate where these metrics are unreliable. Here, risky stocks weigh 10.8% of asset value, which is acceptable.
According to my calculation of weighted quality metrics, the portfolio quality is similar to the benchmark (see next table). The aggregate ROA is a bit higher, while aggregate Altman and Piotroski scores are a bit lower.
| REGL |
| MDY |
| Atman Z-score |
| 2.75 |
| 3 |
| Piotroski F-score |
| 5.09 |
| 5.42 |
| ROA % TTM |
| 6.09 |
| 5.85 |
Takeaway
REGL implements a dividend-growth strategy in the S&P 400 mid-cap index. It holds at least 40 stocks (46 now) and follows an equal-weight methodology. It is overweight in financials (26%). The fund is a bit more expensive than its parent index regarding valuation metrics, and close to it in quality. It has outperformed the mid-cap benchmark since inception, and shows a lower risk measured in maximum drawdown and historical volatility. It is slightly behind other dividend growth ETFs in long-term return, but it has beaten them by a significant margin in 2022. Moreover, the annualized dividend growth rate is excellent. In summary, REGL is a good dividend growth fund for investors seeking diversification outside the large cap universe. It has two minor drawbacks: a heavy weight in financials, and a relatively low liquidity. For transparency, a dividend-oriented part of my equity investments is split between a passive ETF allocation (REGL is not part of it) and my actively managed Stability portfolio (14 stocks), disclosed and updated in Quantitative Risk & Value.
For further details see:
REGL: A Dividend Growth ETF Beating Its Peers In 2022