HIBL - Relative Performance Of Market-Cap Weighted And Equal-Weight S&P 500 Indexes
2023-05-29 04:12:57 ET
Summary
- Year-to-date, the return spread between the market-cap-weighted S&P 500 and its equal-weight counterpart is 10%.
- Some market participants view the outperformance of large caps as a sign of market weakness.
- Historically, market cap-weighting has outperformed during market rebounds and underperformed during bear markets.
- The wide fluctuations in relative performance between the market-cap weighted and equal-weight S&P 500 indexes are due to random market regime changes.
Year-to-date, the SPY ETF ( SPY ) is up 10.2%, but RSP, the equal-weight ETF ( RSP ) is up only 0.4%. The two ETFs moved closely together until March of this year but then diverged, with the SPY taking a significant lead while the RSP returns initially fell to negative territory and then consolidated with a small down drift.
Year-to-date relative performance of SPY and RSP ETFs (Price Action Lab Blog - Norgate Data)
Many posts on financial social media attributed the large divergence to market weakness and performance driven by a few mega-caps.
However, market-cap weighting has historically outperformed during market rebounds and underperformed during bear markets. This is shown in the chart below.
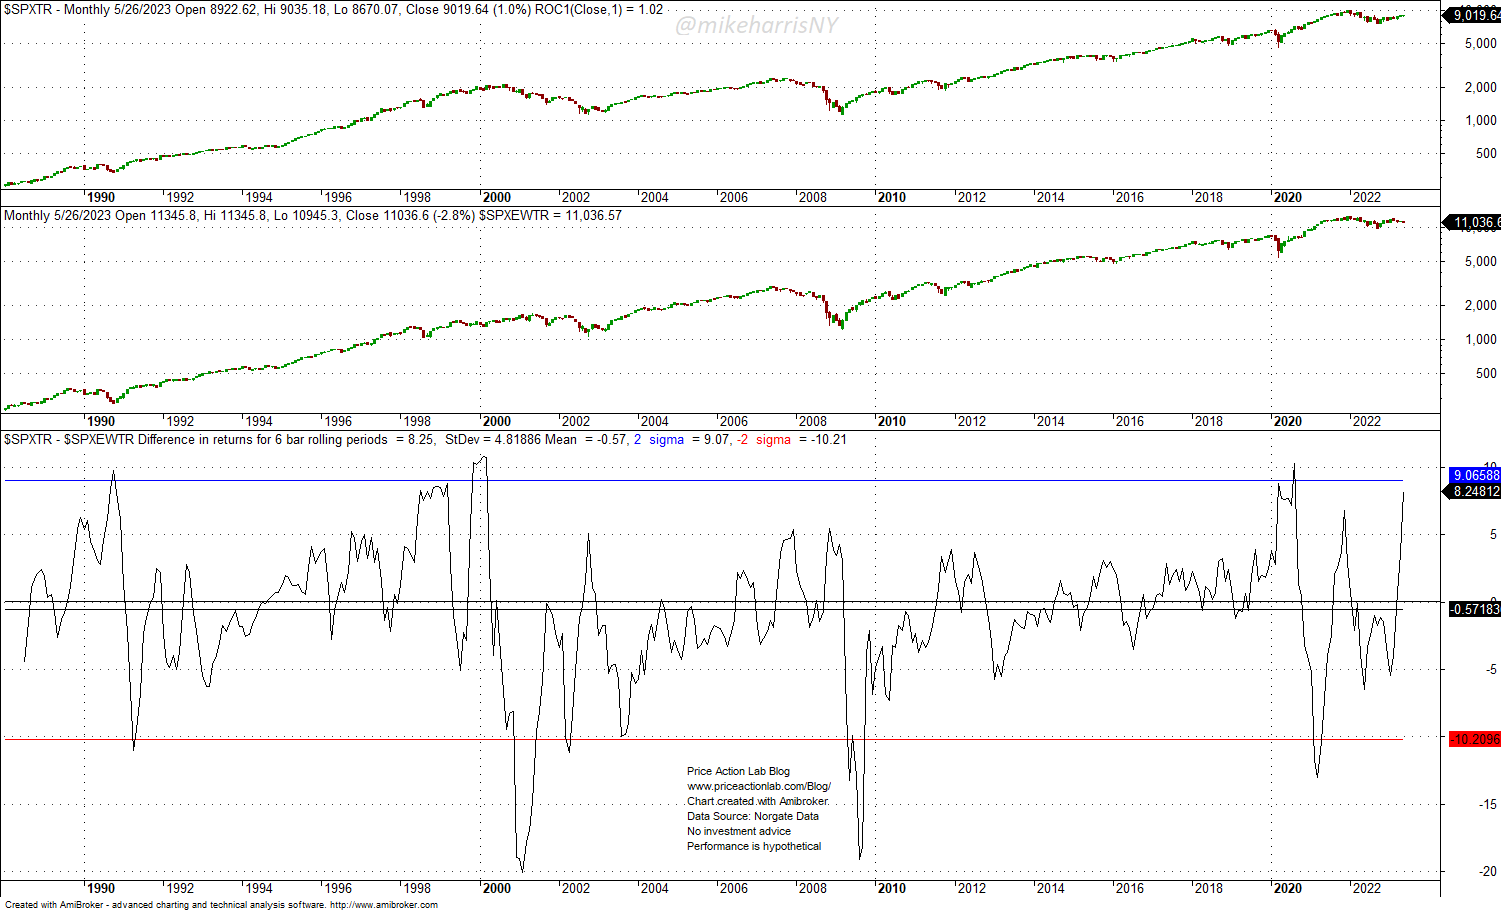
S&P 500 and S&P 500 equal-weight total return indexes since 1988 (Price Action Lab Blog - Norgate Data)
The top chart is for the S&P 500 total return; the next chart is for the S&P 500 equal-weight total return; and the bottom chart shows the rolling difference of the 6-month returns of the two indexes.
The current value (as of the close of May 26, 2023) of the difference of 6-month returns is 8.2%. The average since 1988 is -0.6%, but the standard deviation is large and equal to 4.8%. The data tell us that there has been a large dispersion in the spread, which is also evident from the chart.
Specifically, toward the top of the 1990s bull market, the spread rose above two standard deviations to nearly 11% in favor of the market cap-weighted index. Then, in February 2001, the spread dropped to -20% and was hugely in favor of the equal-weight index. Then, again near the top of 2007, the spread increased to 5.4% in favor of market cap-weighted but then dropped to about -19% by August 2009. As the market rebounded after the GFC, the spread became positive again in favor of the market cap-weighted.
After the rebound from the 2020 pandemic crash, the spread rose again to 10.3%, above the two standard deviations in favor of large caps. Then, it dropped to about -13% in favor of equal weight by March 2021. The recent rebound in the spread in favor of market cap-weighted came after wide fluctuations. It may be seen that the relative moves are driven not only by market regimes but also by randomness.
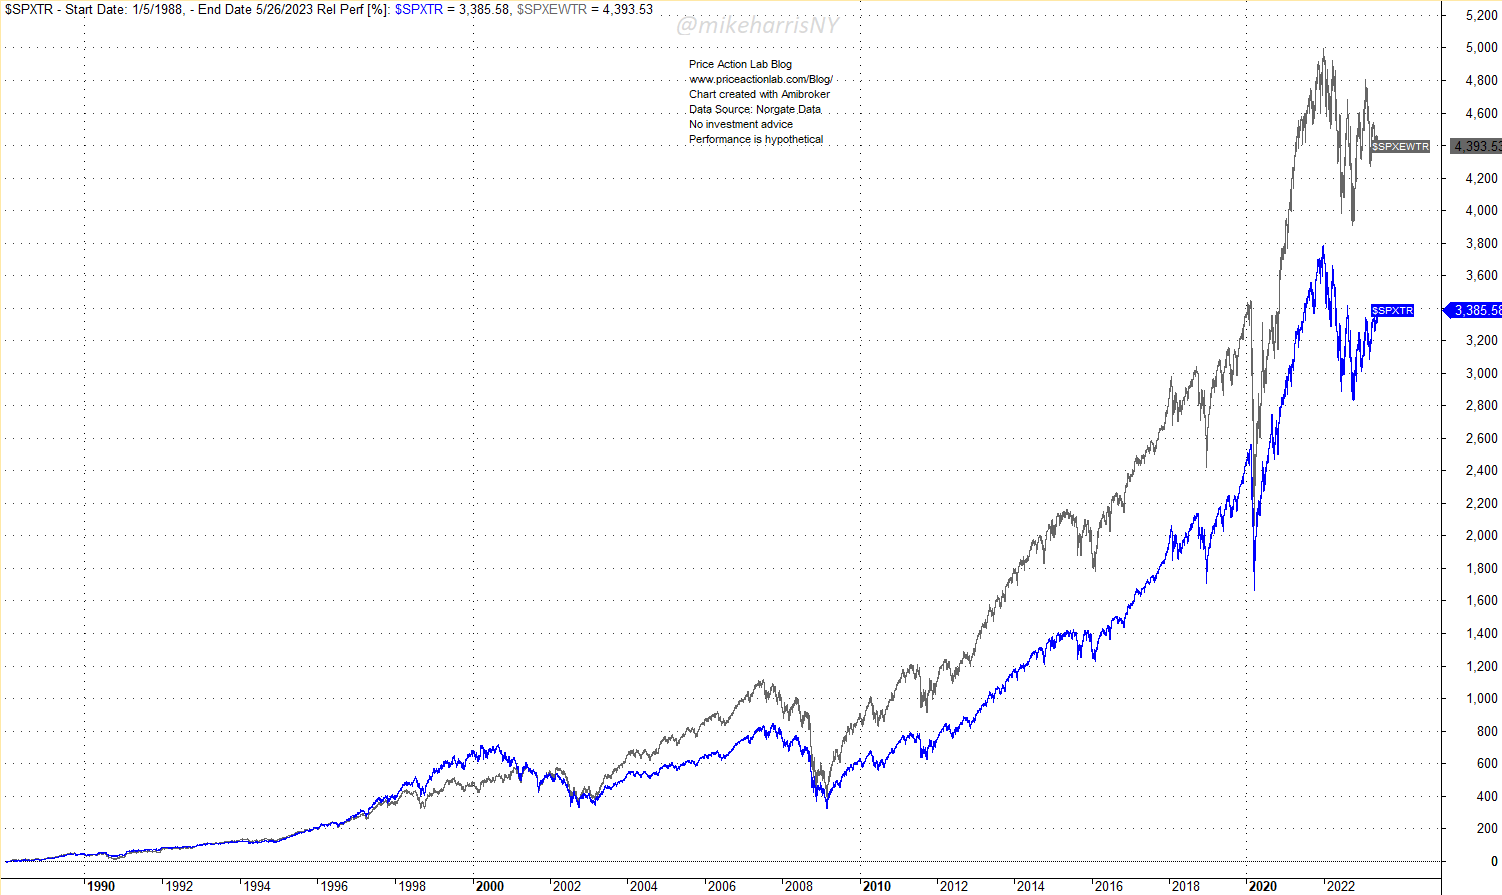
Since 1998, the S&P 500 equal-weight total return has been about 1000% higher than that of the S&P 500 total return.
Relative performance of S&P 500 and S&P 500 equal-weight total return indexes since 1988 (Price Action Lab Blog - Norgate Data)
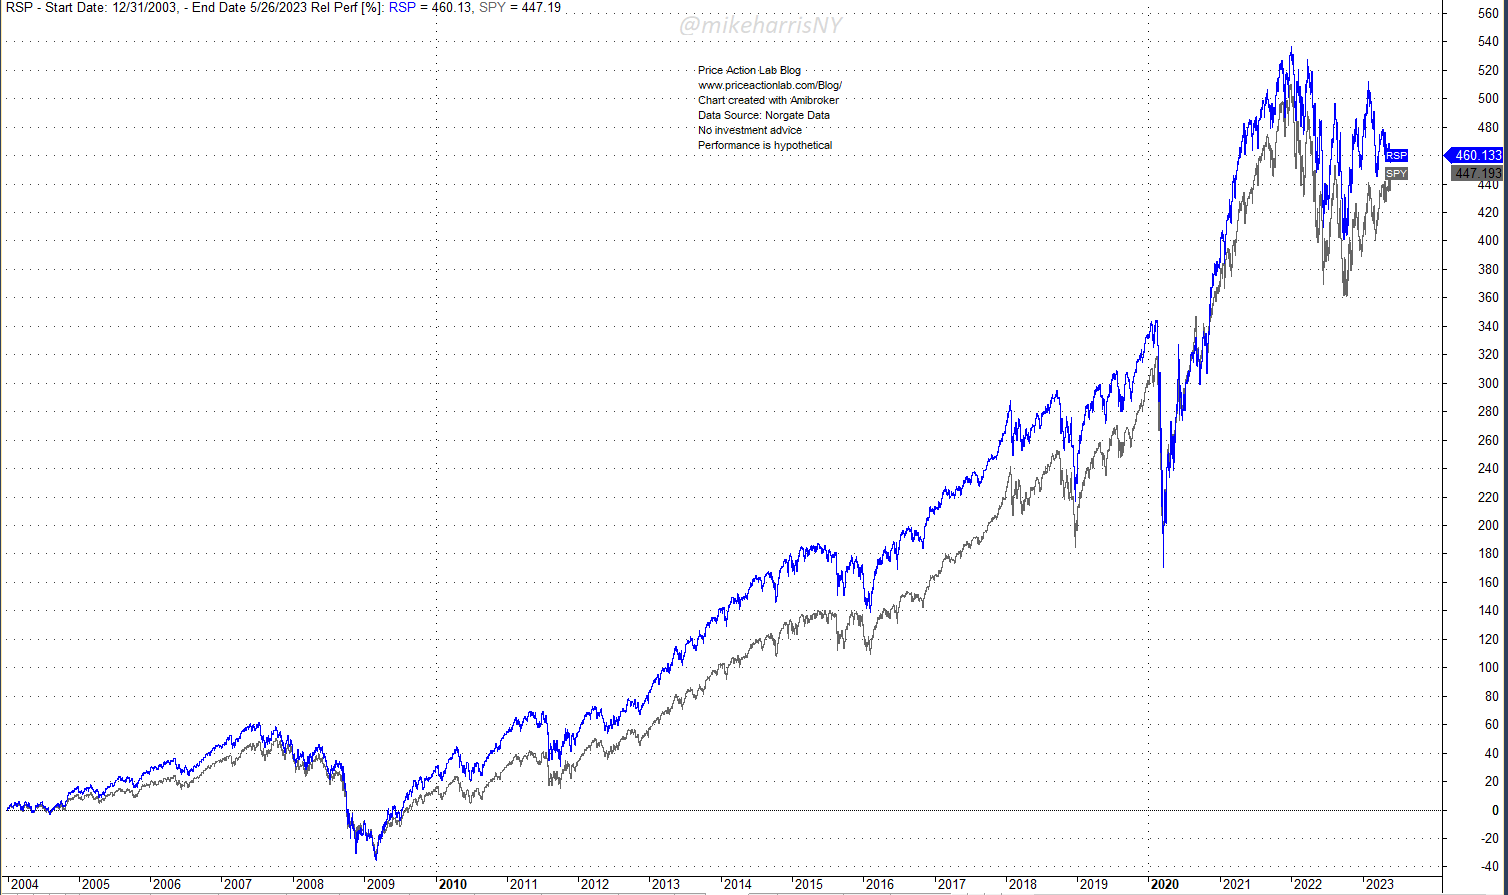
The relative performance depends on the starting date. For example, since 2004, the performance of the SPY and RSP ETFs has been about the same.
Relative performance of SPY and RSP ETFs since 2004 (Price Action Lab Blog - Norgate Data)
The relative performance of market cap-weighted and equal-weight indexes is bound to vary widely due to changing market regimes and conditions. Investors should not be surprised that a few mega-cap stocks sometimes lead. Those are also the stocks that get hit hard during bear markets due to crowded trades. The effects are part of the boom and bust cycles of a stock market that has a strong long-term upward drift. Market timing is always important and can make the difference between mediocre and excellent returns.
Summary
We have shown that the relative performance of the market cap-weighted and equal-weight S&P 500 indexes is dynamic, regime-dependent, and can also be random. Investors should ignore the noise in the financial media about potential ominous conditions during those fluctuations. There is a tendency for exuberance and the creation of sensational content, but markets are dynamic and occasionally random. Long-term objectives and risk management count the most. Currently, we are in a regime where mega-caps are outperforming. There will be a regime change down the road when the relative performance reverses. In the long term, the differences may not matter much, although the timing of decisions can impact performance in the medium term.
For further details see:
Relative Performance Of Market-Cap Weighted And Equal-Weight S&P 500 Indexes