REZ - Residential Real Estate Cycle Analytics Suggests REIT Prices Likely Rebound Till 2024 Q3
2024-01-11 08:15:00 ET
Summary
- Based on residential real estate analytics, investors may expect a rebound in house prices.
- REIT space appears to be trading at a meaningful historical discount.
- Seemingly, Camden Property and Mid-America Apartment offer the greatest value amongst the largest.
- The iShares Residential and Multisector Real Estate ETF may be a good investment choice.
Introduction
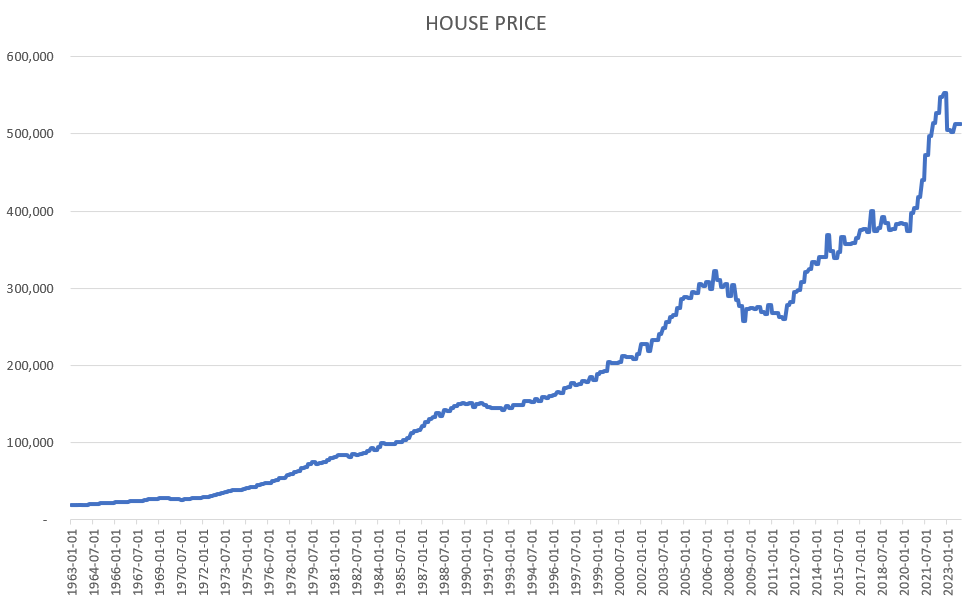
As it is well known, house prices skyrocketed in the past 60 years by 270%. Part of that enormous growth is general asset price inflation, however there are other factors impacting house prices too. Obviously, real estate is a rate sensitive asset class as a large portion of it is financed by mortgage debt. On the other hand, supply demand dynamics influence it's value, where the demand side is linked to general economic conditions as well.
AVERAGE HOUSE PRICE SOLD (FRED)
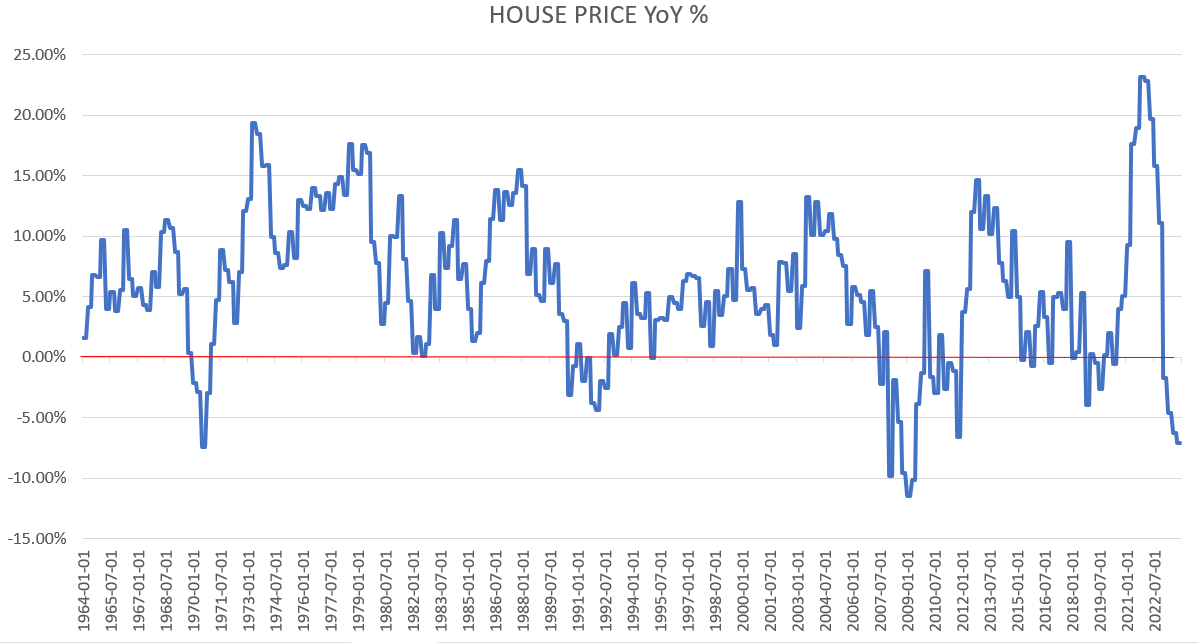
Home prices rarely go negative year-over-year, 2023 is being the 6th time in the past 60 years that it has happened, although after a gigantic 23% YoY rise in value in 2021 and still meaningful growth in 2022.
AVERAGE HOUSE PRICE SOLD YoY % (FRED)
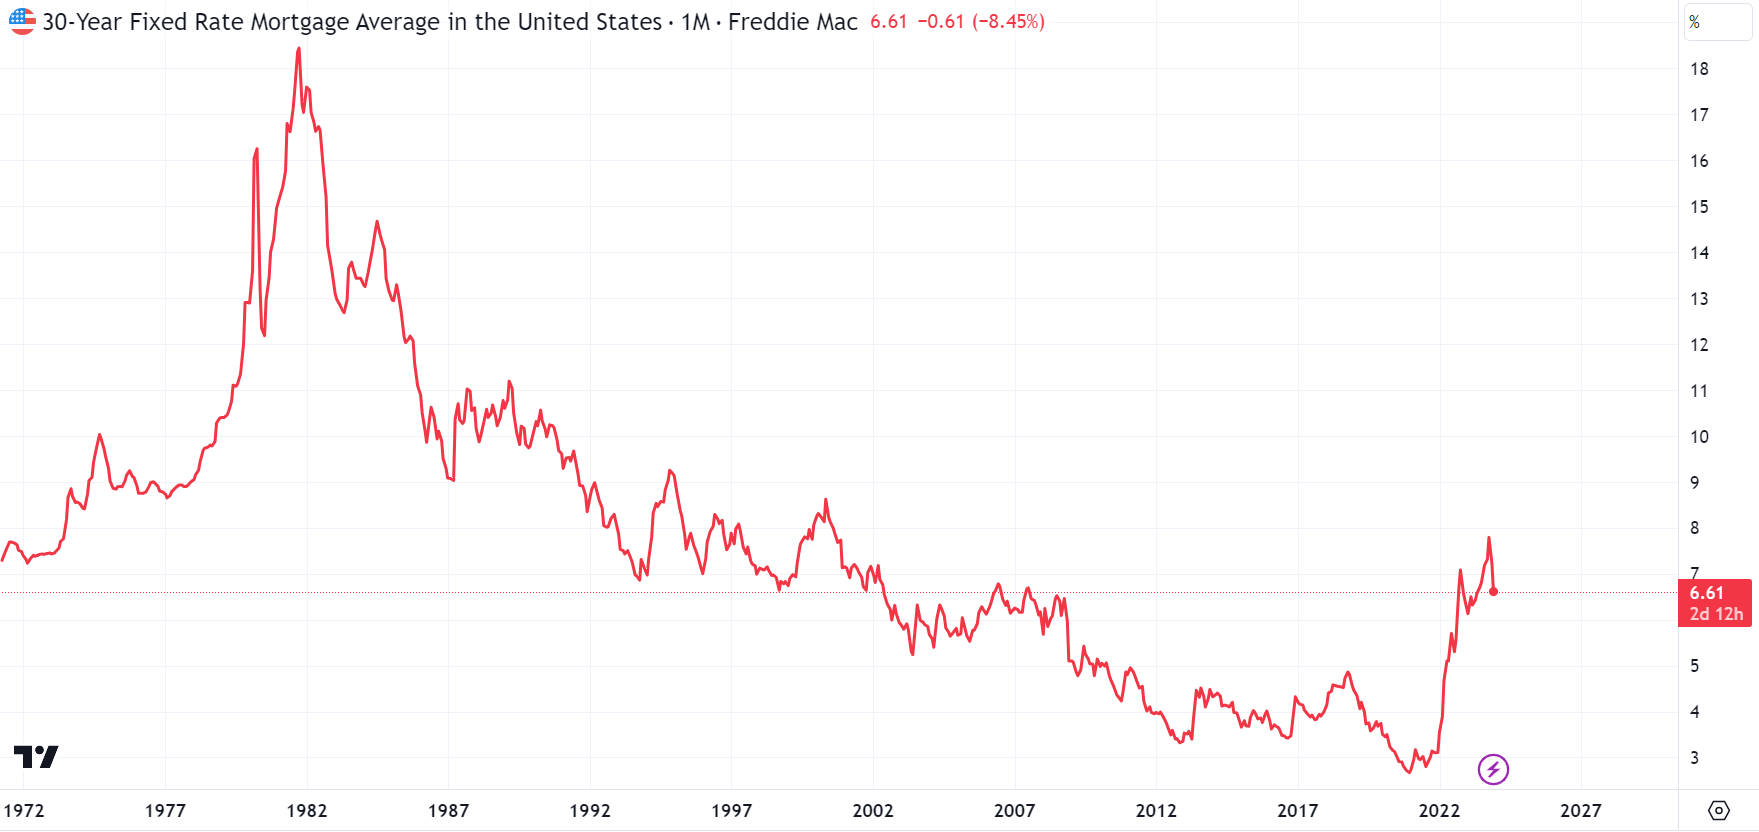
Due to the 40-year high inflation in 2022 and the central bank's response to it, mortgage rates skyrocketed to 23-year high levels. The 30-year mortgage rate reached 7.9% in 2023 October, matching the 2000 September levels.
30 YEAR FIXED RATE MORTGAGE RATE (TRADINGVIEW)
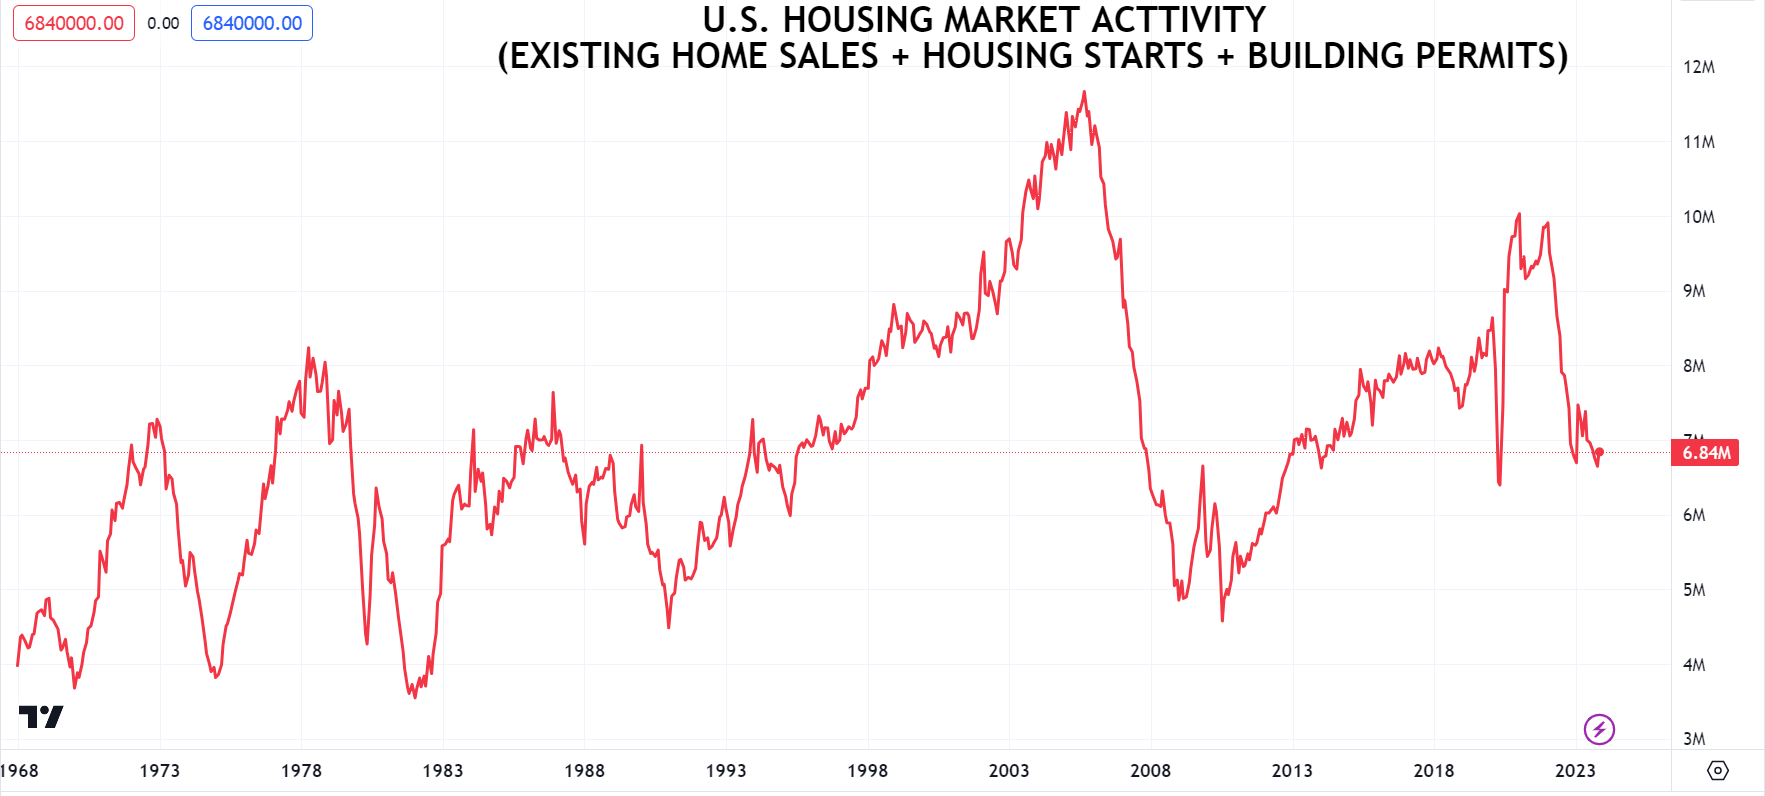
However, after the great financial crisis, the 30-year fixed mortgage became the largest share in financing, and shorter term or variable rate loans' share declined significantly in the U.S. As from the great financial crisis to the post pandemic 2021 interest rates ever declined, debtors could always refinance their loans at lower levels. Roughly 40% of residential real estate loans were refinanced during 2020-2021 and fixed at low rates. Consequently, the demand for new mortgages has tumbled since mortgage rates skyrocketed in 2022. As a result, housing market activity has collapsed to levels last seen in the depth of the pandemic or in 2013. On the other hand, very many home owners are unwilling to sell their property as than they would sacrifice their long term fixed low rate mortgage and take out a much higher rate loan instead with the new home. This caused a lack of available existing home sales and a significant housing shortage.
U.S. HOUSING MARKET ACTIVITY (TRADINGVIEW)
However, apparently since 2023 September, the shortage situation improved greatly and the supply of homes reached late 2021 levels (as a share of total inventory).
SUPPLY OF AVAILABLE HOMES SHARE OF TOTAL INVENTORY % (TRADINGVIEW)
Statistics
Supply Peak
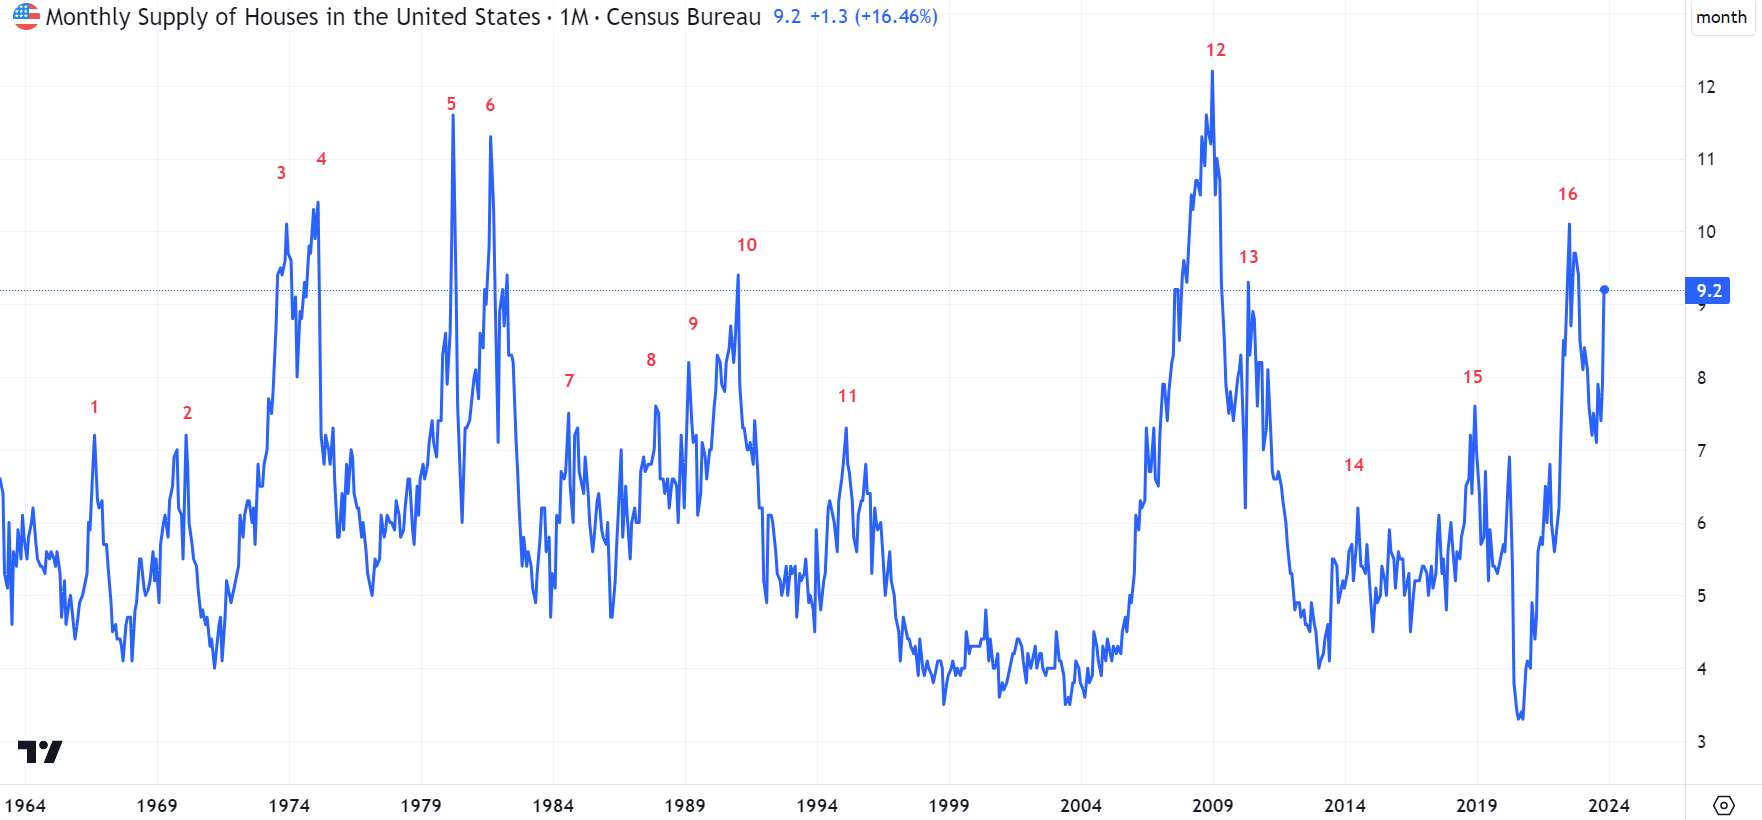
The months' supply is the ratio of new houses for sale to new houses sold. This statistic provides an indication of the size of the new for-sale inventory in relation to the number of new houses currently being sold. The months' supply indicates how long the current new for-sale inventory would last given the current sales rate if no additional new houses were built.
Intuitively, when the supply of available for sale houses reaches critical levels compared to the houses sold, it is an indication for an oversupplied market, which should be negative for house prices. As supply-demand dynamics play a critical role, historical house price changes are calculated by benchmarking it from the local peak in the months supply.
MONTHS SUPPLY OF HOUSES (TRADINGVIEW)
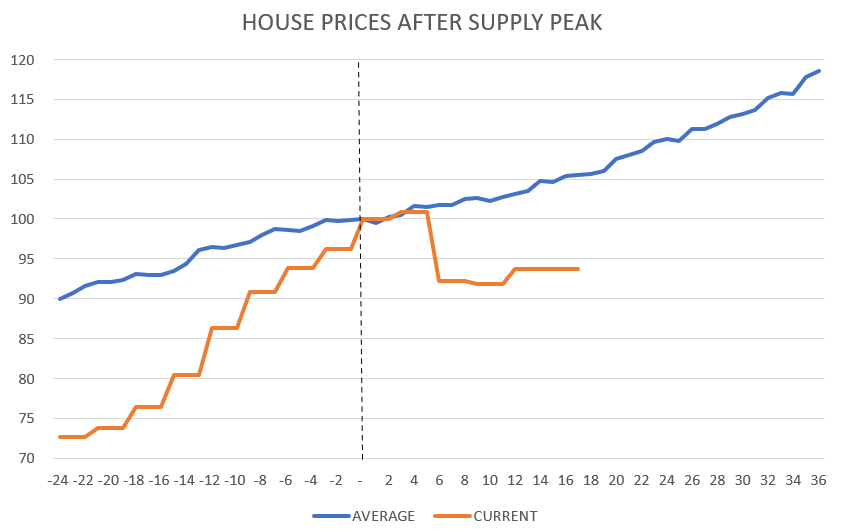
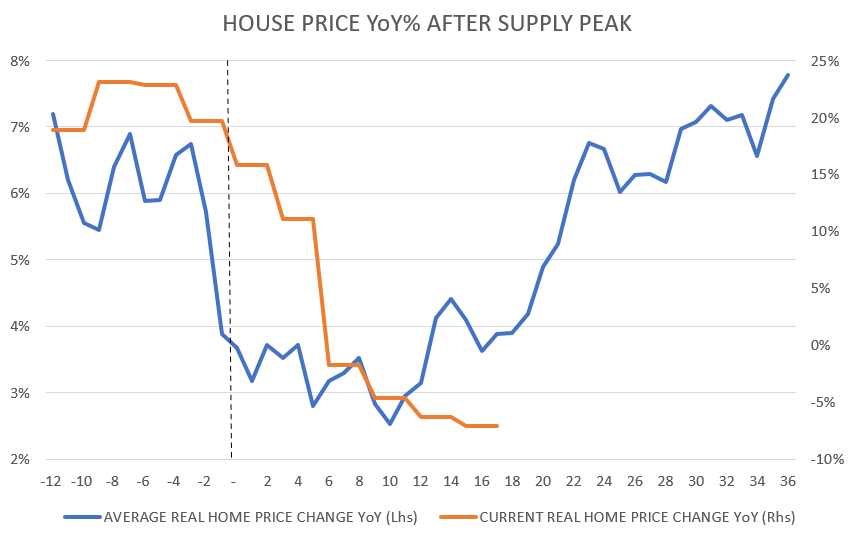
The data suggests, house prices on average grows positively both before and after the local supply peak. However, the annual rate of change starts decelerating sharply 3-month before the peak in supply and bottoms only 10 months after it. This is probably due to the market became oversupplied, and needs 10 months of normalization for the growth rate to rebound.
HOUSE PRICE INDEX AFTER SUPPLY PEAK (FRED) HOUSE PRICES YoY AFTER SUPPLY PEAK (FRED)
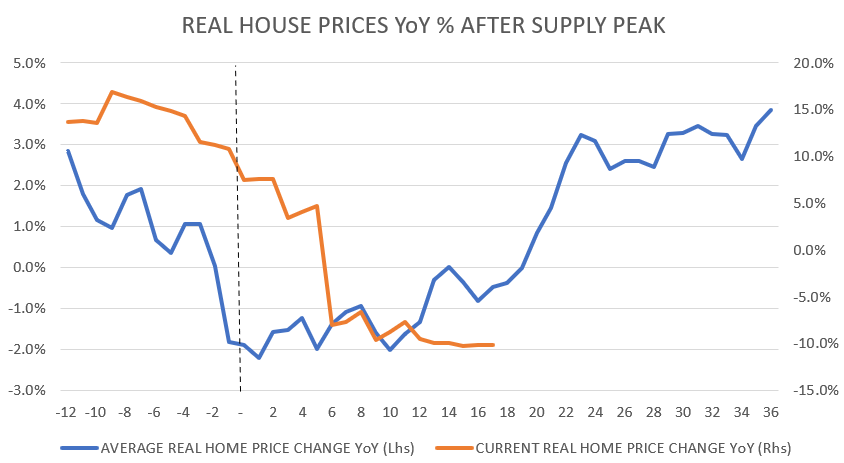
On the other hand, real house prices bottoms 1 month after the peak in supply, however only meaningfully rebounds 10 months after.
REAL HOUSE PRICES YoY AFTER SUPPLY PEAK (FRED)
Overall, the current cycle's growth rate tracks the historical average direction pretty closely, however with much greater volatility. Based on the historical data, the growth rate in residential real estate prices should have bottomed out and due for a substantial rebound.
10-Year Treasury Yield Peak
As real estate is a highly rate sensitive asset class, historical house price change was calculated by benchmarking it from the peak in the 10-year note yield. The data suggests, that house prices are nominally growing in positive range both before and after the peak in the 10-year yield, on average.
HOUSE PRICES INDEX AFTER SUPPLY PEAK (FRED)
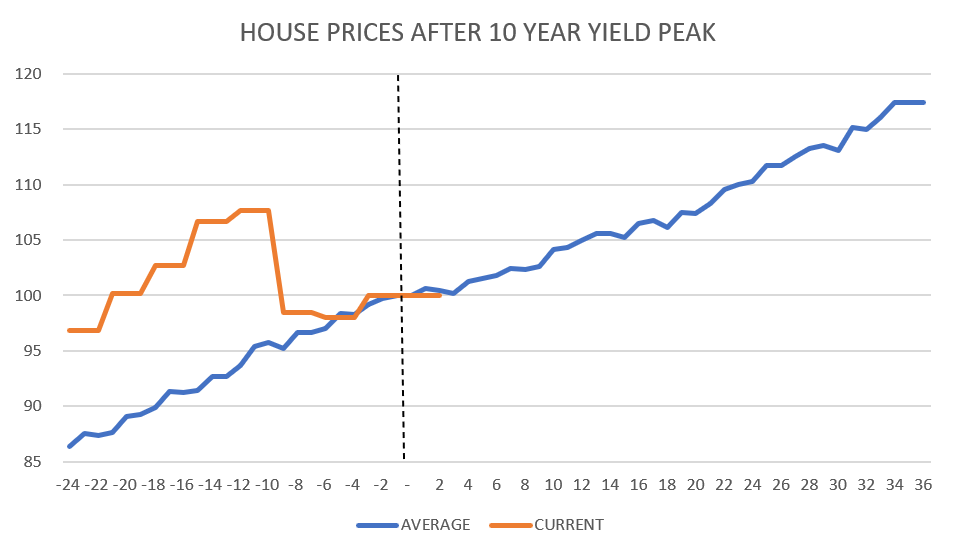
However, the annual growth rate on average peaks 11 months ahead of the peak in 10-year yield, while the bottom of the growth rate is 9 months after, on average. In the current cycle house price growth rate collapsed much faster than usually, probably due to the enormous 23% price growth in 2021. The 9 months lag in the growth rate in house prices compared to the 10-year UST is probably due to the delayed real economy effects of declining rates, or perhaps declining longer term yield signal worsening economical conditions where demand wanes.
HOUSE PRICES YoY AFTER SUPPLY PEAK (FRED)
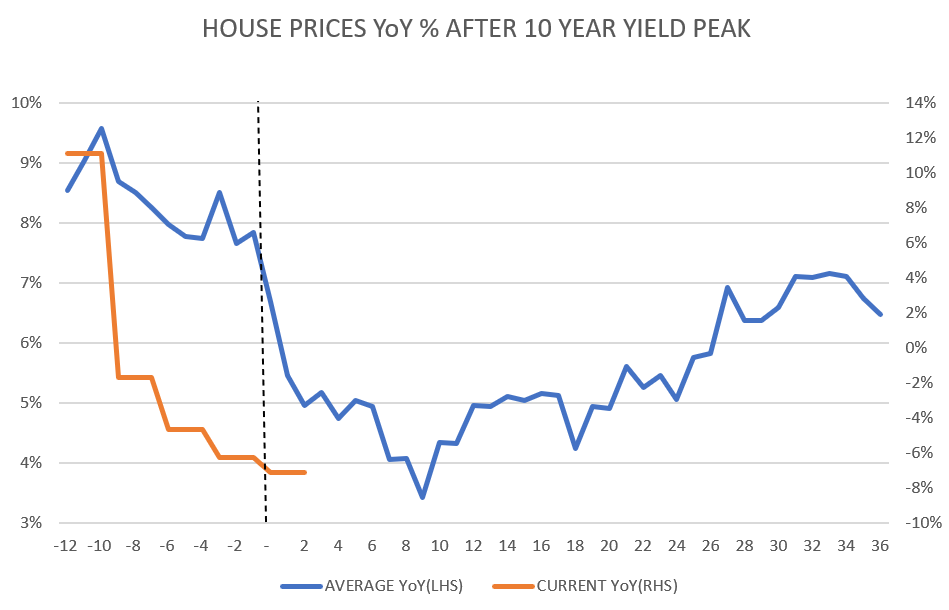
Adjusting for inflation, home prices turn negative real growth 1 month after the peak in the 10-year yield and stay in negative territory until 12 months after.
REAL HOUSE PRICES YoY AFTER SUPPLY PEAK (FRED)
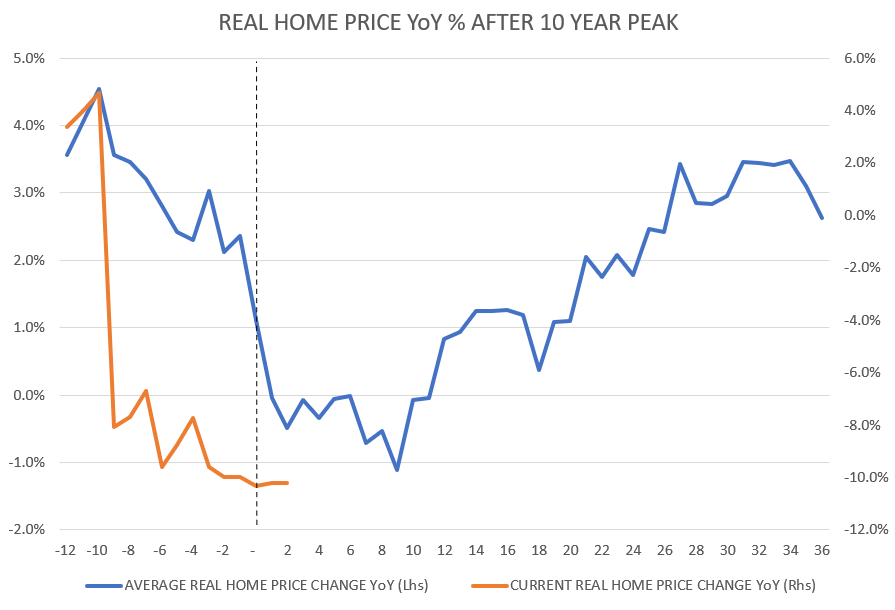
Based on the historical 10-year yield peak statistics, the growth rate should bottom out 9 months after the supposed peak 10-year yield in 2023.October. That suggests a bottom in growth rate in 2024 July, and positive real growth by 2024 October.
Cyclical Growth Peak
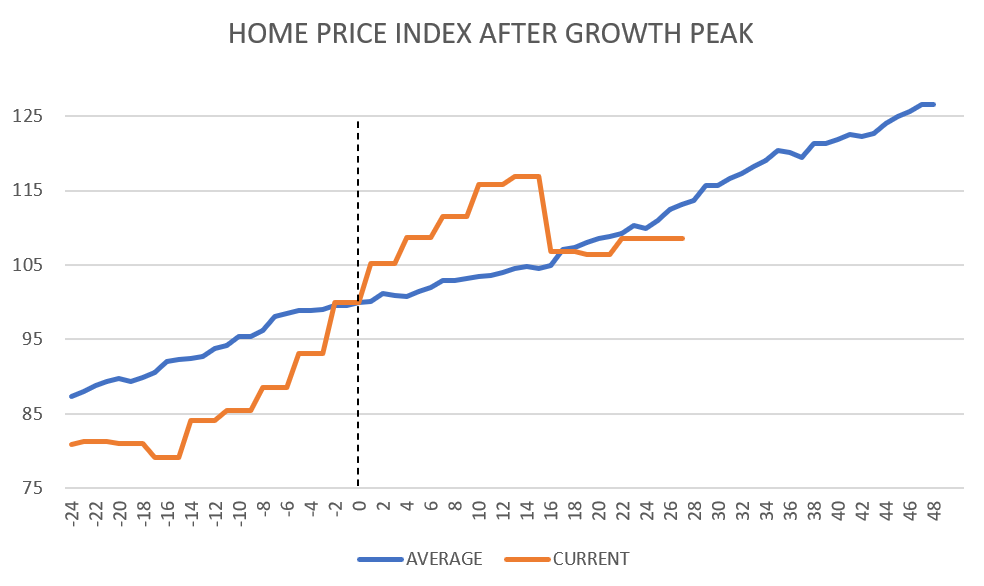
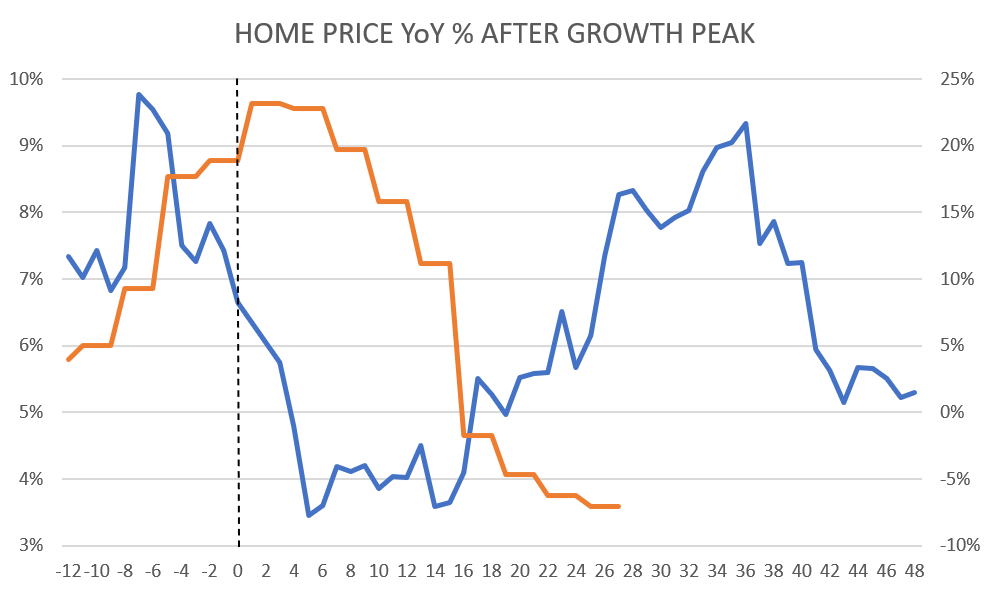
The most cyclical part of the economy is employment, consumer spending, consumption and production. As real estate demand is highly sensitive for growth trend in the economy, historical house price change was calculated by benchmarking it from the peak of cyclical growth.
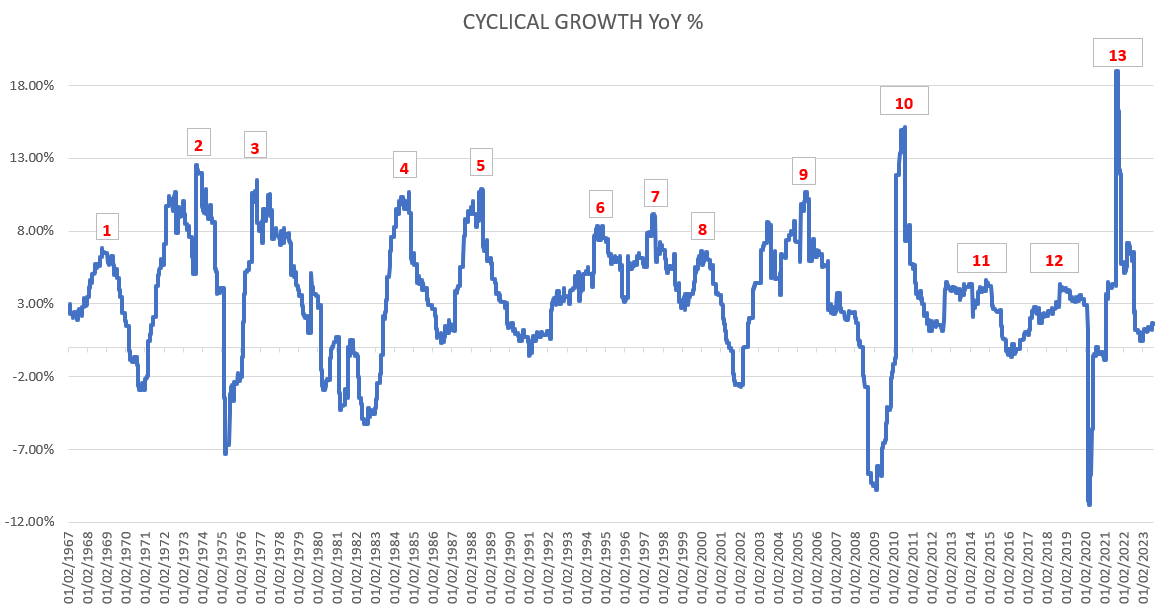
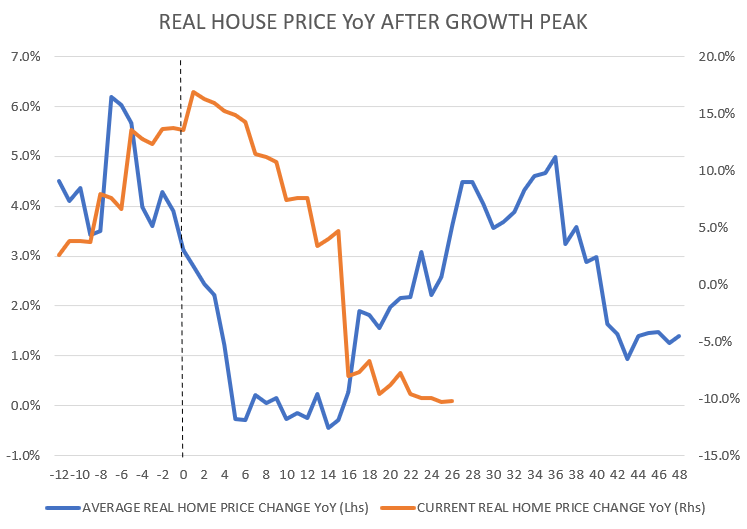
The data suggests, that nominal growth in house prices remains positive both 24 months prior and 48 months after the peak in cyclical growth. The growth rate starts falling 7 months prior to the peak in cyclical growth and bottoms out 5 months after. The growth rate starts rebounding meaningfully 14 months after the peak. Real house prices enters slightly negative growth rate 4 months after and contracts for 10 months before rebounding.
HOUSE PRICE INDEX AFTER CYCLICAL GROWTH PEAK (FRED) HOUSE PRICE YoY AFTER CYCLICAL GROWTH PEAK (FRED) REAL HOUSE PRICE INDEX AFTER CYCLICAL GROWTH PEAK (FRED)
The current cycle's growth rate tracks the historical average direction with a 10 months lag, which suggests the growth rate have been bottomed out and it is due for a meaningful acceleration.
10-Year / 3-Month Yield Curve Inversion
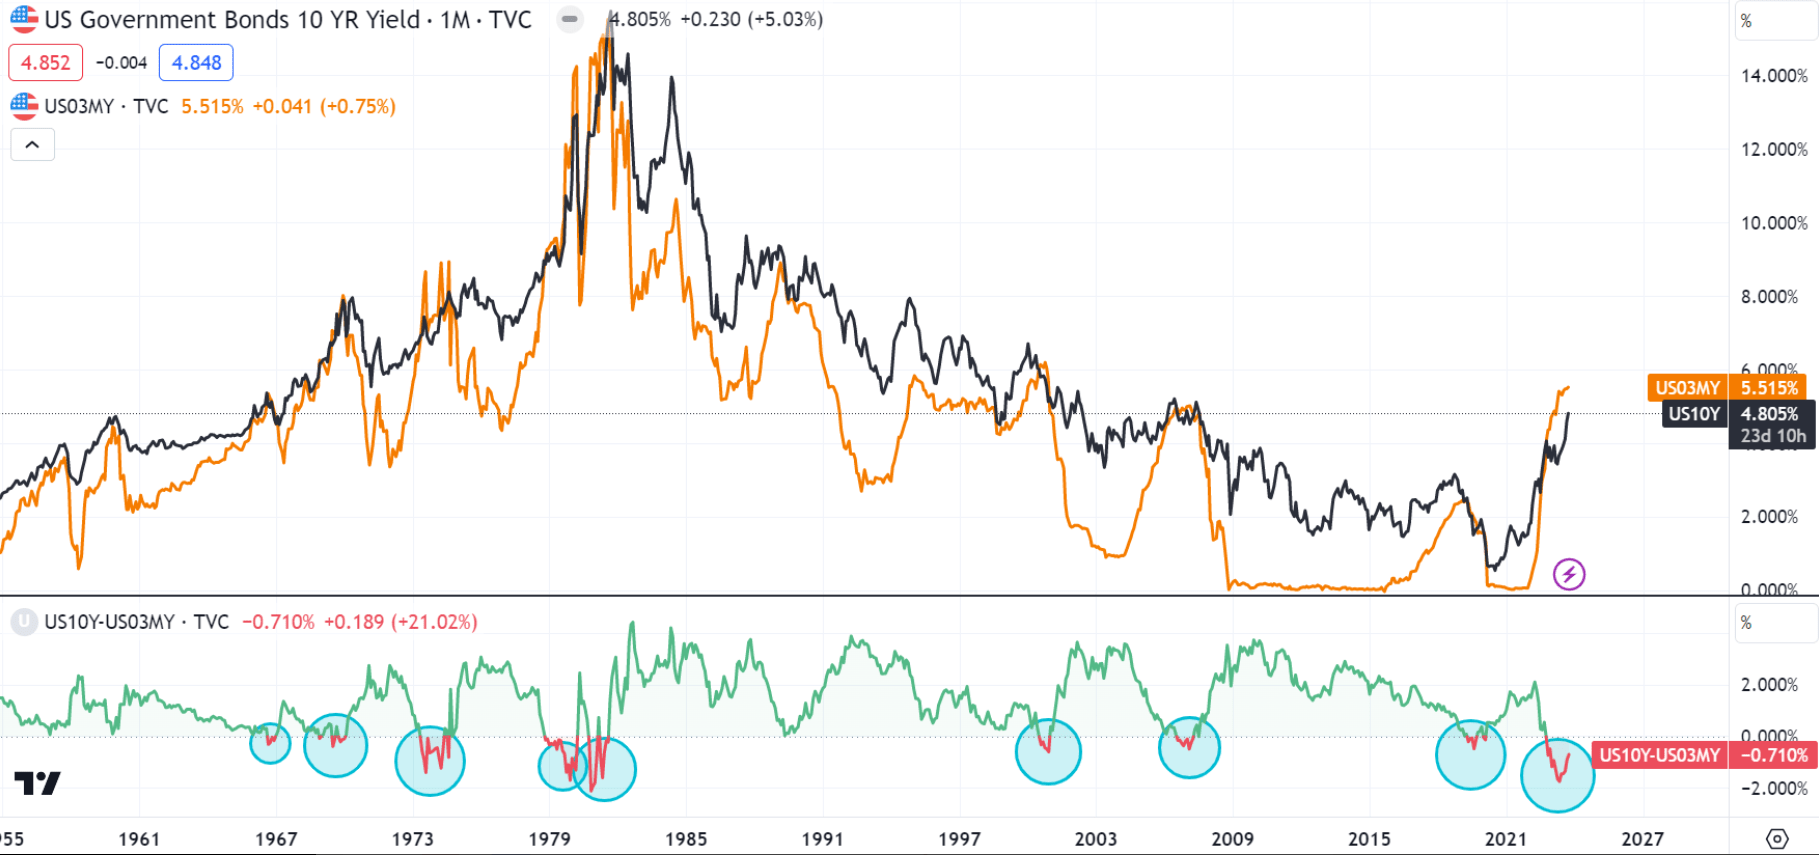
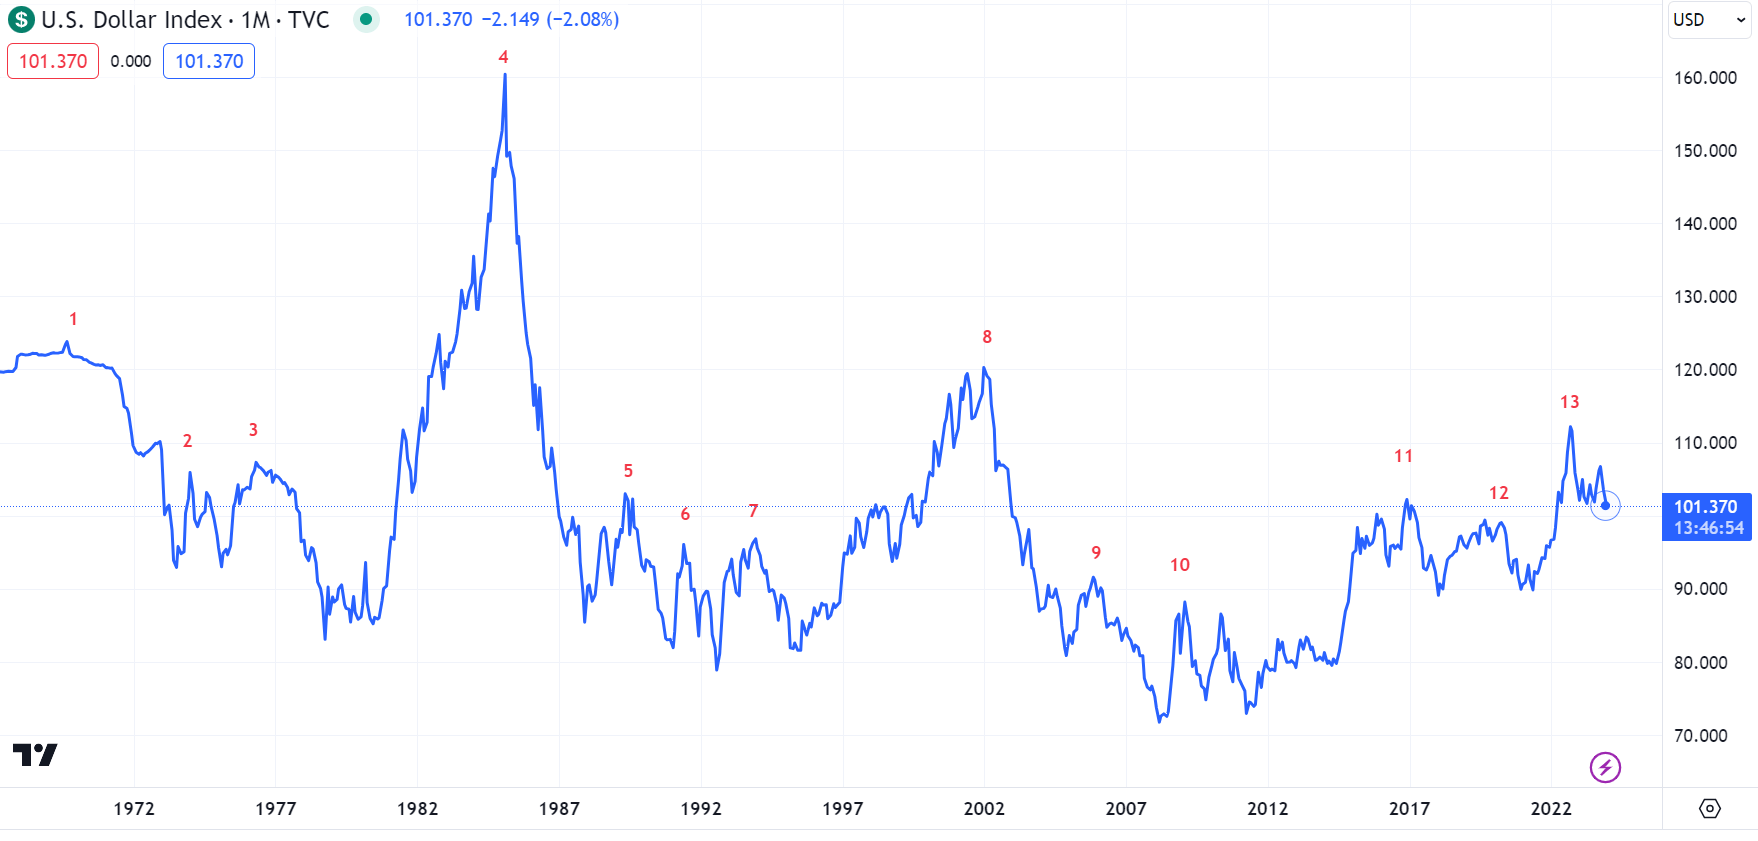
The 10-year and 3-month yield curve inversion has been one of the most reliable recession and financial turmoil indicator in the past decades, with above 90% predicting power. This part of the yield curve inverted in 2022 November, the 9th time this has happened in the post WWII area.
10-YEAR 3-MONTH YIELD CURVE INVERSION (TRADINGVIEW)
The same benchmarking was applied to the yield curve inversion point as well to observe changes in house prices. As it is visible, the growth before the inversion was much larger than usually, however the drop or correction after the yield curve inverts is unusual as well.
HOUSE PRICE INDEX AFTER 10YEAR 3MONTH YIELD CURVE INVERSION (FRED)
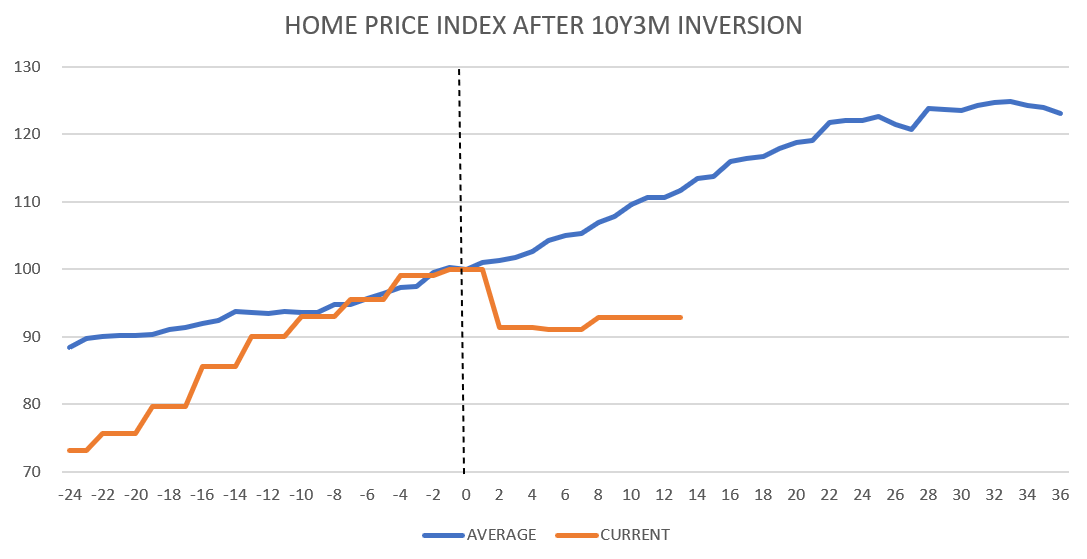
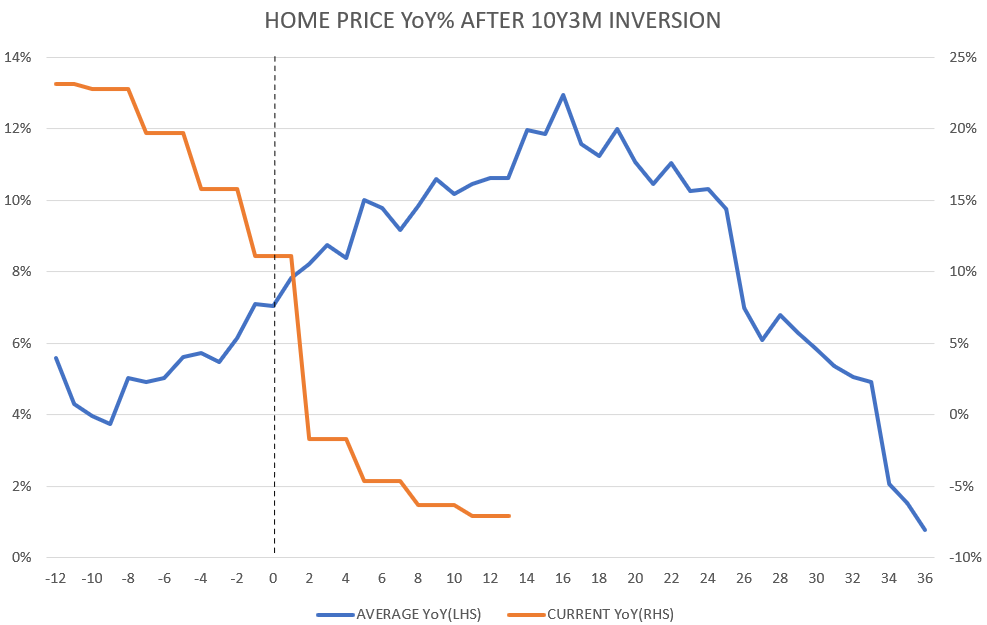
Historically, the growth rate of home prices are accelerating until 18 months after the inversion, and start decelerating towards 0% growth by 36 months after.
HOUSE PRICE YoY AFTER 10YEAR 3MONTH YIELD CURVE INVERSION (FRED)
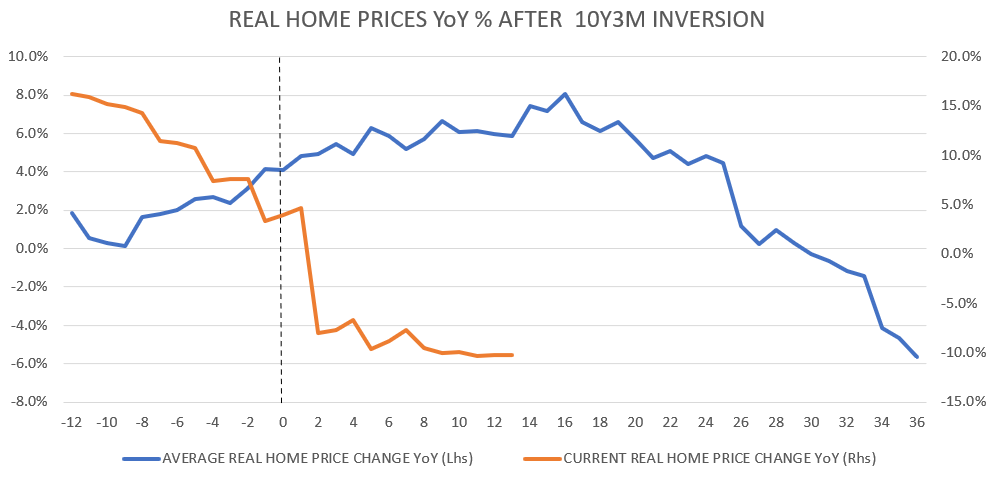
Inflation adjusted home price on average turns negative after 27 months of inversion, while in the current cycle it turned negative in the 2nd months. The deceleration is supposed to start after 16 months of the inversion, which would point to 2024 April.
REAL HOUSE PRICE YoY AFTER 10YEAR 3MONTH YIELD CURVE INVERSION (FRED)
Historically, after 16-18 months of the yield curve inversion, the economy and the financial system deteriorates which appears to be unfavourable for home prices. The same timing would point to 2024 April-June, and if the economy deteriorates it can cause further weakness in home price growth.
U.S. Dollar Peak
The U.S. Dollar being the world's reserve currency, plays a critical role in the global financial and economic cycle. A strengthening U.S. Dollar indicated tightening of financial conditions globally. Also being the denominator in asset prices, a stronger denominator should cause lower asset price growth rate.
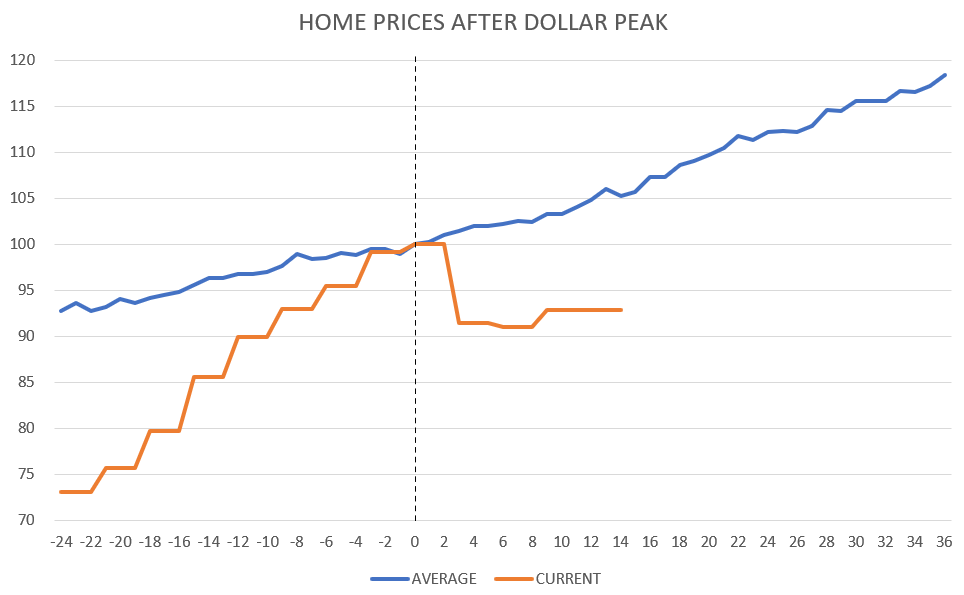
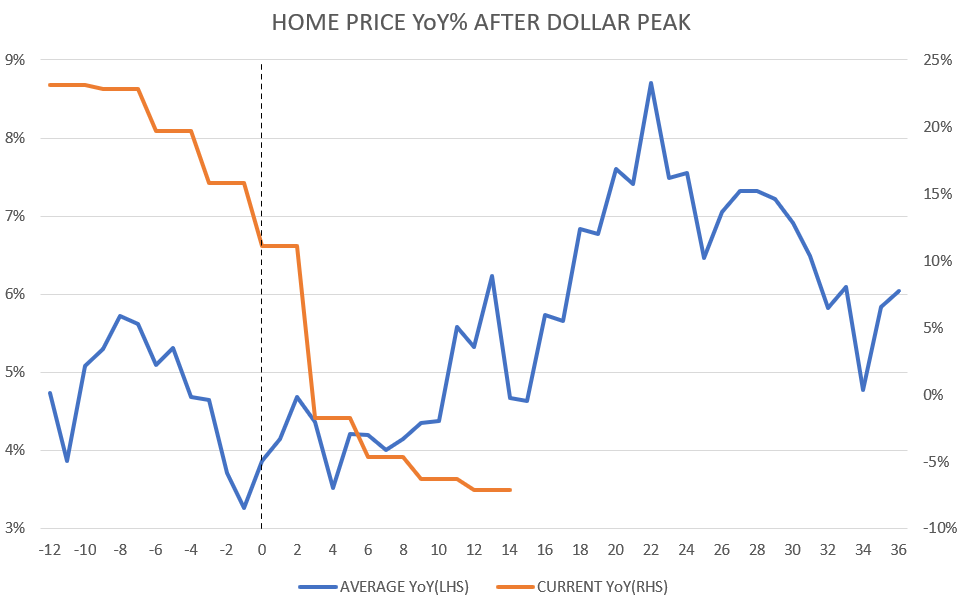
The data suggests, that nominal growth in house prices remains positive both 24 months prior and 36 months after the peak in the dollar. The growth rate starts falling 8 months prior to the peak in dollar and bottoms out 1 months prior. The growth rate starts rebounding meaningfully 4 months after the peak.
HOUSE PRICE INDEX AFTER DOLLAR PEAK (FRED) HOUSE PRICE YoY AFTER DOLLAR PEAK (FRED)
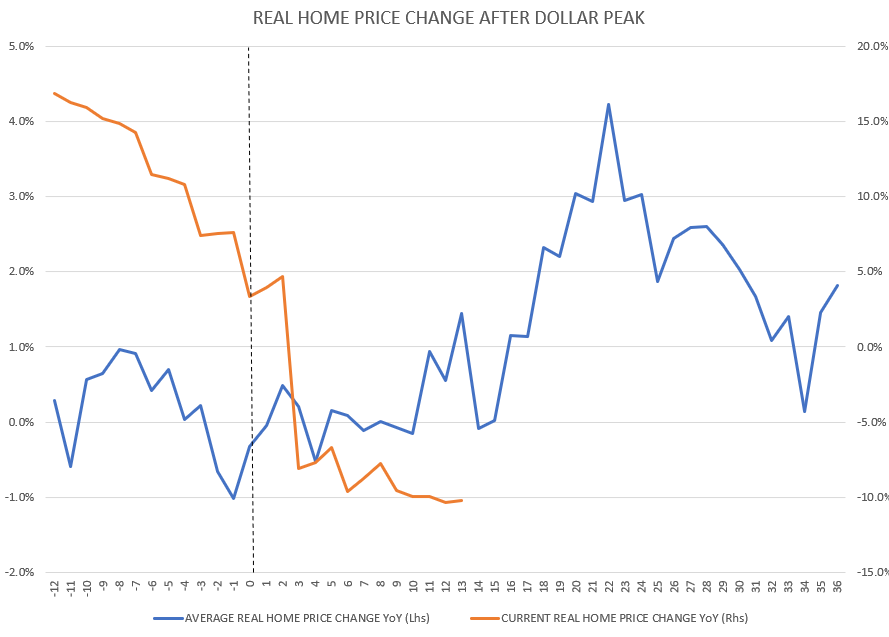
Real house prices enters contraction 3 months prior the peak and contracts for 2-3 months before rebounding.
REAL HOUSE PRICE YoY AFTER DOLLAR PEAK (FRED)
The current cycle's growth rate appears to have bottomed out 10 months after the peak in the dollar, which means it is lagging the historical average by 10-12 months. Based on the historical data, the growth rate in house prices have been bottomed out and is due for a significant acceleration.
Combined Model
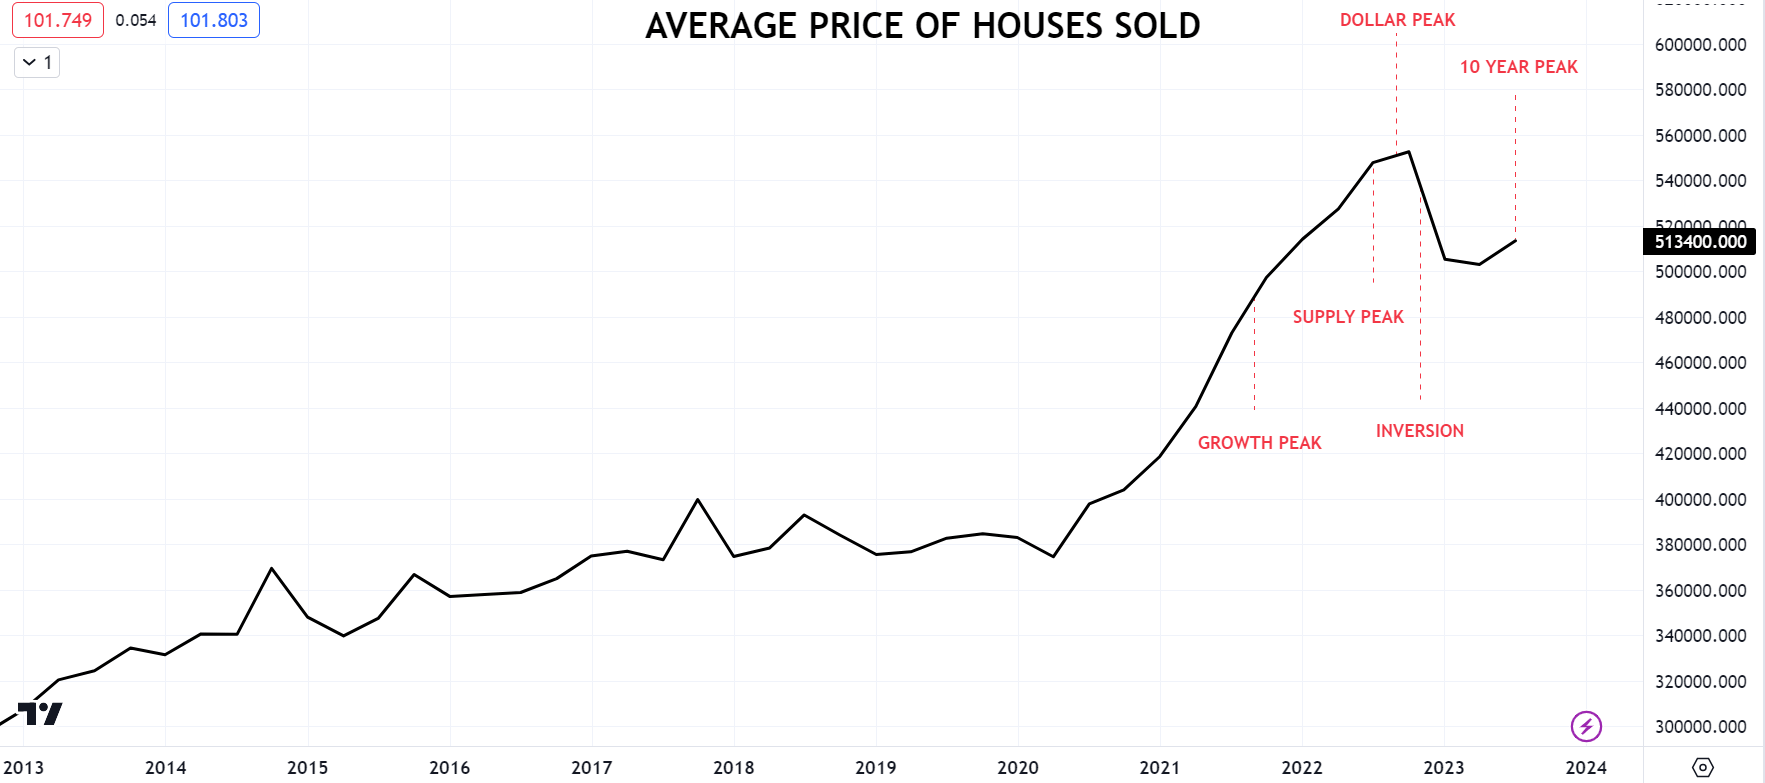
To attempt modeling the current environment, the historical average data after a growth peak, supply peak, dollar peak, yield curve inversion and the 10-year yield peak were merged into a combined model. The largest weight was allocated to the peak in the 10-year yield and supply (3x), middle weight to the peak in growth (2x) and the lowest for the yield curve inversion and dollar peak (1x).
AVERAGE PRICE OF HOUSE SOLD (TRADINGVIEW)
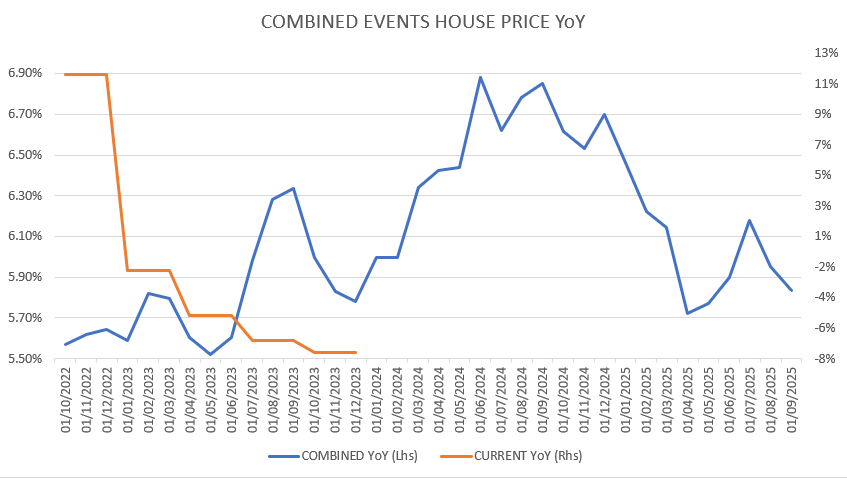
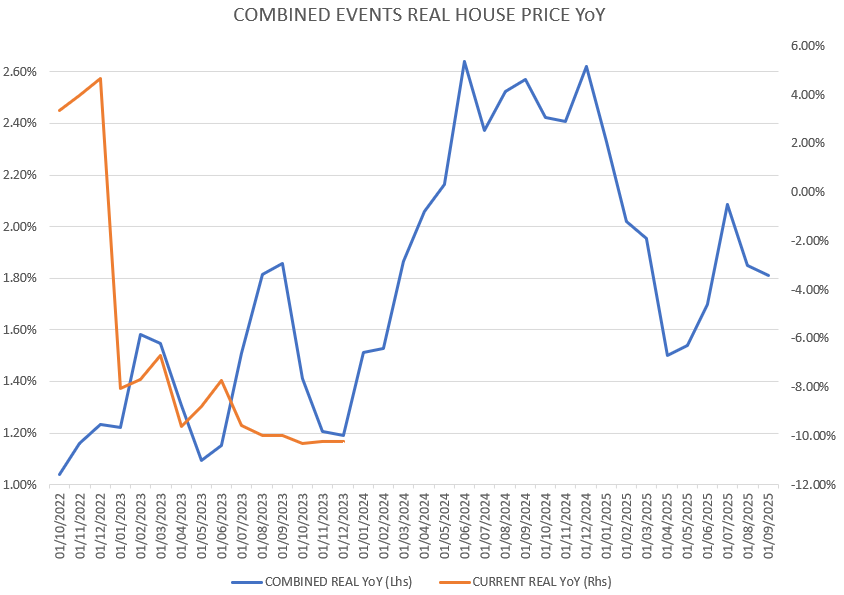
The combined model shows, based on the current circumstances house price growth should accelerate and peak around the summer of 2024. A deceleration should only start in Q3 of next year and last until Q1 of 2025. Apparently, the current cycle growth rate has somewhat disconnected from the historical average or lagging it. It is perhaps due to that the main driver was rising rates caused correction after the parabolic growth rate in 2021.
HOUSE PRICE COMBINED MODELL YoY% (FRED) REAL HOUSE PRICE COMBINED MODELL YoY% (FRED)
Overall, combining the macro and market events suggests house price growth rate is due to a meaningful rebound. Investors may note, that the negative growth rate was caused by sharply rising rates driven correction after a parabolic rise in the post pandemic world. As the i nversion analytics suggests , the peak in longer term rates supposedly was in October 2023, while pointing to the FED is expected to cut rates by Q2 2024. With declining treasury yields, consequently mortgage rates are expected to decline as well, therefore the primary headwind for house prices was probably cleared, while the base effect will be lower as well.
REIT Investment Strategy
Investors may consider capitalizing on the overall favorable conditions for residential real estate prices, by investing into residential real estate equity trusts. A real estate investment trust (REIT) is a company that owns, operates, or finances income-generating real estate. modeled after mutual funds, REITs pool the capital of numerous investors. This makes it possible for individual investors to earn dividends from real estate investments-without having to buy, manage, or finance any properties themselves. Most REITs are equity REITs, which own and manage income-producing real estate. Revenues are generated primarily through rents (not by reselling properties)
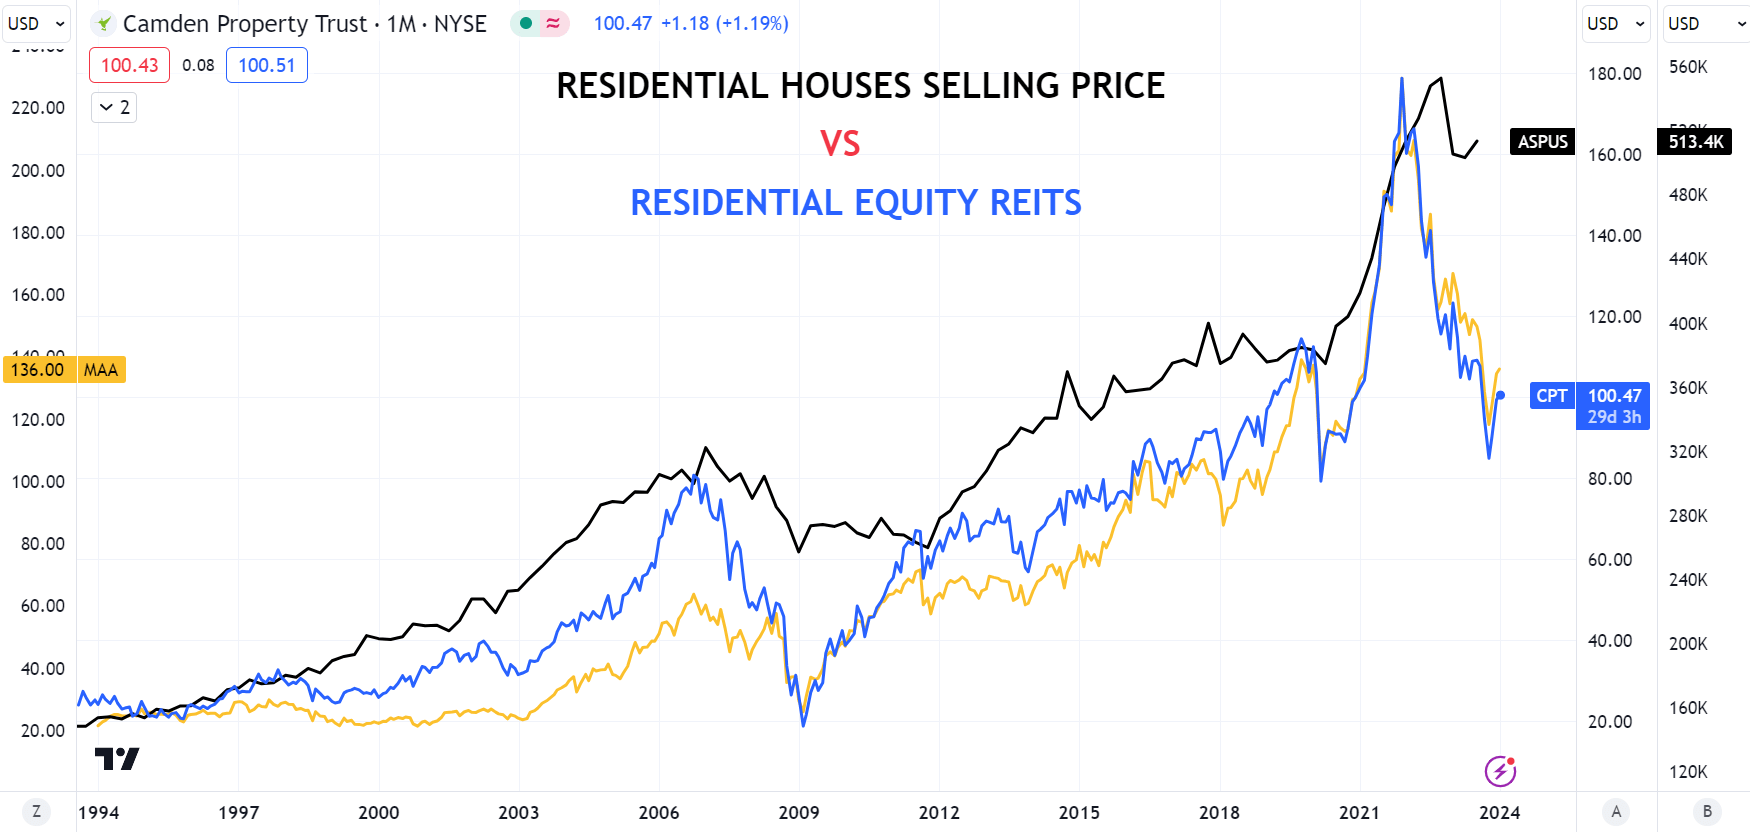
Naturally, REIT prices are highly correlated with the market value of houses, however exchange traded markets are forward looking and more volatile than the real housing market. Intuitively, a rise or acceleration in residential property price growth should support the residential equity REIT prices.
CPT, MAA RESIDENTIAL REITS vs HOUSE PRICES SOLD (TRADINGVIEW)
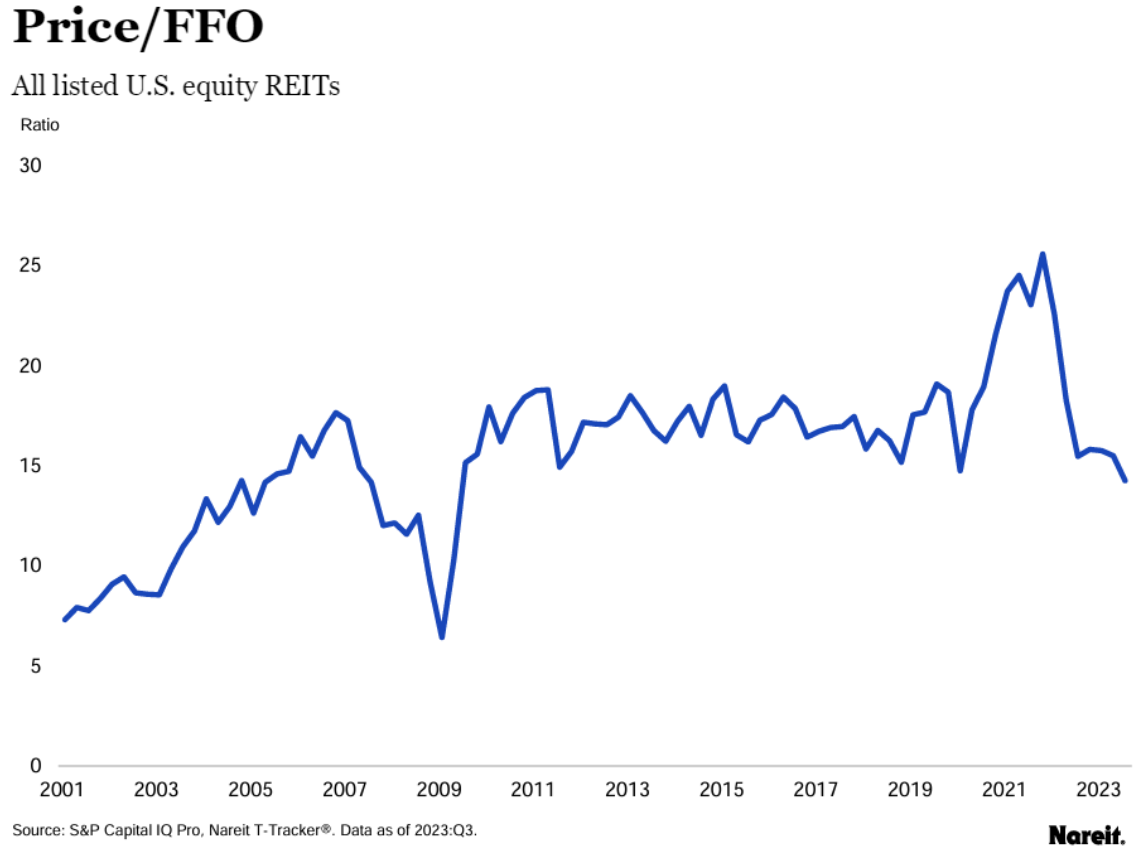
As for REIT's value not just the price of the underlying houses matters however their cash flow generating ability is critical as well, assessment of the cash flow based valuation is essential. According to data provided by Nareit , P/FFO multiples for U.S. equity REITs are currently trading at the lowest level since the depths of the great financial crisis. That suggests, currently REITs are undervalued compared to their cash flow generating ability and are highly attractive space.
PRICE TO FFO RATIO RESIDENTIAL REIT (NAREIT)
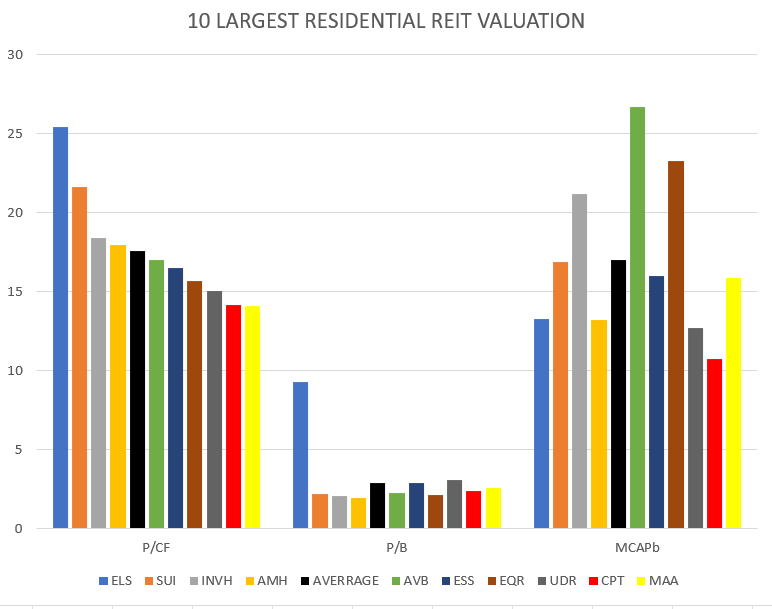
Below is a list of the top 10 leading residential REITs by market capitalization.
- AvalonBay Communities, Inc. (AVB)
- Equity Residential (EQR)
- Invitation Homes, Inc. (INVH)
- Sun Communities, Inc. (SUI)
- Mid-America Apartment Communities, Inc . (MAA)
- Essex Property Trust, Inc. (ESS)
- Equity LifeStyle Properties, Inc. (ELS)
- American Homes 4 Rent Class A (AMH)
- UDR, Inc. (UDR)
- Camden Property Trust (CPT)
Comparing the largest 10 residential REIT valuation, Camden Property Trust and Mid-America Apartment Communities are trading at the largest discount based on their price to cash flow ratio. Amongst the top 10, only these two REITs are trading below 15x P/CF ratio.
10 LARGEST REIT VALUATION (TRADINGVIEW)
iShares Residential and Multisector Real Estate ETF
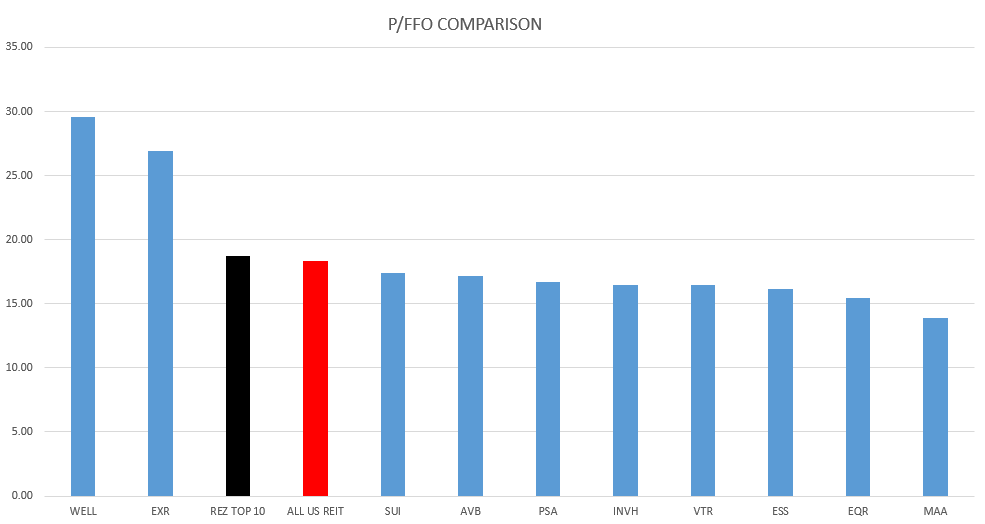
Perhaps one of the best way for investors to capture an anticipated rise in residential REIT prices is investing into Blackrock's ETF ( REZ ) that tracks the FTSE NAREIT Residential Index. The Index measures the performance of the residential apartments, manufactured homes, healthcare and self-storage real estate sectors of the US equity market. Five out of the fund's top 10 largest holdings are on the list of the top 10 largest residential REIT.
REZ ETF TOP 10 HOLDINGS (IBKR)
REZ top 10 holding's 18.72x P/FFO valuation is in line with the all REIT average. As it is previously pointed out, this number is in the lower end of its post 2008 range, likely making it an attractive value play.
PRICE TO FFO RATIO REITS (TRADINGVIEW , NAREIT)
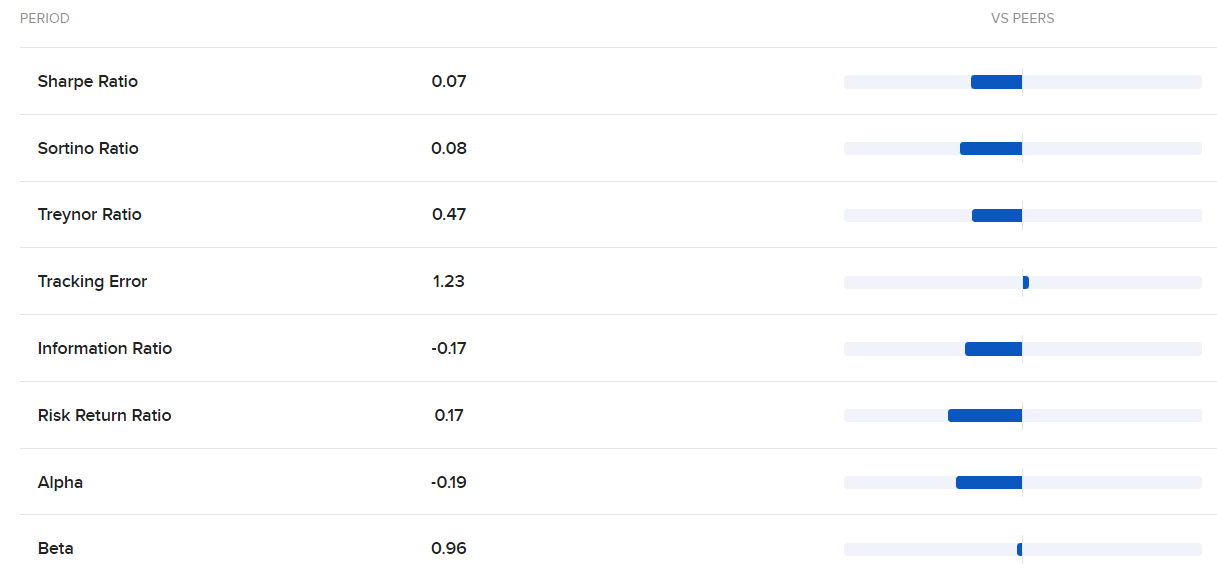
Comparing the fund's risk parameters, it's Sharpe, Sortino, Treynor, Information and Risk Return ratios are outperforming, meanwhile it's tracking error and Beta is in line with its peers.
REZ ETF RISK PARAMETERS (IBKR)
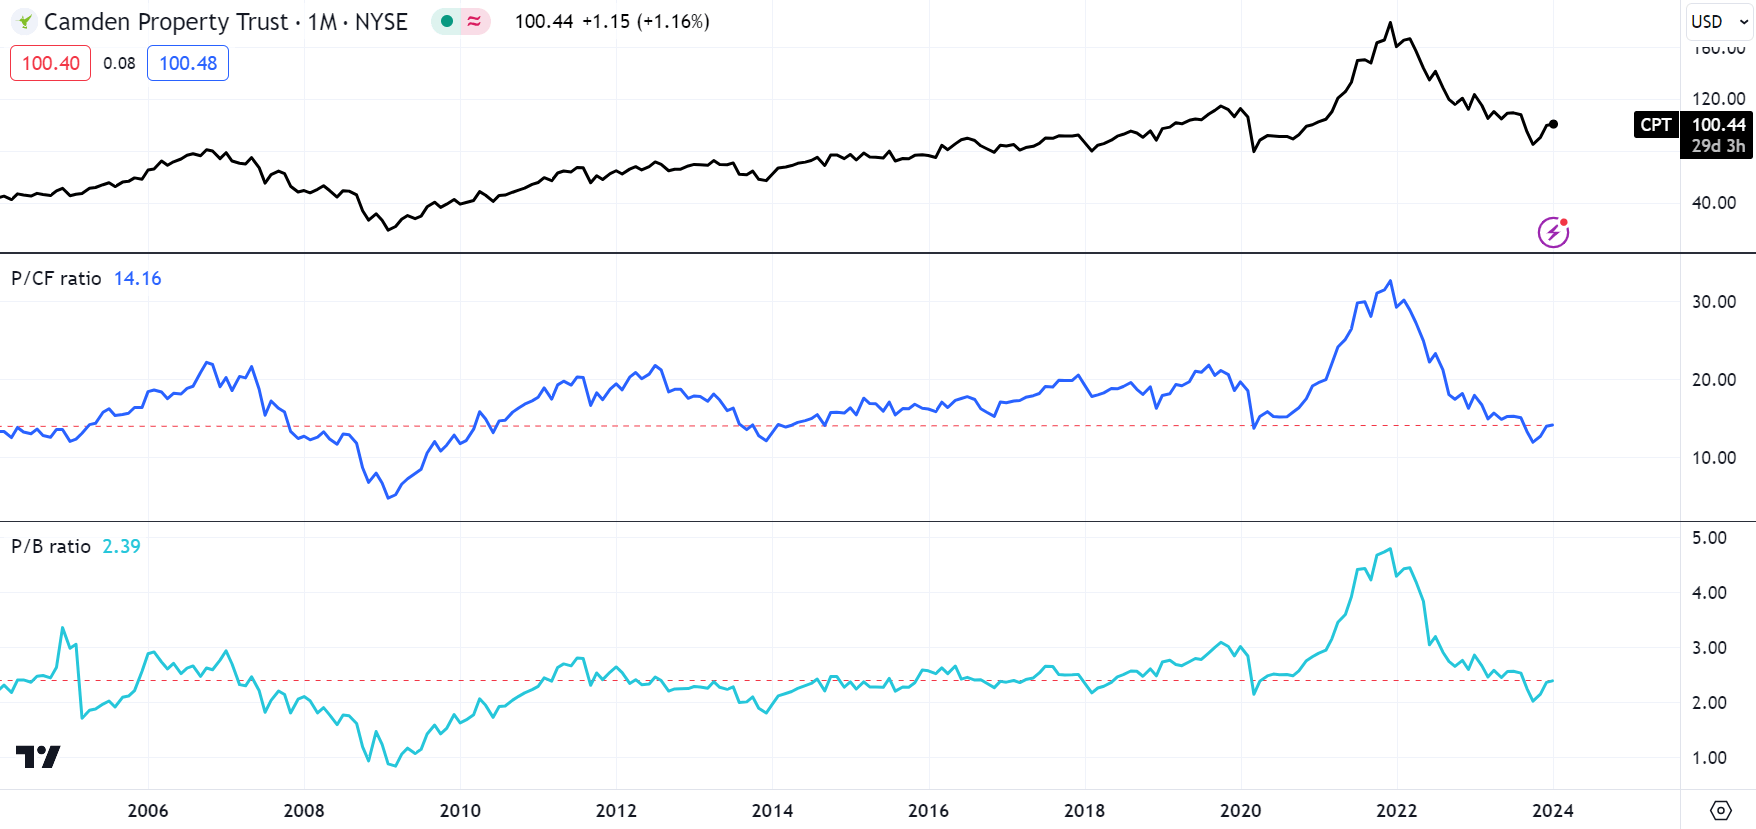
Camden Property Trust
Camden Property Trust owns interests in and operates approximately 178 multifamily properties consisting of 60,652 apartment homes across the United States. The Company's mid-rise buildings or two- and three-story buildings in a landscaped setting, as well as high-rise buildings are located in Arizona, California, Colorado, Florida, Georgia, North Carolina, Washington District of Columbia ((DC)) Metro and Texas, among others.
CPT is not just trading at discounted levels compared to its peers, however it's historical self as well. Since the great financial crisis, it was only below the current 14x price to cash flow ratio in 2013 and 2020, while it's 2.39 price to book value sits at its 20-year average.
CAMDEN PROPERTY TRUST VALUATION (TRADINGVEW)
Currently analyst consensus for funds from operations ((FFO)) is stable growth until 2027 after 2024 FFO matching the 2023 levels. FFO is expected to reach $8.63 per share by 2027, up 27% from expected 2023 levels of $6.8.
FFO FORECAST (IBKR)
Mid-America Apartment Communities
Mid-America Apartment Communities operates through two segments: Same Store, and Non-Same Store and Other. Its Same Store segment represents those apartment communities that have been owned and stabilized for at least 12 months. Its Non-Same Store and Other segment includes recently acquired communities, communities being developed or in lease-up, communities identified for disposition, and others. Its Non-Same Store and Other segment also includes non-multifamily activities. As of June 30, 2023, MAA had ownership interest in 101,986 apartment units, including communities currently in development.
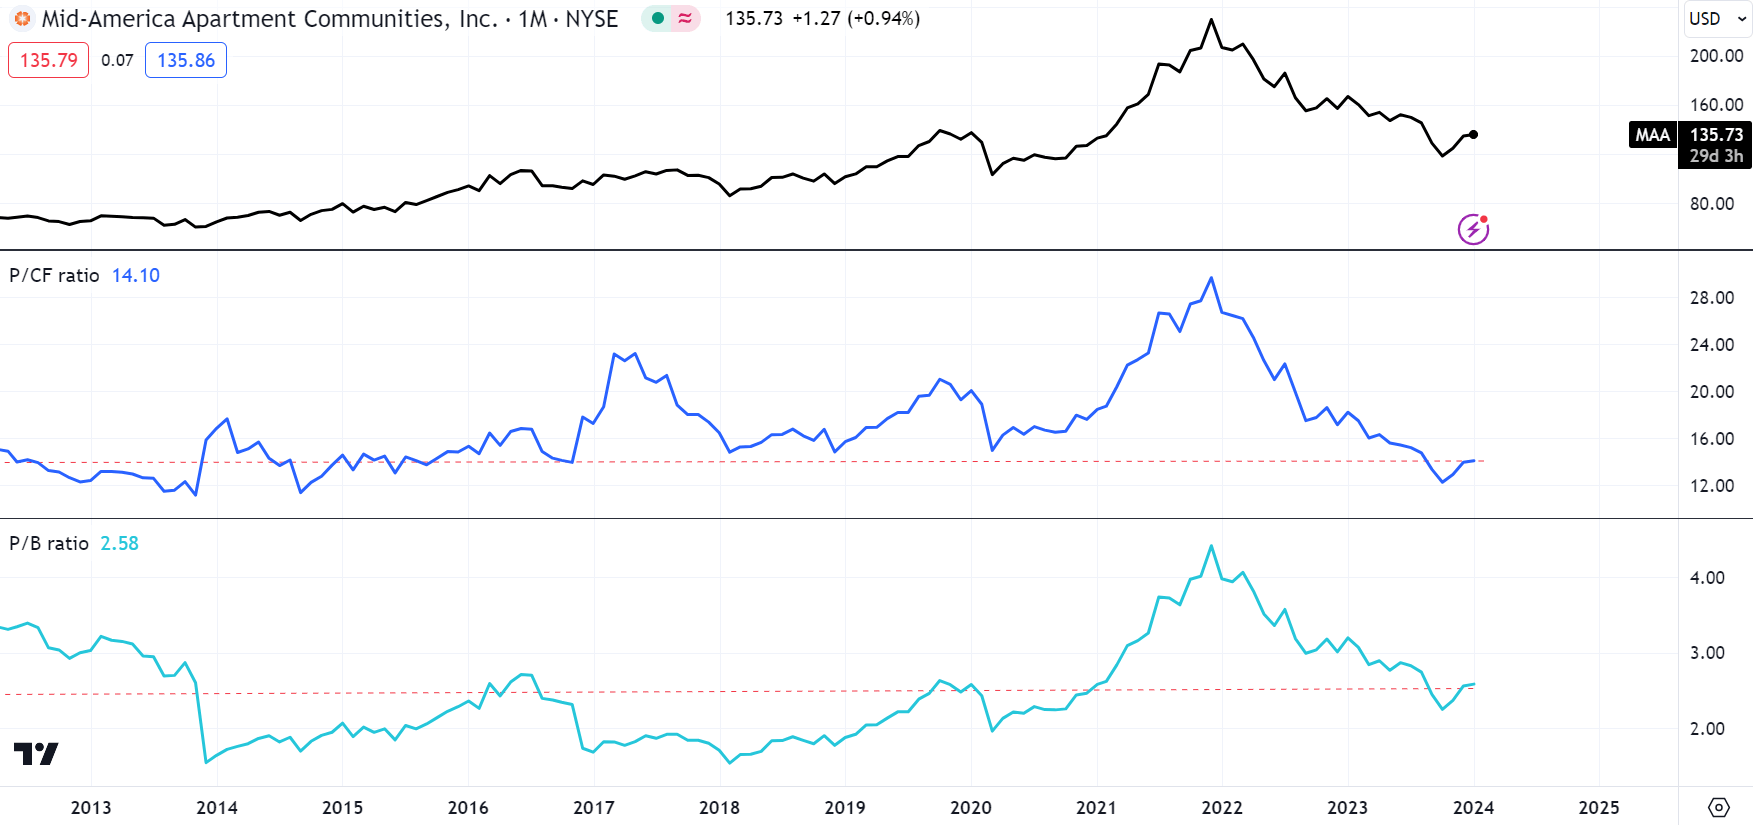
MAA is not just trading at discounted levels compared to its peers, however it's historical self as well. In the past decade, it was only below the current 14x price to cash flow ratio between 2014 and 2016, while it's 2.58x price to book value sits at the higher end of its 10-year average.
MID-AMERICA APARMENT COMMUNITIES VALUATION (TRADINGVIEW)
Currently analyst consensus for funds from operations (FFO) is stable growth until 2027 after a slight decline in 2024 FFO after strong 2023. FFO is expected to reach $11.25 per share by 2027, up 22.8% from expected 2023 levels of $9.16.
FFO FORECAST (IBKR)
Conclusion
The overall assessment of the macro and market developments suggests that residential house prices are likely due to a meaningful rebound, based on the historical statistics. Naturally, rising house prices should drive up the value of residential real estate trusts, therefore allowing investors to capitalize on the anticipated trend. On top of that, the residential real estate sphere appears to be quite favorably valued as a whole, while amongst the largest Camden Property Trust and Mid-America Apartment Communities appear to be trading at the greatest discount compared to their peers, likely offering outstanding returns for shareholders. I recommend the iShares Residential And MultiSector Real Estate ETF (REZ) as a diversified way to take advantage of the REIT rebound I expect.
For further details see:
Residential Real Estate Cycle Analytics Suggests REIT Prices Likely Rebound Till 2024 Q3