FTRI - RIP The 60/40 Portfolio It's Time Now For Hedged Aggression
2023-06-12 21:12:40 ET
Summary
- The buy-and-hold 60-40 portfolio has been a catastrophe over the last 18 months. When both stocks and bonds fell precipitously, they discredited the concept.
- Floating rate treasuries and quality corporates pay 5% now with virtually no credit or rate risk. They are now the backbone of my portfolio.
- High-yield dividend stocks, paying about 10% form the mezzanine; I can cut drawdowns there by judicious VIX-based exits about 6% of the time.
- Outsized gains come from hedged positions in SPXL, a 3X-leveraged S&P ETF. Puts limit tail risk and VIX-based metrics trigger exits about 15% of the time.
- A nominal 60%-20%-20% respective split of these three portfolio segments can provide double-digit returns with 5% drawdown risk, higher or lower for alternative risk appetites.
Why I’m Writing Today
I’m writing this article because I’ve reached a pivot point in portfolio strategy, and I’d like to share my thinking. A strategy pivot does not necessarily portend a stock market pivot, but risk conditions have changed substantially in recent months, and I believe it’s time to be more aggressive, but only with prudent hedges.
Let me set the table first. I’m already retired, and my risk appetite is lower than many of you. I can live comfortably on my current nest egg as long as I don’t do something stupid. Given that, and earlier risk conditions, I became very cautious in my portfolio commitments over the last two years. I divested of any mid-to-long-term yield holdings and replaced them with floating-rate treasuries, and I cut my equity allocations despite running a VIX-related algorithm that has sidestepped every major drawdown in the past.
You might wonder why I’d be so conservative despite the algorithm, so let me explain. The great philosopher Dirty Harry once said, “A man’s got to know his limitations.” Since 2008 the worst drawdown for the S&P has been 52% and the algorithm avoided more than two-thirds of that, but even a 15% drawdown is more pain than I care to bear. Then there is the potential black swan. On Black Monday in October of 1987 the S&P fell more than 20% in a single day. There was no reaction time, algorithm or no algorithm. So, I’m very careful with my investment pool.
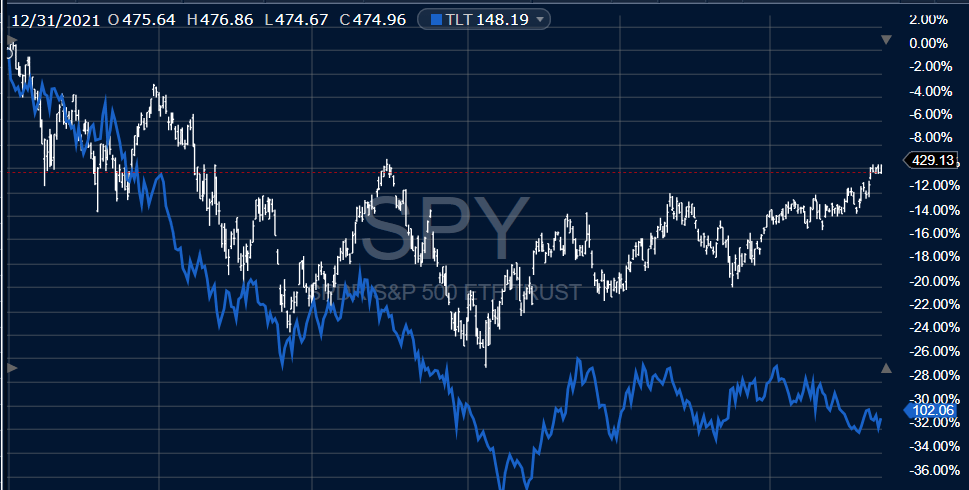
That cautious posture has worked well given that bonds collapsed, and the S&P has fallen over the last 18 months, but money-market-sized portfolio returns are no fun. This is a chart of the S&P since the end of 2021; it fell over 20% and has partially rebounded recently. The blue line shows TLT, a 20-year treasury ETF. It has fared much worse than stocks. The 60/40 portfolio is dead.
What Next?
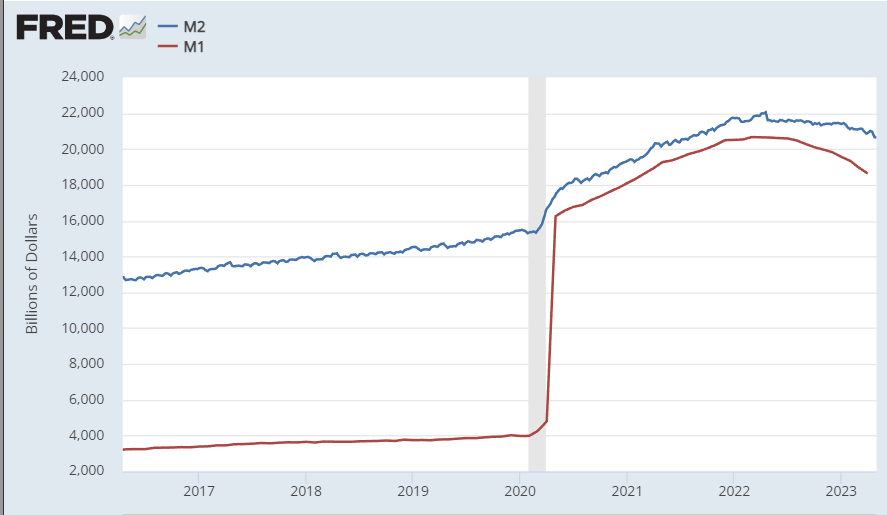
Markets are in a transitional period at the moment. Almost everyone expects that the Fed is near pausing their extremely aggressive rate increase policy, or maybe they’ll just skip June and resume increases later. In any case, the Fed is draining liquidity; money supply (M1 and M2) is shrinking as shown here.
Money Supply, M1 & M2 (Federal Reserve Bank of St. Louis)
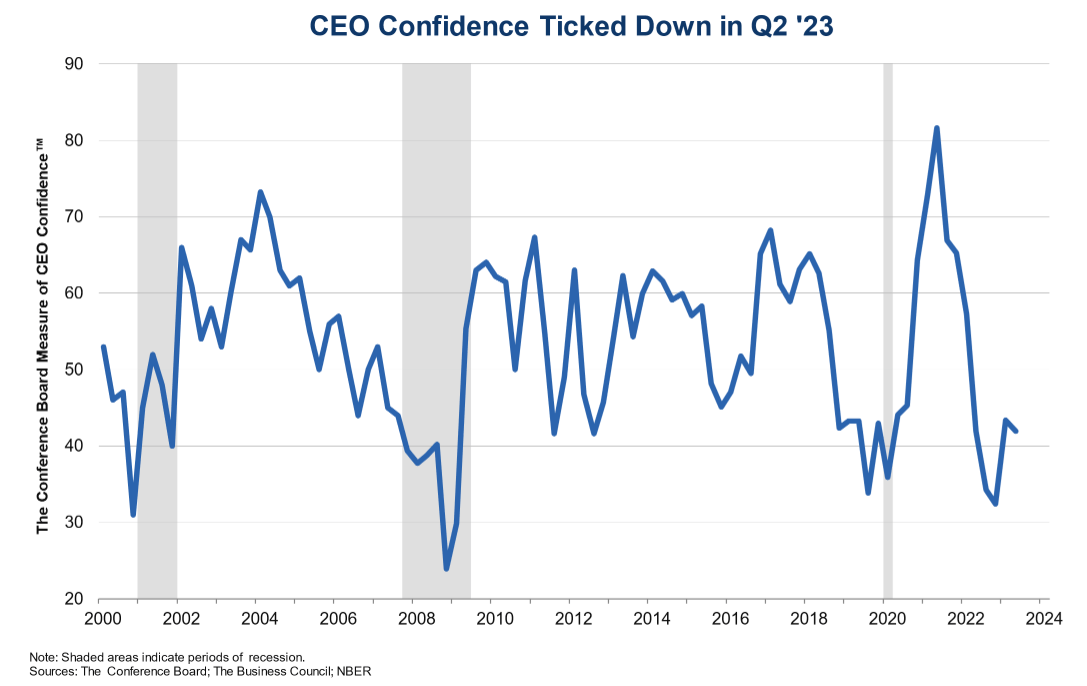
The rate increases to date will provide a lagged drag on the economy starting about now; monetary contraction will also hurt. Indicators are almost all flashing recession; the yield curve is very inverted, leading indicators have fallen for 12 straight months and the decline accelerated in the last 6 months; consumer confidence is falling, and CEO confidence has plummeted to levels nearly as low as the dotcom bubble burst in 2001 and the COVID crisis of 2020.
CEO Confidence Survey (Conference Board)
Yet stock prices have been rising in recent months, and markets just might be looking past the expected recession. It’s very different than a year ago when rising inflation and the Fed’s stance dictated a market consensus of great caution. Now gains are more likely but set against a backdrop of remaining serious risks.
At some point, economic prospects will improve, and rates will begin falling, but meanwhile we’re facing risk of bank failures, China’s military adventurism, stubborn inflation, Fed actions, uncertainty as to the USD reserve-currency status, etc.
My own perspective is that gains are worth chasing aggressively if loss potential can be constrained. So, let’s address how to capture full-portfolio, double-digit gains with protection against tail risk.
A Low-Risk, High-Return Portfolio
The buy-and-hold 60-40 portfolio has been a catastrophe over the last 18 months. Financial advisors used to count on stocks and bonds providing diversified returns and risks, but when they both fell precipitously it discredited the concept. One size fits all was never a good idea anyway.
In simple terms, my own investments have been moving toward a three-part portfolio where the relative holdings can be varied to fit evolving risk environments. The major components consist of:
- Floating-Rate Yield Holdings (Maybe the Fed will ‘skip’ June, but then what; high quality floating-rate ETF’s now sport a 5% annualized yield based on most recent distributions with no rate risk and minimal credit risk)
- High-Yield Dividend Stocks (I’ll identify 5 symbols yielding close to 10% and I’ll explain how VIX-related metrics can sidestep risk by identifying exit tactics about 6% of the time.)
- 3X-Leveraged SPXL With Once-Weekly SPX Hedges (This will take some explanation, but the strategy is worth some effort and offers very large returns with constrained drawdowns)
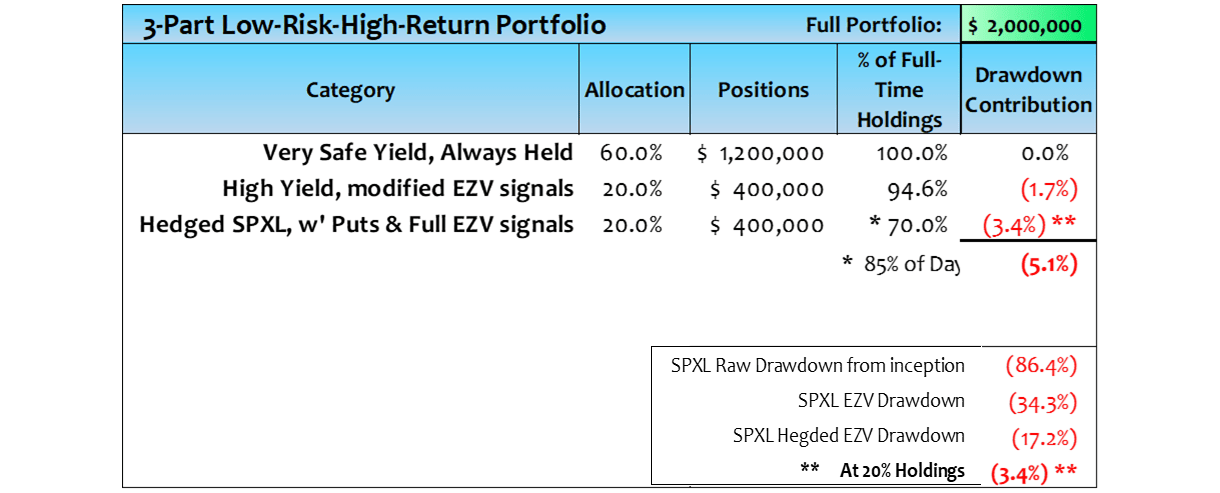
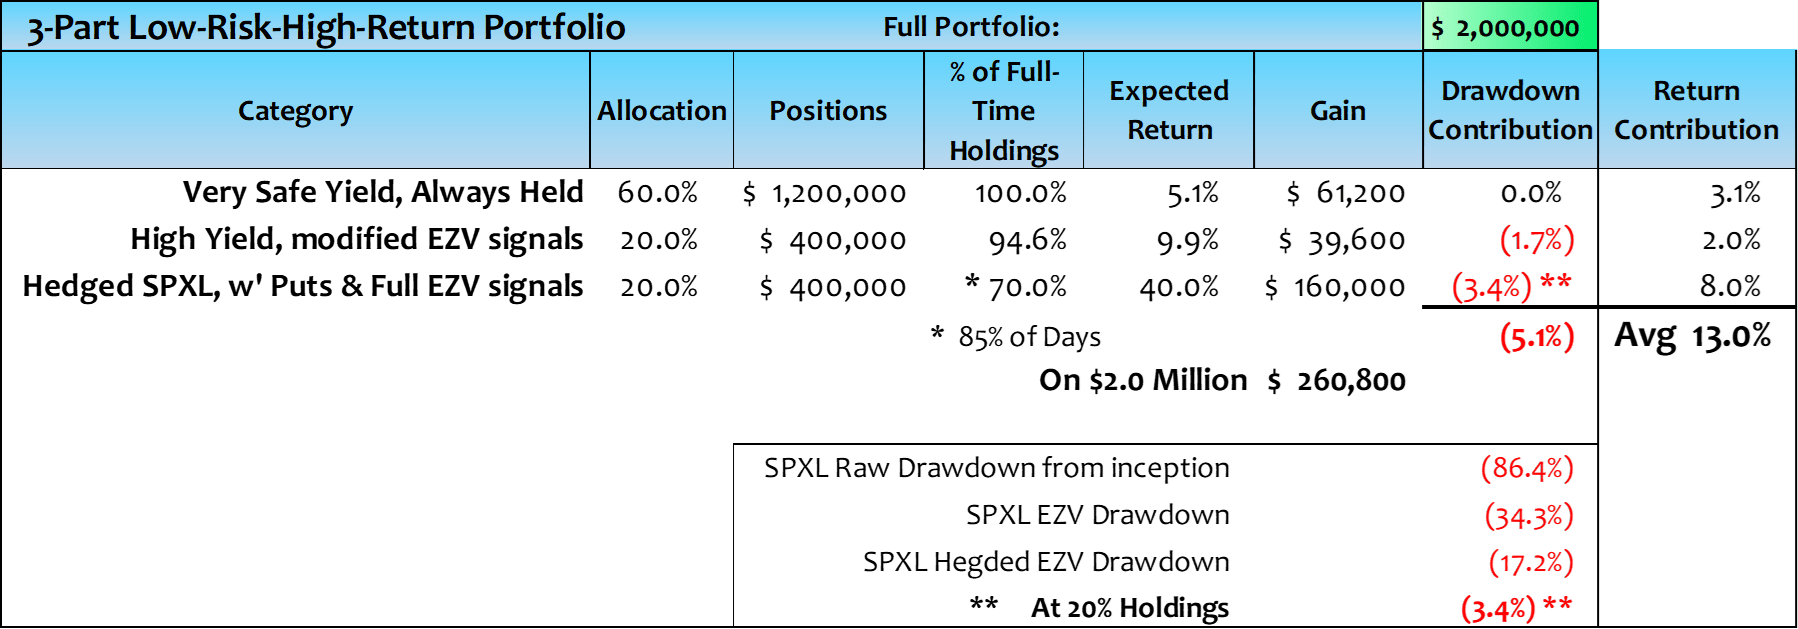
Before explaining all this in detail, this is a table outlining typical weightings and risks for one such portfolio. We’ll discuss returns after examining each component.
Portfolio Segments & Risk Characteristics (Michael Gettings)
Floating-Rate ETFs
Here we’re looking at symbols such as USFR, TFLO, and VRIG. The first two are floating-rate treasury ETFs and the last is a floating-rate corporate bond ETF. The most recent distributions and the 12-month extrapolation to annual yields are below:
USFR : May ’23 distribution was $.219 extrapolated to $2.628/year or 5.2% on the $50.36 price
TFLO : June ’23 distribution was $.2193 extrapolated to $ 2.63/year or 5.2% on the $50.48 price
VRIG : May ’23 distribution was $.1123 extrapolated to $ 1.3476/year or 5.4% on the $24.90 price
A 5% yield with no rate risk and virtually no credit risk has been a long time coming. Until rate increases have clearly peaked, these should probably constitute the bulk of any risk-averse portfolio.
High-Yield ETFs
This becomes a little more complicated but not much, because high yields, even when a fraction of the portfolio, always carry risk. And whether already in retirement, or just planning for it, risk needs to be managed. I’ll use these symbols to illustrate how.
| Symbol |
| Recent Price |
| Dividend % |
| BIZD |
| $ 14.96 |
| 11.5% |
| IHDG |
| $ 39.55 |
| 11.7% |
| JEPI |
| $ 54.02 |
| 11.3% |
| FTRI |
| $ 12.40 |
| 8.2% |
| OXSQL |
| $ 24.94 |
| 6.5% |
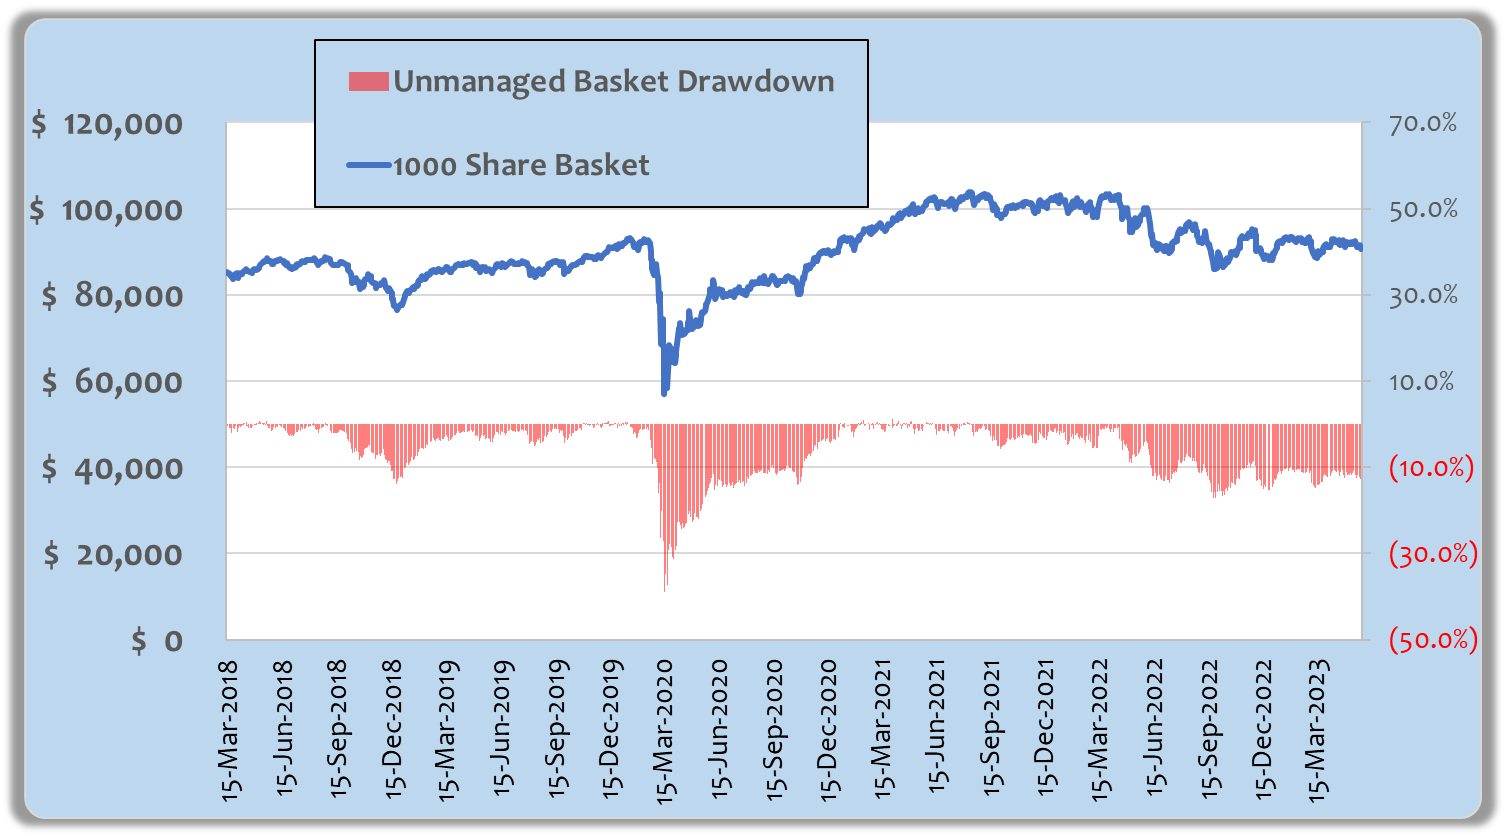
This is a graph of a 4-Part basket of 1,000 shares each, excluding BIZD. The exclusion is necessary because its inception was post-COVID and that period’s drawdown is critical. The red bars at the bottom are plotted against the right axis and indicate drawdowns which exceeded 30% during the COVID crash.
High-Yield Dividend Basket (Michael Gettings / Fidelity)
A 30% drawdown with a 20% portfolio allocation would cause a 6% decline in the portfolio value; that is problematic. But that raw drawdown ignores the fact that VIX metrics can trigger an exit as market stress builds. The same EZV algorithm that I use for S&P-related ETFs could reduce that 6% portfolio hit to only 1.7%.
I won’t go into details of the algorithm here, but feel free to read earlier articles . The algorithm produces occasional sell signals but I separate the response protocols from the signal generation depending on the symbols managed. In the case of high-yield ETFs, I’ve found there is no need to exit on every signal; waiting for a sell signal accompanied by a 1.5% drop in the high-yield basket will reduce drawdowns from over 30% to only 8.5% and that translates to only 1.7% on a portfolio basis. And holding that basket 94% of the time preserves dividend participation.
3X Leveraged SPXL
Let me acknowledge that this could be controversial. FINRA and SEC provide warnings on leveraged ETFs like SPXL. I'll provide two links below:
There are two differences here: I don't consider a buy-and-hold strategy for SPXL, and I'll discuss hedging strategies to constrain tail risk when it is owned. The discussion below will dive into drawdown potential, both as a buy-and-hold investment which I do not suggest, and a risk-mitigated investment which I do.
But the combination of risk mitigation strategies which constrain drawdowns along with the extraordinary returns available from a 20% portfolio commitment make the numbers compelling.
Remember, I’m retired and risk-averse, but this additional component, in the broader portfolio strategy, fits my risk appetite far better than the 60-40 approach which would have destroyed my capital base last year.
Parenthetically, some would argue that if you hold that 60-40 position through the bad times, the rebound will make things right. The trouble is that emotions come into play. How many people sell when the drawdown threatens their future only to sit on the sidelines for the most rewarding initial market rebound.
To start, let’s do an unmitigated risk comparison between SPY and SPXL. During the great financial crisis, SPY’s worst drawdown was 52%. There is no direct comparison for SPXL because its inception was November 5, 2008; its worst drawdown was 86.4% in March of 2009. But even if SPXL dropped to zero, at a 20% allocation it would do less damage than the 26% hit from a 60% allocation of SPY dropping 52%.
Looking at the COVID period in early 2020, SPY’s worst drawdown was 34% and SPXL’s worst was 77%. Again at the respective 60% and 20% allocations, SPY would contribute a worse loss than SPXL, 20.4% drawdown for SPY versus 15.4% for SPXL.
But we have great mitigation tools. Weekly SPX out-of-the-money (“OTM”) puts can constrain losses by more than half, and when implied volatilities are low they also enhance average returns. Plus, the EZV algorithm constrains SPXL losses by more than half as well. Combining them, the mitigated drawdown at the portfolio level should be in the low single digits.
You might wonder why I’m focused on SPX options rather than SPXL. SPX options offer daily expirations which settle for cash. In some cases daily granularity is useful, and in more complex strategies there is no chance of waking up to an exercised massive underlying position; instead the accounting will reflect whatever the options are worth at expiration.
I’ll explain the annual return expectations for the components and the consolidated portfolio in a moment, but first let’s deal with the option strategies.
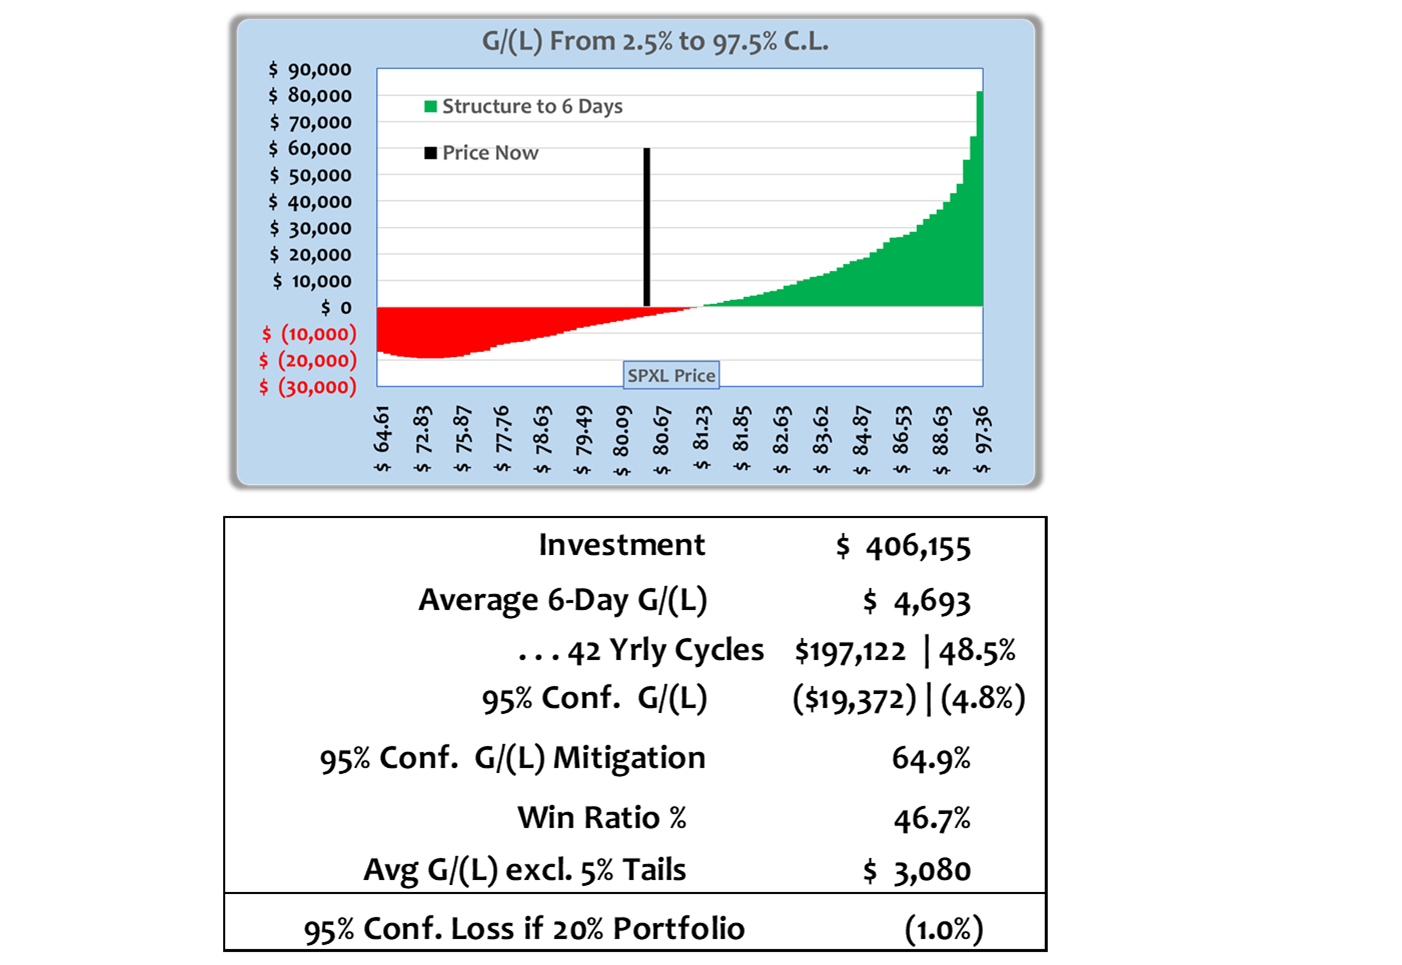
This is a simple put strategy hedging 5,000 shares of SPXL from early morning Thursday June 8 th through the following Thursday’s close on June 15 th . At the time of the trade SPXL was $80.49; SPX was $4,270.11 and a one-week $4,210 OTM put’s implied volatility was in the low teens. Three SPX puts at $12.35 were sufficient protection for 5,000 shares of SPXL.
By the way, the Monte Carlo results consider historical price volatility as well as implied volatility (“IV”) changes; they also consider IV shocks associated with Fed meetings and CPI releases. Approximately 50,000 sample price/IV draws are then run through Black Scholes to value option positions at the target settlement date. Graphic and tabular expectations are shown next.
Monte Carlo, Low IV Market (Michael Gettings)
In this strategy the options represented a cost overlay equal to 0.9% of the SPXL investment; compared to the average positive (gains-only) week of about 6%, the low implied volatility (“IV”) is a bargain. The 95%-confidence range of potential SPXL price changes through June 15 th was estimated at roughly +/- 14%. The net effect of the hedge is to substantially constrain loss potential in exchange for a 0.9% threshold before gains accrue on an SPXL rise. On the upside, that 0.9% is not much against the average 6% good week or the 14% larger gain potential, and on the downside the 65% loss mitigation adds considerable confidence to hold positions without second guessing oneself.
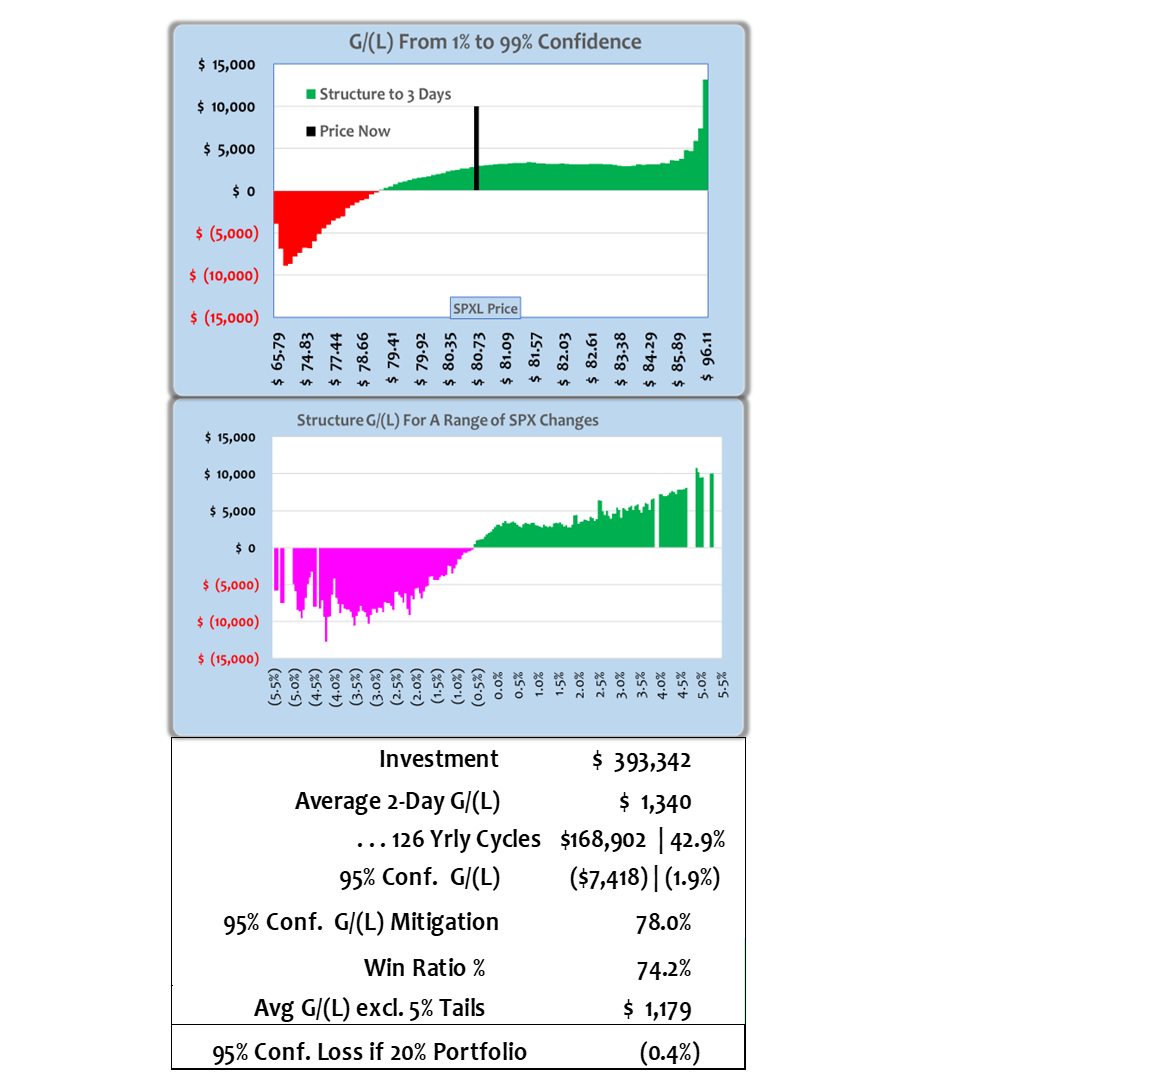
With IVs low, that simple put strategy is cost efficient. As IVs rise a different strategy is better. Higher IVs make the hedge more expensive, but they also make capturing time decay more attractive. So my own preference is to forego some extreme upside in exchange for a broad, highly probable span of moderate gains while maintaining loss mitigation. The next two graphs and table reflect a 3-part option overlay when SPX implied volatilities are 25%.
I won’t torture the details except to say it is designed to run for 2 days with six 9-day OTM SPX puts, and two short at-the-money SPX puts, plus SPXL covered calls overlaid on three quarters of the SPXL shares. The SPX short puts are a 2-day tenor and the SPXL short calls are a two-day minimum to a maximum one week. The long puts provide loss mitigation; using longer-dated puts reduces the burden of time decay. The short SPX and SPXL options partially cap gains but provide an opportunity for capturing material time decay across a wide spectrum.
I show the 1%-to-99% confidence outcomes in the top graph, and an extended range below it to emphasize the ultimate lower-tail protection.
Monte Carlo, High-IV Markets (Michael Gettings)
Both of these structures, one geared toward low-IV environments and one for high IVs, provide templates for managing very high return opportunities with heavily constrained downside. The management process consists of a one-hour assessment of both templates. If IVs are low, the assessment is a weekly requirement, and if IVs are high, it requires more diligence with assessments on two-day intervals.
I should point out that these results assume a full range of historical price patterns. If you believe a theory that low implied volatilities are predictive of small future price changes, the numbers would change. In my experience, low implied volatility has little predictive value with respect to realized volatility. I’ve run these structures through periods of both high and low IVs and the Monte Carlo results track well. Also, in my extensive work with VIX which reflects S&P IVs, I rely far more heavily on rates of change than the level of VIX itself which contributes minimal information about the future.
Pulling It All Together
The two different hedged SPXL strategies produce 43% and 49% annual returns if renewed consistently upon each structure’s expiration. Two effects mitigate against those numbers: potential lags in renewals and the fact that IVs vary more than the two samples shown. So, in the consolidated table below, I’ve assumed a 40% return from the SPXL component. Drawdown protection is exceptional. The two strategies mitigate losses by 65% or 78%. I’ve assumed 50% loss mitigation in the final summary below.
As a sanity check, the algorithm has averaged over 20% CAGR with SPY, but SPXL is 3X-leveraged. In effect, the 40% returns assumed here are conservative reflecting much-desired hedge burdens; so are the drawdown benefits. That typical portfolio shown earlier is now shown with the return estimates included. Average annual returns should be about 13%, higher or lower as proportionate allocations can vary for individual risk appetites.
Portfolio, Risks & Returns (Michael Gettings)
Closing
These hedged equity positions are liberating. In an environment where opportunities seem to have returned, but serious risks linger, the peace of mind is priceless. My own propensity without hedges in such an environment is to become overly cautious and cut positions as emotions get in the way.
The portfolio described above enables prudent aggression. It can be deployed with confidence, even in the face of material market ambiguities. When combined with floating-rate 5% yields and a modest layer of high-yield dividends the total portfolio produces double-digit annual returns with a very comfortable risk profile, even for a retiree like myself. More aggressive investors can easily upscale the SPXL component, and more risk-averse investors can scale it back.
The 60-40 portfolio is dead; may it rest in peace.
For further details see:
RIP The 60/40 Portfolio, It's Time Now For Hedged Aggression