ACR - Rithm Capital: Four Of A Kind 9% Yielding Preferreds
2023-03-30 02:42:03 ET
Summary
- Rithm Capital is a high yielding residential focused mREIT which has recently undergone an internalization effort.
- Some folks may know them as New Residential Investment Corp. where they traded as NRZ.
- In this article we'll take a look at RITM's four fixed-to-floating preferred securities and see how they compare to other preferreds in the sector. And to each other.
- We'll also take a look at their upcoming 2023 debt maturity.
- If you like data and seeing comparative analysis, there are tables for you here.
Rithm Capital ( RITM ) is an internally managed REIT with a portfolio of mortgage servicing rights, mortgage origination and servicing companies, residential MBS, single-family rental properties, mortgage loans, and consumer loans. Some folks may know them from their days as New Residential Investment Corp. trading as NRZ.
In the summer of 2022 then New Residential made the choice to internalize management and change their name to Rithm Capital. The move was expected to create cost savings; the name change is anyone’s guess. According to the press release “ The new name and brand help distinguish us from our operating companies, including Newrez, and reflect our culture, team and ambitions for growth beyond residential mortgage. ”
Best I can tell, investors are expected to know that something rhythmical is happening with their capital. Trust and believe.
They report across six different business segments:
-
Origination
-
Servicing
-
MSR Related Investments
-
Residential Securities
-
Properties and Loans
-
Consumer Loans and Mortgage Loans Receivable
More and more Rithm operates as an investment platform diversified across the financial services sector. They do this through a number of operating companies like NewRez, Caliber Home Loans, and Genesis Capital.
RITM q4'22 Investor Presentation: Portfolio of Operating Companies
But let’s look at their balance sheet to understand their allocations a bit more clearly. Here’s data on their balance sheet I compiled from their q4’22 quarterly supplement .
| ASSETS |
| As of 12/31/22 |
| % of Total |
| Mortgage servicing rights and mortgage servicing rights financing receivables, at fair value |
| $8,889,403 |
| 27.4% |
| Real estate and other securities |
| $8,289,277 |
| 25.5% |
| Residential loans and variable interest entity consumer loans held-for-investment, at fair value |
| $816,275 |
| 2.5% |
| Residential mortgage loans, held-for-sale |
| $3,398,298 |
| 10.5% |
| Single-family rental properties, held-for-investment |
| $971,313 |
| 3.0% |
| Mortgage loans receivable, at fair value |
| $2,064,028 |
| 6.4% |
| Residential mortgage loans subject to repurchase |
| $1,219,890 |
| 3.8% |
| Cash and cash equivalents |
| $1,336,508 |
| 4.1% |
| Restricted cash |
| $281,126 |
| 0.9% |
| Servicer advances receivable |
| $2,825,485 |
| 8.7% |
| Receivable for investments sold |
| $473,126 |
| 1.5% |
| Other assets |
| $1,914,607 |
| 5.9% |
| Total Assets |
| $32,479,336 |
| 100.0% |
| LIABILITIES |
| As of 12/31/22 |
| % of Total |
| Secured financing agreements |
| $11,257,736 |
| 44.2% |
| Secured notes and bonds payable |
| $10,098,943 |
| 39.7% |
| Residential mortgage loan repurchase liability |
| $1,219,890 |
| 4.8% |
| Unsecured senior notes, net of issuance costs |
| $545,056 |
| 2.1% |
| Payable for investments purchased |
| $731,216 |
| 2.9% |
| Dividends payable |
| $129,760 |
| 0.5% |
| Accrued expenses and other liabilities |
| $1,486,667 |
| 5.8% |
| Total Liabilities |
| $25,469,268 |
| 100.0% |
| EQUITY |
| As of 12/31/22 |
| % of Total |
| Preferred Stock |
| $1,257,254 |
| 17.9% |
| Noncontrolling interests in equity of consolidated subsidiaries |
| $67,067 |
| 1.0% |
| Common Stock Equity Value |
| $5,685,747 |
| 81.1% |
| Total Equity Value |
| $7,010,068 |
| 100.0% |
| Book Value Per RITM Share |
| $12.00 |
At the time of writing shares of RITM were trading for $7.99 implying a P/B value of 0.67x. These shares also pay out a quarterly dividend of $0.25 which annualizes to $1.00 or a 12.5% yield.
From an asset perspective we can see that the majority of the portfolio (52.9%) is held in mortgage servicing rights or MSRs and real estate and other securities. This latter line item is a bit nebulous but if we turn to their 2022 10-K we can see that this primarily consists of Agency and Non-Agency RMBS.
Considered from this perspective we can see that 45.3% of the portfolio is wrapped up in residential properties somehow whether through RMBS, residential loans, residential mortgages, or single-family rentals. Their MSRs are also very much tied to the residential market which brings us to a total of 72.3% of the portfolio focused in this arena.
Valuing each piece of their portfolio would be quite a separate exercise from the scope of this article. What I’ll note is that one should be aware of the exposure one has to residential housing broadly when invested in RITM.
An Impending Maturity
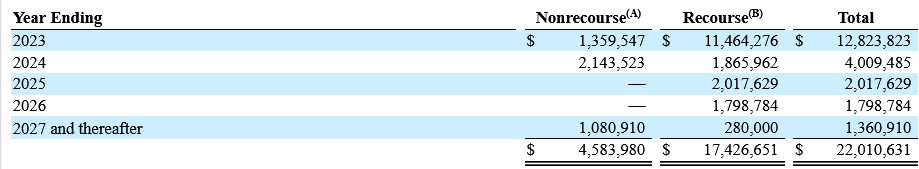
The company has $21.9 billion in debt on top of the common equity value of $5.7 billion. There's a $12.8 billion chunk of it (~58%) which matures this year with another $4 billion next year.
RITM 2022 10-K: Debt Maturities
Management was asked about the cost of capital in this environment back on the q3'22 earnings call . Chairman, CEO, and President Michael Nierenberg had this to say:
"I’ll take the latter part. Financing costs are high everywhere. If you look where SOFR is and you look at margins, typically, whether it’s SOFR plus 250 or something like that. I think that financing costs are going to remain high as we go forward."
Credit tightening has likely happened further with bank failures so the cost of refinancing $12.8 billion this year is likely to be material. So let's look closer.
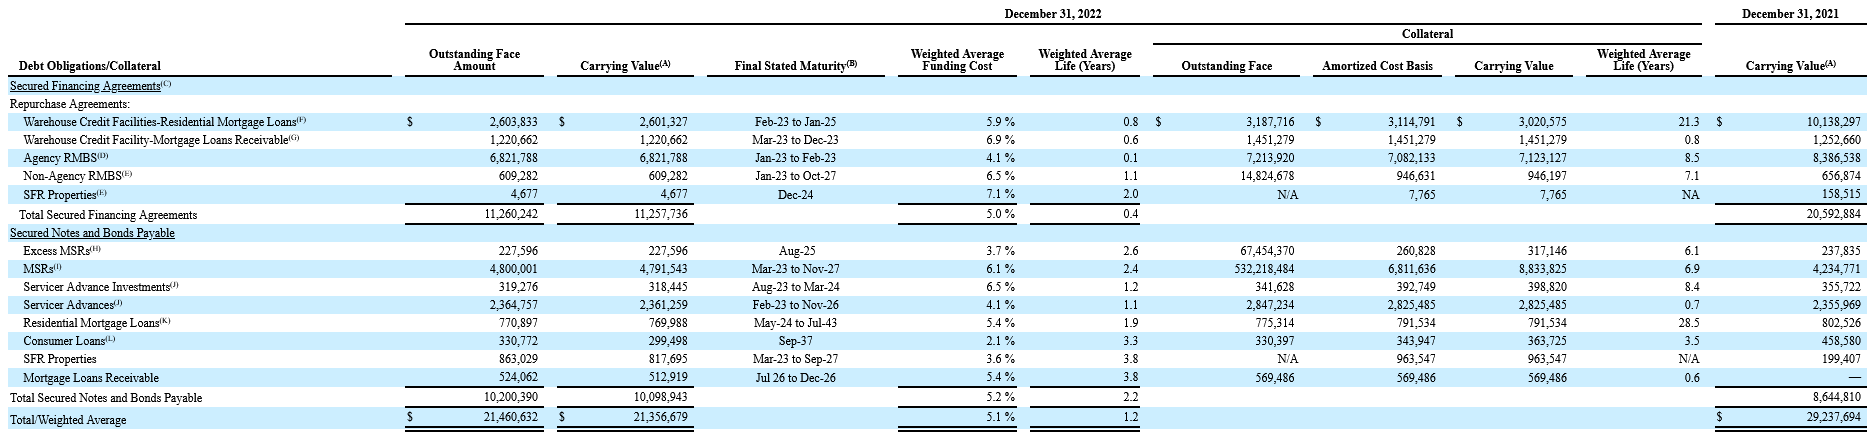
RITM 2022 10-K: Debt Obligations
A big chunk (53%) of this is related to their secured financing on their Agency RMBS portfolio. The $6.8 billion outstanding amount matured in January and February 2023 meaning this refinancing has likely already occurred. And we can likely assume that it has happened at a higher cost of funding then the 4.1% listed here.
They also have around $2.6 billion in warehouse credit facility with maturities between March 2023 and December 2023. This is at an average of 6.9% cost of funding. Here's some data if we assume a 50 basis point increase to the cost of funding on each of these.
| ($ in millions) |
| Outstanding Amount |
| Cost of Funding |
| 50 bps Increase |
| Original Interest Expense |
| Estimated Increased Expense |
| % Increase in Expense |
| Agency RMBS Secured Financing |
| $6,800 |
| 4.10% |
| 4.60% |
| $279 |
| $313 |
| 12.20% |
| Warehouse Credit Facility Mortgage Loans Receivable |
| $2,600 |
| 6.90% |
| 7.40% |
| $179 |
| $192 |
| 7.25% |
Total interest expense in 2022 came in at $791 million. In total the increase in expenses implied by higher rates above would only increase annual interest expense another $47 million or ~6%. At a rough annual interest expense estimate of $838 million it's still covered entirely by cash on hand.
Even with higher costs on their financing, the company does not appear to be facing any liquidity risks. And given that the company maintained their quarterly dividend on the common shares in March 2023 , I'd venture a guess that the bulk of this refinancing has already been handled.
Preferred Protection Compared to Three other REITs
Earlier this month I wrote an article comparing preferred shares offered across three different REITs. As part of that research I produced a table comparing major balance sheet metrics and ratios across each of the three companies: RLJ Lodging Trust ( RLJ ), ACRES Commercial Realty Corp ( ACR ), and TPG RE Finance Trust ( TRTX ).
I’ve updated this table to include RITM. I think this helps give us a window into relative safety profile of preferreds across a few REITs. Although it’s important to note these are not exactly apples-to-apples REITs.
| Averages |
| Business Type |
| Residential mREIT |
| Hotel REIT |
| Commercial mREIT |
| Commercial mREIT |
| Cash |
| $1,336 |
| $481 |
| $66 |
| $254 |
| Total Assets |
| $32,479 |
| $4,978 |
| $2,377 |
| $5,545 |
| Debt |
| $21,901 |
| $2,218 |
| $1,867 |
| $4,161 |
| Total Liabilities |
| $25,469 |
| $2,550 |
| $1,941 |
| $4,223 |
| Total Equity |
| $7,010 |
| $2,429 |
| $436 |
| $1,322 |
| Preferred Equity |
| $1,257 |
| $367 |
| $227 |
| $201 |
| Stock Equity |
| $5,686 |
| $2,062 |
| $209 |
| $1,121 |
| SE/PE Coverage |
| 452.35% |
| 562% |
| 92.4% |
| 557.7% |
| 416.10% |
| Cash/Equity % |
| 19.1% |
| 19.8% |
| 15.1% |
| 19.2% |
| 18.3% |
| Debt/Equity |
| 3.12 |
| 0.91 |
| 4.28 |
| 3.15 |
| 2.87 |
| 2022 Earnings |
| $633 |
| $221.0 |
| $10.3 |
| $86.7 |
| Preferred Dividend |
| $89.7 |
| $25 |
| $19.4 |
| $12.6 |
| 2022 Earnings / Preferred Dividend Coverage |
| 7.06 |
| 8.84 |
| 0.53 |
| 6.88 |
| 5.83 |
What stands out to me here is that RITM has above average metrics for SE/PE coverage, Cash/Equity %, and 2022 Earnings / Preferred Dividend coverage. What these data points suggest is that the preferreds are secure in the capital stack, supported by a healthy amount of cash on hand, and seem to have strong dividend coverage.
Keeping an eye on their debt moving forward will be important for investors. It's a core piece of the business model to manage financing costs in relation to the opportunity of investments present to the company. So in that regard it will always be an important factor for investors to consider here.
Comparison of RITM Preferreds
We can now turn to the four preferred shares that RITM offers. All of these preferreds are at fixed-to-floating rates which reset at the first call date. That means they carry some sensitivity to interest rates. They are also cumulative redeemable preferreds. Here’s the basic data covering each of them.
| Ticker |
| Original Coupon |
| 1st Call Date |
| Price |
| Annual Dividend |
| Current Yield |
| 7.500% |
| 8/15/2024 |
| $20.50 |
| $1.88 |
| 9.15% |
| 7.125% |
| 8/15/2024 |
| $19.49 |
| $1.78 |
| 9.14% |
| 6.375% |
| 2/15/2025 |
| $17.35 |
| $1.59 |
| 9.19% |
| 7.000% |
| 11/15/2026 |
| $18.75 |
| $1.75 |
| 9.33% |
Last week I wrote up another preferred offered by a commercial mREIT NexPoint Real Estate Finance ( NREF ). As part of that research I looked across a universe of 700 preferreds and found the average dividend yield was 8.03% with a standard deviation of 3.20%. That suggests that all of the RITM preferreds are trading at a slight premium to the average. From a purely yield perspective, the D series trades at the highest (9.33%) – and are also the latest in terms of first call date.
If we consider the liquidation value of each is at par or $25.00 then the C series are at the steepest discount. This discount is really a reflection of downward pressure required to make the yield attractive, and in line with the rest of RITM’s preferreds. What’s important here is that even though these have a first call date they do not have a maturity date meaning the company is never required to call them.
From that perspective, I think discount to par value is not a useful metric in regards to the preferreds. If their financing changes in the future and their cost of capital would be meaningfully lowered by retiring the preferred, then we may see the discount to par come into play.
The major differences in regards to these preferreds is going to be when their rate starts floating. With so much opacity in terms of where interest rates are going in the near- to mid-term it’s important to have a sense of this when making a choice between the four. For a less rigorous approach, one might simply buy a basket of each of these preferreds and enjoy the ride as they are more or less exposed to the same risk.
Here’s what these preferreds look like in comparison to those from the three companies above.
| Ticker |
| Type |
| Original Coupon |
| 1st Call Date |
| Price |
| Annual Dividend |
| Current Yield |
| FTF Cumulative Redeemable |
| 7.500% |
| 8/15/2024 |
| $20.50 |
| $1.88 |
| 9.15% |
| FTF Cumulative Redeemable |
| 7.125% |
| 8/15/2024 |
| $19.49 |
| $1.78 |
| 9.14% |
| FTF Cumulative Redeemable |
| 6.375% |
| 2/15/2025 |
| $17.35 |
| $1.59 |
| 9.19% |
| FTF Cumulative Redeemable |
| 7.000% |
| 11/15/2026 |
| $18.75 |
| $1.75 |
| 9.33% |
| Non-callable Cumulative Convertible |
| 7.900% |
| -- |
| $24.86 |
| $1.98 |
| 7.94% |
| Fixed-to-floating Cumulative Redeemable |
| 8.625% |
| 7/30/2024 |
| $20.57 |
| $2.16 |
| 10.48% |
| Fixed Cumulative Redeemable |
| 7.875% |
| 5/21/2026 |
| $18.97 |
| $1.97 |
| 10.38% |
| Fixed Cumulative Redeemable |
| 6.250% |
| 6/14/2026 |
| $15.95 |
| $1.56 |
| 9.80% |
| Average |
| 7.331% |
| 9.43% |
In Conclusion
Based on my recent review of different preferred shares it seems like RITM’s offer relatively good value. They are well secured in the balance sheet and RITM does not appear to be in any immediate cash-flow or liquidity challenges. With a slightly above average yield compared to the broader range of preferred securities overall, these may be an opportunity.
Their debt moving forward is something that I would monitor though investors are sure to get a warning sign if there are issues. The reason being is that the common stock pays out a 12.5% yield itself. If there are liquidity issues the company could free up cash simply by cutting the dividend providing a sort of canary in the coal mine for preferred owners.
A recent example of this comes from a peer residential-focused mREIT Invesco Mortgage ( IVR ) which cut their quarterly dividend from $0.65 to $0.40 (-38.5%) earlier this week. With IVR trading at $10.66 the forward annualized dividend yield still sits at 15% after the cut. Back in September 2022 I suggested that for those invested in IVR a move to their preferreds would provide a much safer dividend without the same capital risk.
A dividend cut actually makes the two IVR preferred shares ( IVR.PB and IVR.PC ) more attractive as that capital is retained. For IVR preferred owners they actually saw their shares see slight price appreciation on the news. But perhaps most importantly, they are given a data point into the company’s health which can help them determine if the preferreds are still a good option.
Rithm Capital is not in the same situation. They do not appear to be facing a dividend cut but if that were to come to pass preferreds would be safer as a result. And that gives owners an opportunity to reevaluate their position depending upon the state of affairs if such a cut were to happen.
All in all, the preferred shares of RITM all offer about the same opportunity at present. The D series shares trade with the highest current yield but only slight. And this is likely mitigated by the earlier floating features of the other three. Someone who is interested in these preferreds may be served by buying an equal proportion of each as a basket position.
For further details see:
Rithm Capital: Four Of A Kind 9% Yielding Preferreds