NYMTZ - Rithm Capital's Sector Comparative Analysis - Part 2 (Includes Q1 2024 + Q2 2024 Dividend Projection)
2023-12-28 09:00:00 ET
Summary
- This article compares RITM’s recent dividend per share rates, yield percentages, and several dividend sustainability metrics to 19 mREIT peers.
- This includes an analysis of RITM’s quarterly core earnings/earnings available for distribution (“EAD”), which directly impacts the company's dividend sustainability.
- This article also projects RITM’s dividend sustainability for Q1 - Q2 2024.
- With the market’s recent rally, RITM has moved within my/our appropriately valued range (previously undervalued). RITM’s recommendation and per-share ranges are provided in the article.
- My current RITM buy, sell, or hold recommendation (based on a valuation methodology) and current BV projection are stated in the “Conclusions Drawn” section.
Focus of Article:
The focus of this two-part article is to provide a very detailed analysis comparing Rithm Capital Corp. (RITM) to 19 other mortgage real estate investment trust (mREIT) peers I currently fully cover. I am writing this two-part article due to the continued requests that such an analysis be specifically performed on RITM and some of the company's mREIT peers at periodic intervals. For readers who just want the summarized conclusions/results, I would suggest to scroll down to the "Conclusions Drawn" section at the bottom of each part of the article.
PART 1 of this article analyzed RITM's recent results and compared several of the company's metrics to 19 mREIT peers. PART 1 also showed how RITM's book value ("BV") as of 9/30/2023 compared to the 19 other mREIT peers. PART 1 helps lead to a better understanding of the topics and analysis that will be discussed in PART 2. The link to PART 1's analysis is provided below:
Investing Group Version (Expanded Analytics):
Public Version:
The focus of PART 2 of this article is to compare RITM's recent dividend per share rates, yield percentages, and several dividend sustainability metrics to 19 mREIT peers. This analysis will show recent past data with supporting documentation within Table 9 below. This article will also discuss RITM's dividend sustainability which is partially based on the metrics outlined in Table 9. A more in-depth analysis of RITM's dividend sustainability will be provided in Table 10 below.
By analyzing these metrics, one will better understand which mREIT generally has a safer dividend rate going forward versus other peers who generally have a higher risk for a dividend decrease or a higher probability of a dividend increase and/or a special periodic dividend being declared. When both back testing and projecting the metrics within this analysis, the results have continued to be proven extremely reliable. This is not the only data that should be examined to initiate a position within a particular stock/sector. However, I believe this analysis would be a good "starting-point" to begin a discussion on the topic. At the end of this article, there will be a conclusion regarding the following comparisons between RITM and the 19 mREIT peers: 1) trailing 12-month ("TTM") yields based on a stock price as of 12/22/2023 (including 1- and 5-year dividend change) ; 2) annual forward yield based on a stock price as of 12/22/2023 ; and 3) annual forward yield based on my estimated CURRENT BV (BV as of 12/22/2023) . I will also provide my current RITM BUY, SELL, or HOLD recommendation, price target, and dividend per share rate projection for the first and second quarters of 2024 .
Side Note: I believe there are several different classifications when it comes to mREIT companies. For purposes of this article series, I am focusing on 4. For readers who are new to my articles or for existing readers who need a "refresher" on several different mREIT classifications, please see PART 1 of this article (link provided above).
Dividend Per Share Rates and Yield Percentages Analysis - Overview:
Let us start this analysis by getting accustomed to the information provided in Table 9 below. This will be beneficial when comparing RITM to the 19 mREIT peers within this analysis.
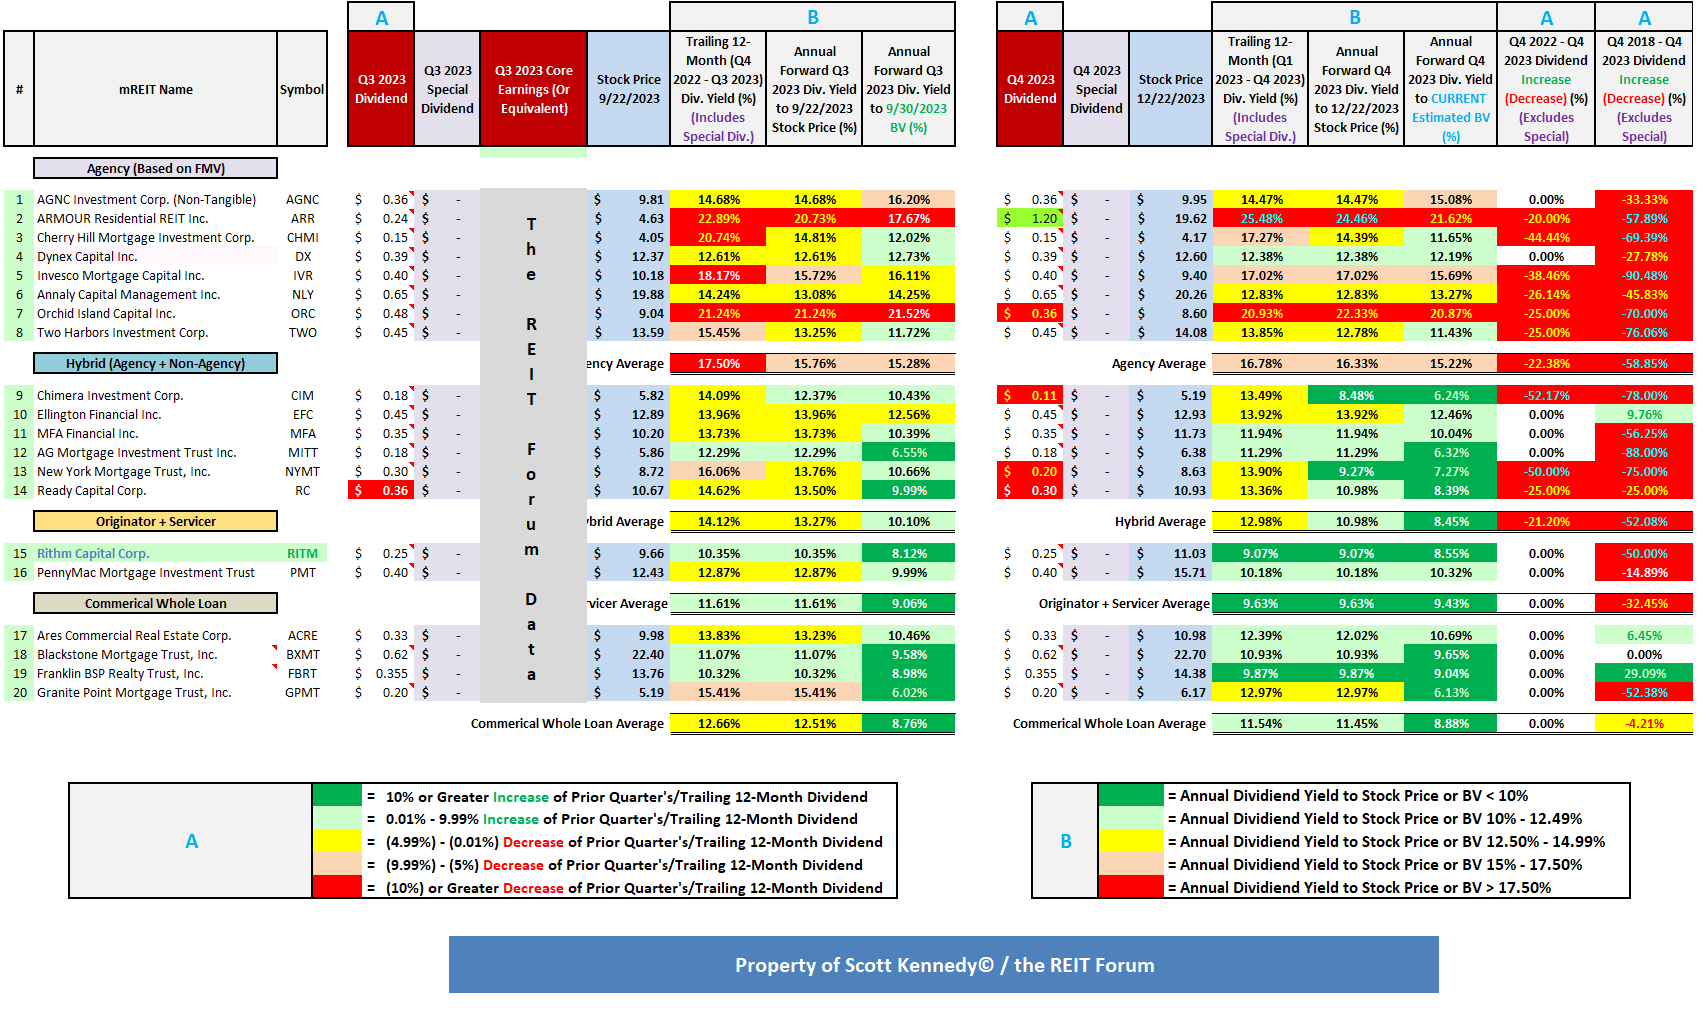
Table 9 - Dividend Per Share Rates and Yield Percentages
(Source: Table created by me, obtaining historical stock prices from NASDAQ and each company's dividend per share rates from the SEC's EDGAR Database )
Using Table 9 above as a reference, the following information is provided (see each corresponding column): 1) dividend per share rate for the third quarter of 2023 (for monthly dividend payers, the total monthly dividends during the quarter) ; 2) core earnings (or core earnings equivalent) for the third quarter of 2023 ; 3) stock price as of 9/22/2023 ; 4) TTM dividend yield (dividend per share rate from the fourth quarter of 2022 - third quarter of 2023) ; 5) annual forward dividend yield based on the dividend per share rate for the third quarter of 2023 using the stock price as of 9/22/2023 (for monthly dividend payers, the latest monthly dividend per share rate during the quarter) ; 6) annual forward dividend yield based on the dividend per share rate for the third quarter of 2023 using a BV as of 9/30/2023 (for monthly dividend payers, the latest monthly dividend per share rate during the quarter) ; 7) dividend per share rate for the fourth quarter of 2023 (for monthly dividend payers, the total monthly dividends during the quarter) ; 8) stock price as of 12/22/2023 ; 9) TTM dividend yield (dividend per share rate from the first quarter of 2023 - fourth quarter of 2023) ; 10) annual forward dividend yield based on the dividend per share rate for the fourth quarter of 2023 using the stock price as of 12/22/2023 (for monthly dividend payers, the latest monthly dividend per share rate during the quarter) ; 11) annual forward dividend yield based on the dividend per share rate for the fourth quarter of 2023 using estimated CURRENT BV (BV as of 12/22/2023) (for monthly dividend payers, the latest monthly dividend per share rate during the quarter) ; 12) dividend per share rate for the fourth quarter of 2023 versus the fourth quarter of 2022 (percentage fluctuation) ; and 13) dividend per share rate for the fourth quarter of 2023 versus the fourth quarter of 2018 (percentage fluctuation; shows post-COVID-19 impact to each company's dividend).
As of 12/22/2023, ARMOUR Residential REIT Inc. (ARR), Dynex Capital Inc. (DX), and New York Mortgage Trust, Inc. (NYMT) had a stock price that "reset" lower regarding each company's monthly/quarterly dividend accrual. In other words, each company's "ex-dividend date" for December 2023/the fourth quarter of 2023 had already occurred.
As of 12/22/2023, RITM, AGNC Investment Corp. (AGNC), Cherry Hill Mortgage Investment Corp. (CHMI), Invesco Mortgage Capital Inc. (IVR), Annaly Capital Management Inc. (NLY), Orchid Island Capital Inc. (ORC), Two Harbors Investment Corp. (TWO), Chimera Investment Corp. (CIM), Ellington Financial Inc. (EFC), MFA Financial Inc. (MFA), AG Mortgage Investment Trust Inc. (MITT), Ready Capital Corp. (RC), PennyMac Mortgage Investment Trust (PMT), Ares Commercial Real Estate Corp. (ACRE), Blackstone Mortgage Trust, Inc. (BXMT), Franklin BSP Realty Trust, Inc. (FBRT), and Granite Point Mortgage Trust, Inc. (GPMT) had a stock price that had not reset lower in reference to the company's December 2023/the fourth quarter of 2023 dividend accrual. Readers should take these points into consideration as the analysis is presented below. Let us now begin the comparative analysis between RITM and the 19 mREIT peers.
Analysis of RITM:
RITM increased the company's dividend from $0.35 per common share during the third quarter of 2014 to $0.50 per common share by the fourth quarter of 2019. This consisted of gradual dividend increases over this span of approximately 5 years. However, along with a majority of sector peers, RITM cautiously reduced the company's quarterly dividend to just $0.05 per common share during the first quarter of 2020 as a direct result of fear surrounding the COVID-19 "pandemic panic" . During this timeframe, prior to the Federal ("Fed") Reserve's quick, decisive action to calm markets through both interest rate and monetary policy, repurchase ("repo") agreement and hedging counterparties quickly (and incorrectly in my opinion) initiated margins calls on most sector peers which created a "snowball" effect on this specific market. This included both agency and non-agency mortgage-related investments. In other words, there was a quick, sharp leverage/liquidity crisis across certain pockets of credit markets where certain assets/investments are used as collateral to underlying outstanding borrowings/debt. Most sector peers either voluntarily, or were forced, to deleverage and raise cash during this time period. Results varied greatly from peer-to-peer regarding the severity of each company's investment portfolio reduction.
Remember, at the time, an enormous amount of fear/speculation surrounded markets regarding future economic performance. Regarding RITM, this mainly pertained to residential housing issues; namely strains on mortgage servicers from the potential "influx" of missed mortgage payments and a servicer's responsibility to "front" principal and interest payments to investors (who are then reimbursed by government-sponsored enterprises [GSEs] regarding agency MSRs). In fact, several broader sector peers suspended dividends for several quarters out of an abundance of caution.
However, as fear/caution quickly subsided, RITM increased the company's dividend to $0.10, $0.15, and $0.20 per common share during the second, third, and fourth quarter of 2020, respectively. RITM subsequently increased the company's dividend to $0.25 per common share during the third quarter of 2021 which has remained constant since. I would remind readers that while many sector peers have reduced dividends over the past 2 years, RITM has been one of rare exceptions to this trend (especially when compared to the agency and hybrid mREIT sub-sectors).
Using Table 9 above as a reference, RITM declared a dividend of $0.25 per common share for the third quarter of 2023. This was an unchanged dividend decrease when compared to the prior quarter. RITM's stock price traded at $9.66 per share on 9/22/2023. When calculated, this was a TTM dividend yield of 10.35%, an annual forward yield to RITM's stock price as of 9/22/2023 of 10.35%, and an annual forward yield to the company's BV as of 9/30/2023 of 8.12%. When comparing each yield percentage to RITM's originator + servicer mREIT peer within this analysis, the company's TTM dividend yield percentage and annual forward yield percentage based on its stock price were modestly (at or greater than 1.00% but less than 2.00%) below average while its annual forward yield percentage based on its BV as of 9/30/2023 was slightly (at or greater than 0.50% but less than 1.00%) below average.
As was discussed in PART 1 of this article, RITM's at-risk leverage ratio (on- and off-balance sheet) was lower when compared to the company's lone sub-sector peer within this analysis, PMT. Historically speaking, RITM has typically run lower leverage versus PMT. From charting past trends, typically a leverage ratio has equated to below average dividend yield percentages. Of course, there are various other factors at play regarding dividend sustainability (especially in light of the events surrounding the COVID-19 pandemic panic back in March 2020). However, a company's leverage ratio is one "general" metric which I believe should be analyzed.
I continue to believe an important metric to analyze when assessing RITM's near-term dividend sustainability is the company's quarterly core earnings. RITM's earnings available for distribution ("EAD") is now the equivalent to the company's previously disclosed core earnings. As such, the terms are interchangeable within this article. Currently, RITM's core earnings/EAD is the closest metric to the company's "true earnings power" regarding its investment portfolio's performance. To explain/discuss this metric, Table 10 is provided below.
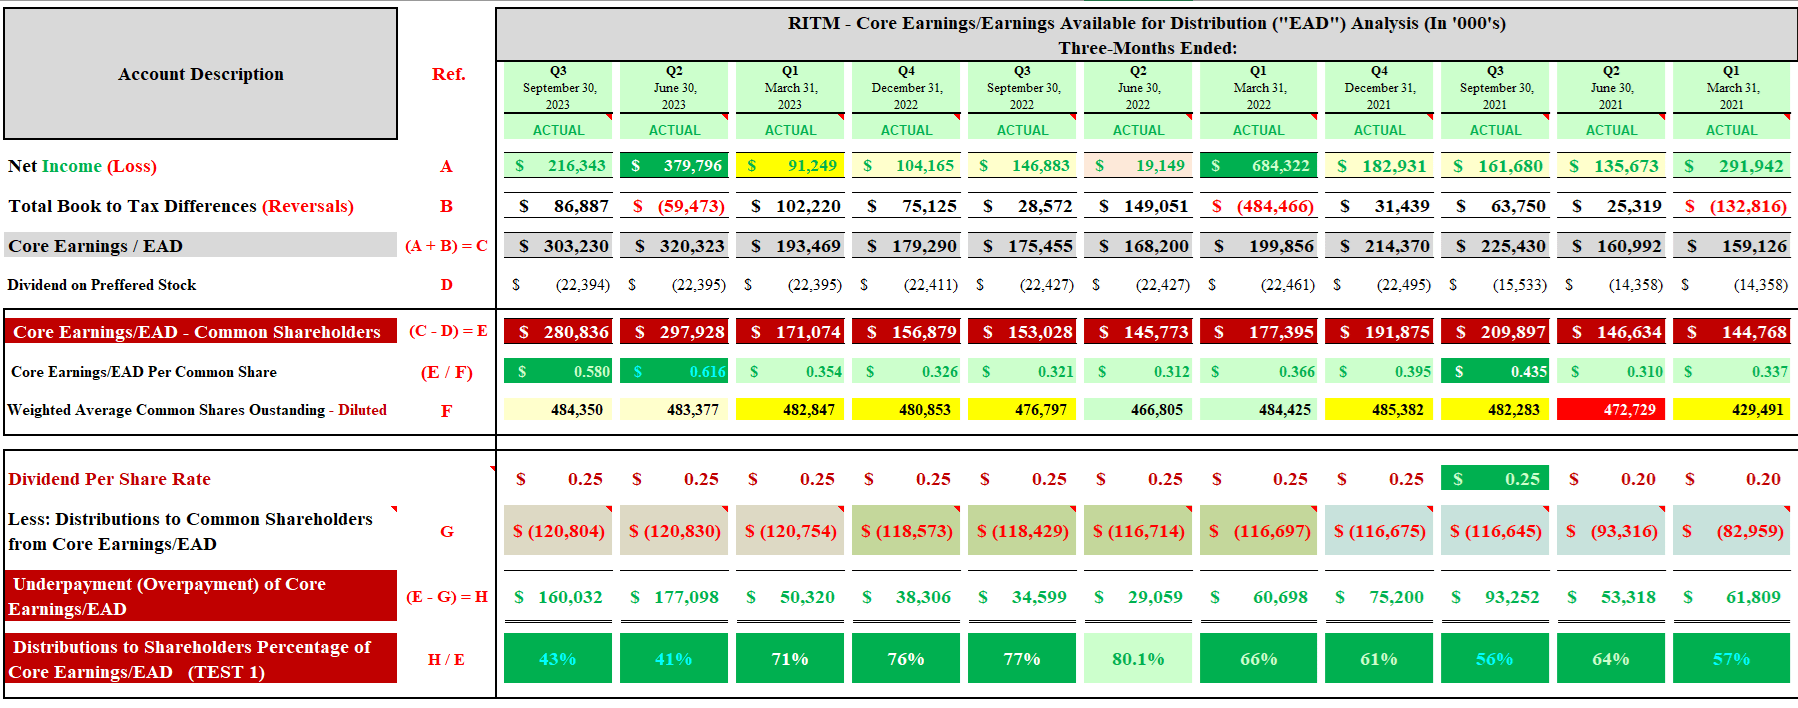
Table 10 - RITM Quarterly Core Earnings/EAD Analysis (Q1 2021 - Q3 2023)
(Source: Table created by me, partially using data obtained from RITM's quarterly shareholder presentation for the first quarter of 2021 - third quarter of 2023 )
Using Table 10 above as a reference, RITM reported core earnings/EAD available to common shareholders of $144.8, $146.6, $209.9, and $191.9 million for the first, second, third, and fourth quarter of 2021, respectively (see red reference "E" ). When calculated, RITM had core earnings/EAD available to common shareholders of $0.34, $0.31, $0.44, and $0.40 per share, respectively (see red reference "E / F" ). These figures were notably above the company's dividend of $0.20, $0.20, $0.25, and $0.25 per common share for the first, second, third, and fourth quarter of 2021, respectively. This calculates to a quarterly dividend distributions payout ratio of 57%, 64%, 56%, and 61% for the first, second, third, and fourth quarter of 2021, respectively (see red reference "H / E" ). Simply put, a very attractive quarterly dividend distributions payout ratio throughout 2021; even after a dividend increase of $0.05 per common share during the third quarter of 2021.
Moving to 2022, RITM reported core earnings/EAD available to common shareholders of $177.4, $145.8, $153.0, and $156.9 million for the first, second, third, and fourth quarter of 2022, respectively. When calculated, RITM had core earnings/EAD available to common shareholders of $0.37, $0.31, $0.32, and $0.33 per share, respectively. This calculates to a quarterly dividend distributions payout ratio of 66%, 80%, 77%, and 76% for the first, second, third, and fourth quarter of 2022, respectively. Simply put, an attractive - very attractive quarterly dividend distributions payout ratio throughout 2022. This even includes the fact short-term rates/borrowing costs rapidly increased during 2022.
Moving to 2023, RITM reported quarterly core earnings/EAD available to common shareholders of $171.1, $297.9, and $280.8 million for the first, second, and third quarter of 2023, respectively. When calculated, RITM had core earnings/EAD available to common shareholders of $0.35, $0.62, and $0.58 per share, respectively. This calculates to a quarterly dividend distributions payout ratio of 71%, 41%, and 43% for the first, second, and third quarter of 2023, respectively. Simply put, a very attractive quarterly dividend distributions payout ratio during the first 3 quarters of 2023.
However, to remain non-bias, when excluding a one-time benefit of $0.20 and $0.15 per common share in direct relation to the sale of excess MSRs during the second and third quarter of 2023, RITM reported adjusted core earnings/EAD of $0.42 and $0.43 per common share for the second and third quarter of 2023, respectively. Still, this calculates to a quarterly dividend distributions payout ratio of 60% and 58% for the second and third quarter of 2023, respectively.
Repurchase agreement ("repo") financing rates should peak in late 2023. Borrowing/Financing rates outside repo agreements should peak in early 2024. Net interest spreads across the broader sector will likely "bottom out" towards year-end 2023. Then, a slow, gradual increase will likely begin in early 2024. This also considers the entire derivatives side of the equation.
Once again using Table 9 as a reference, RITM declared a dividend of $0.25 per share for the fourth quarter of 2023. This was an unchanged dividend when compared to the prior quarter. RITM's stock price traded at $11.03 per share on 12/22/2023. When calculated, this was a TTM dividend yield of 9.07%, an annual forward yield to RITM's stock price as of 12/22/2023 of 9.07%, and an annual forward yield to the company's estimated CURRENT BV of 8.55%. When comparing each yield percentage to RITM's originator + servicer mREIT peer within this analysis, the company's TTM dividend yield percentage, annual forward yield percentage based on its stock price, and its annual forward yield percentage based on its estimated CURRENT BV were slightly below average. Going forward, I believe RITM should have an annual forward yield near the originator + servicer mREIT average. As such, RITM continues to have a notable "cushion" regarding future dividend sustainability ; even if there is a modest decrease to the company's core earnings/EAD during late 2023 - 2024.
A Couple Comparisons Between RITM and the Company's 19 mREIT Peers in Ranking Order:
Investing Group Feature
Along with identifying very high yields in Table 11, I believe Table 12 only solidifies more caution/risk should currently be assigned to ARR and ORC. We already know ARR declared a notable dividend reduction in January 2024 from $0.40 to $0.24 per common share. However, Tables 11 and 12 had "foreshadowed" this notable dividend reduction since early 2023. In addition, even with the fairly recent ORC monthly reduction from $0.16 to $0.12 per common share, ORC's annual forward dividend yield (relative to estimated CURRENT BV) remains very high and needs continued monitoring. As is always the case, this is something I/we will continuously monitor as 2024 unfolds.
I would point out ORC accounts for the company's premium amortization expense equivalent differently when compared to its agency mREIT sub-sector peers. First, this leads to timing differences which can "prop up" weighted average yields during certain interest rate cycles. As such, ORC's yield percentages continue to be above the agency mREIT sub-sector average. Second, this can "appear to buoy" ORC net spread metrics when, in reality, a reclassification of the company's equivalent to premium amortization expense would show a much more modest net spread income metric. This is also typically why a larger than average agency mREIT percentage of ORC's dividend declarations over the past several years have been classified as a "return on capital" ("ROC") distribution. Simply put, ORC continues to distribute dividends in excess of the company's annual REIT taxable income ("AREITTI"). However, the fairly recent (70%) dividend reduction over the past 5 years has notably lowered this overdistribution. Further discussion of this ORC topic is beyond a RITM sector comparison article (also has been extensively covered in prior ORC mREIT articles over the years).
The severity of RC's (17%) dividend decrease during the fourth quarter of 2023 was disappointing and was directly in relation to the continued underperformance within the company's acquired Broadmark Realty Capital Inc. (previously BRMK) investments. In addition, the BRMK merger resulted in a notable reduction in leverage and RC obtained a good amount of non-/underperforming-assets. Now some readers may be asking well why did RC acquire BRMK if said assets are producing a low yield (or no yield at all)? The answer is pretty straightforward. Remember, RC acquired BRMK at a very notable discount so acquiring real estate owned ("REO")/troubled assets was always part of the process. The purchase price basically justified the acquisition. The value is when RC eventually sells these assets and redeploys this newly-acquired capital into the company's "niche" investments (and builds leverage back up to more historical levels). However, this process/strategy has simply taken longer versus what RC originally anticipated which is disappointing. I continue to project future RC earnings growth but this is going to take some additional time to play out.
Conclusions Drawn (PART 2):
PART 2 of this article compared RITM to 19 mREIT peers in regards to recent dividend per share rates, yield percentages, and several other dividend sustainability metrics. This article also discussed RITM's past dividend trends/history. Using Table 9 as a reference, the following were the recent dividend per share rate and yield percentages for RITM:
RITM: $0.25 per common share dividend for the fourth quarter of 2023; 9.07% TTM dividend yield; 9.07% annual forward yield to the company's stock price as of 12/22/2023; and 8.55% annual forward yield to my projected CURRENT BV.
When combining this data along with metrics within Table 10 (core earnings/EAD) and other modeling sources, the following probability regarding RITM's near-term dividend sustainability is provided:
RITM: Very High (90%) probability of a stable dividend for Q1 2024
RITM: Very High (90%) probability of stable dividend for Q2 2024
Q4 2023 Projected Adjusted Core Earnings/EAD: $0.380 - $0.430 per common share
Preliminary Q1 2024 Projected Adjusted Core Earnings/EAD: $0.365 - $0.415 per common share*
* = Assuming a RITM spin-off does not occur prior to the end of the first quarter of 2024
As explained in PART 1 of this article, RITM's portfolio composition, leverage, borrowing costs, hedging coverage ratio (risk management strategy), and prepayment speeds also need to be considered when discussing the company's core earnings/EAD.
While I believe RITM's core earnings/EAD will slightly decrease over the next couple of quarters as short-term funding costs continue to slightly rise while MSR prepayment speeds "tick higher" , as evidenced in Table 10 this mREIT has a very large "cushion" regarding dividend sustainability.
20 mREIT Dividend Projections for Q1 2024:
Investing Group Feature
My Buy, Sell, or Hold Recommendation:
From the analysis provided above, including additional catalysts/factors not discussed within this article, I currently rate RITM as a SELL when I believe the company's stock price is trading at or greater than a 5% premium to my projected CURRENT BV (BV as of 12/22/2023; $11.70 per share), a HOLD when trading at less than a 5% premium through less than a (7.5%) discount to my projected CURRENT BV, and a BUY when trading at or greater than a (7.5%) discount to my projected CURRENT BV.
Therefore, with a closing stock price of $11.03 per common share as of 12/22/2023, I currently rate RITM as APPROPRIATELY VALUED from a stock price perspective .
As such, I currently believe RITM is a HOLD recommendation.
My current price target for RITM is approximately $12.30 per common share. This is currently the price where my recommendation would change to OVERVALUED/a SELL recommendation. The current price where my classification/recommendation would change to APPROPRIATELY VALUED/a HOLD recommendation is approximately $10.80 per common share. Put another way, the following are my CURRENT BUY, SELL, or HOLD per share recommendation ranges (subscribers get this type of data on all 20 mREIT stocks I currently cover on a weekly basis):
$12.30 per share or above = SELL
$10.81 - $12.29 per share = HOLD
$9.36 - $10.80 per share = BUY
$9.35 per share or below = STRONG BUY
Along with the data presented within this article, this recommendation considers the following mREIT catalysts/factors: 1) projected future MBS/investment price movements ; 2) projected future derivative valuations ; and 3) projected near-term (up to 1-year) dividend per share rates. As discussed earlier, this includes all recent, current, and projected macroeconomic indicators and FOMC monetary policy.
My Personal RITM Past + Current Stock Disclosures:
The following are my RITM (formerly NRZ) past and current stock disclosures and total returns since I have been writing on Seeking Alpha:
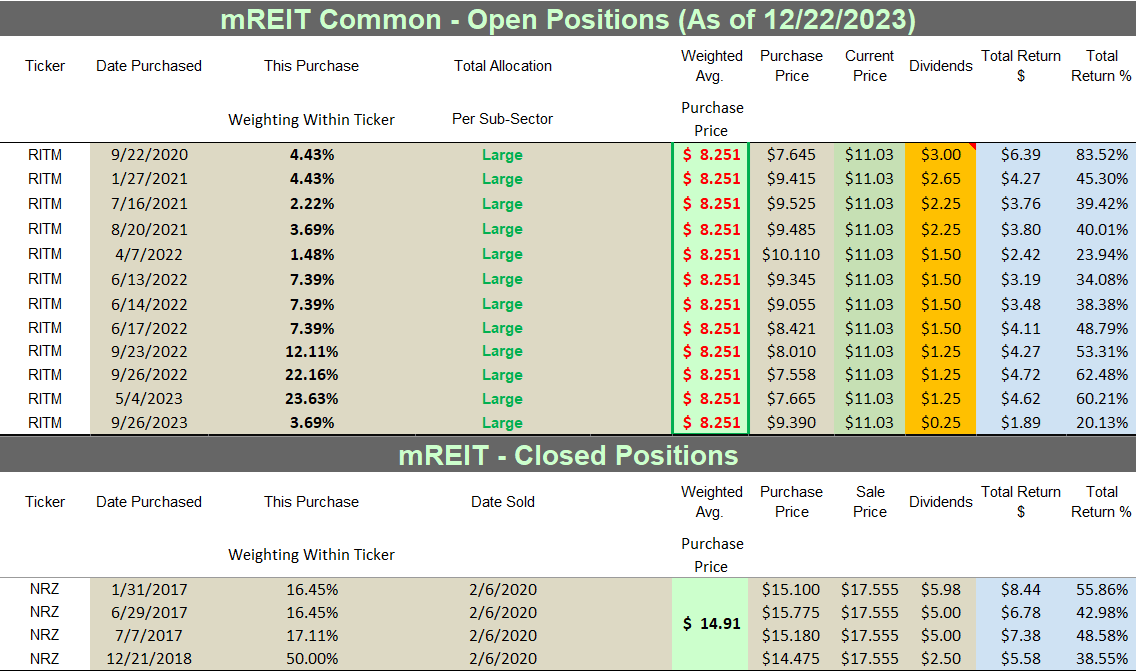
Table 14 - RITM Past + Current Stock Disclosures/Returns
Source: Taken Directly from the REIT Forum's © Spreadsheets/Data
Final Note: All trades/investments I have performed over the past 7+ years have been disclosed to readers in "real time" (that day at the latest) via either the StockTalks feature of Seeking Alpha or, more recently, the "live chat" feature of our Investing Group (which cannot be changed/altered). Through these resources, readers can look up all my prior disclosures (buys/sells) regarding all companies I cover here at Seeking Alpha (see my profile page for a list of all stocks covered). Through StockTalk disclosures and/or the live chat feature of our Investing Group, at the end of November 2023 I had an unrealized/realized gain "success rate" of 89.9% and a total return (includes dividends received) success rate of 97.1% out of 69 total past and present mREIT and business development company ( "BDC") positions (updated monthly; multiple purchases/sales in one stock count as one overall position until fully closed out). I encourage other Seeking Alpha contributors to provide real time buy and sell updates for their readers/subscribers which would ultimately lead to greater transparency/credibility. Beginning in January 2020, I transitioned all my real-time purchase and sale disclosures solely to members of our Investing Group. All applicable public articles will still have my "main ticker" purchase and sale disclosures (just not real-time alerts).
Simply put, a contributor's/team's recommendation track record should "count for something" and should always be considered when it comes to credibility/successful investing.
Understanding My/Our Valuation Methodology Regarding mREIT Common and BDC Stocks:
The basic "premise" around my/our recommendations in the mREIT common and BDC sectors is value. Regarding operational performance over the long-term, there are above average, average, and below average mREIT and BDC stocks. That said, better-performing mREIT and BDC peers can be expensive to own, as well as being cheap. Just because a well-performing stock outperforms the company's sector peers over the long-term, this does not mean this stock should be owned at any price. As with any stock, there is a price range where the valuation is cheap, a price where the valuation is expensive, and a price where the valuation is appropriate. The same holds true with all mREIT common and BDC peers. As such, regarding my/our investing methodology, each mREIT common and BDC peer has their own unique BUY, SELL, or HOLD recommendation range (relative to estimated CURRENT BV/NAV). The better-performing mREITs and BDCs typically have a recommendation range at a premium to BV/NAV (varying percentages based on overall outperformance) and vice versa with the average/underperforming mREITs and BDCs (typically at a discount to estimated CURRENT BV/NAV).
Each company's recommendation range is "pegged" to estimated CURRENT BV/NAV because this way subscribers/readers can track when each mREIT and BDC peer moves within the assigned recommendation ranges (daily if desired). That said, the underlying reasoning why I/we place each mREIT and BDC recommendation range at a different premium or (discount) to estimated CURRENT BV/NAV is based on roughly 15-20 catalysts which include both macroeconomic catalysts/factors and company-specific catalysts/factors (both positive and negative). This investing strategy is not for all market participants. For instance, not likely a "good fit" for extremely passive investors. For example, investors holding a position in a particular stock, no matter the price, for say a period of 5+ years. However, as shown throughout my articles written here at Seeking Alpha since 2013, in the vast majority of instances I have been able to enhance my personal total returns and/or minimize my personal total losses from specifically implementing this particular investing valuation methodology. I hope this provides some added clarity/understanding for new subscribers/readers regarding my valuation methodology utilized in the mREIT common and BDC sectors.
Each investor's BUY, SELL, or HOLD decision is based on one's risk tolerance, time horizon, and dividend income goals. My personal recommendation will not fit each reader's current investing strategy. The factual information provided within this article is intended to help assist readers when it comes to investing strategies/decisions. Please disregard any minor "cosmetic" typos if/when applicable.
For further details see:
Rithm Capital's Sector Comparative Analysis - Part 2 (Includes Q1 2024 + Q2 2024 Dividend Projection)