ADYYF - RiverPark Long/Short Opportunity Fund Q2 2022 Quarterly Letter
Summary
- Founded in 2006 by Morty Schaja and Mitch Rubin, RiverPark manages research-driven, focused strategies in equities, fixed income and venture capital.
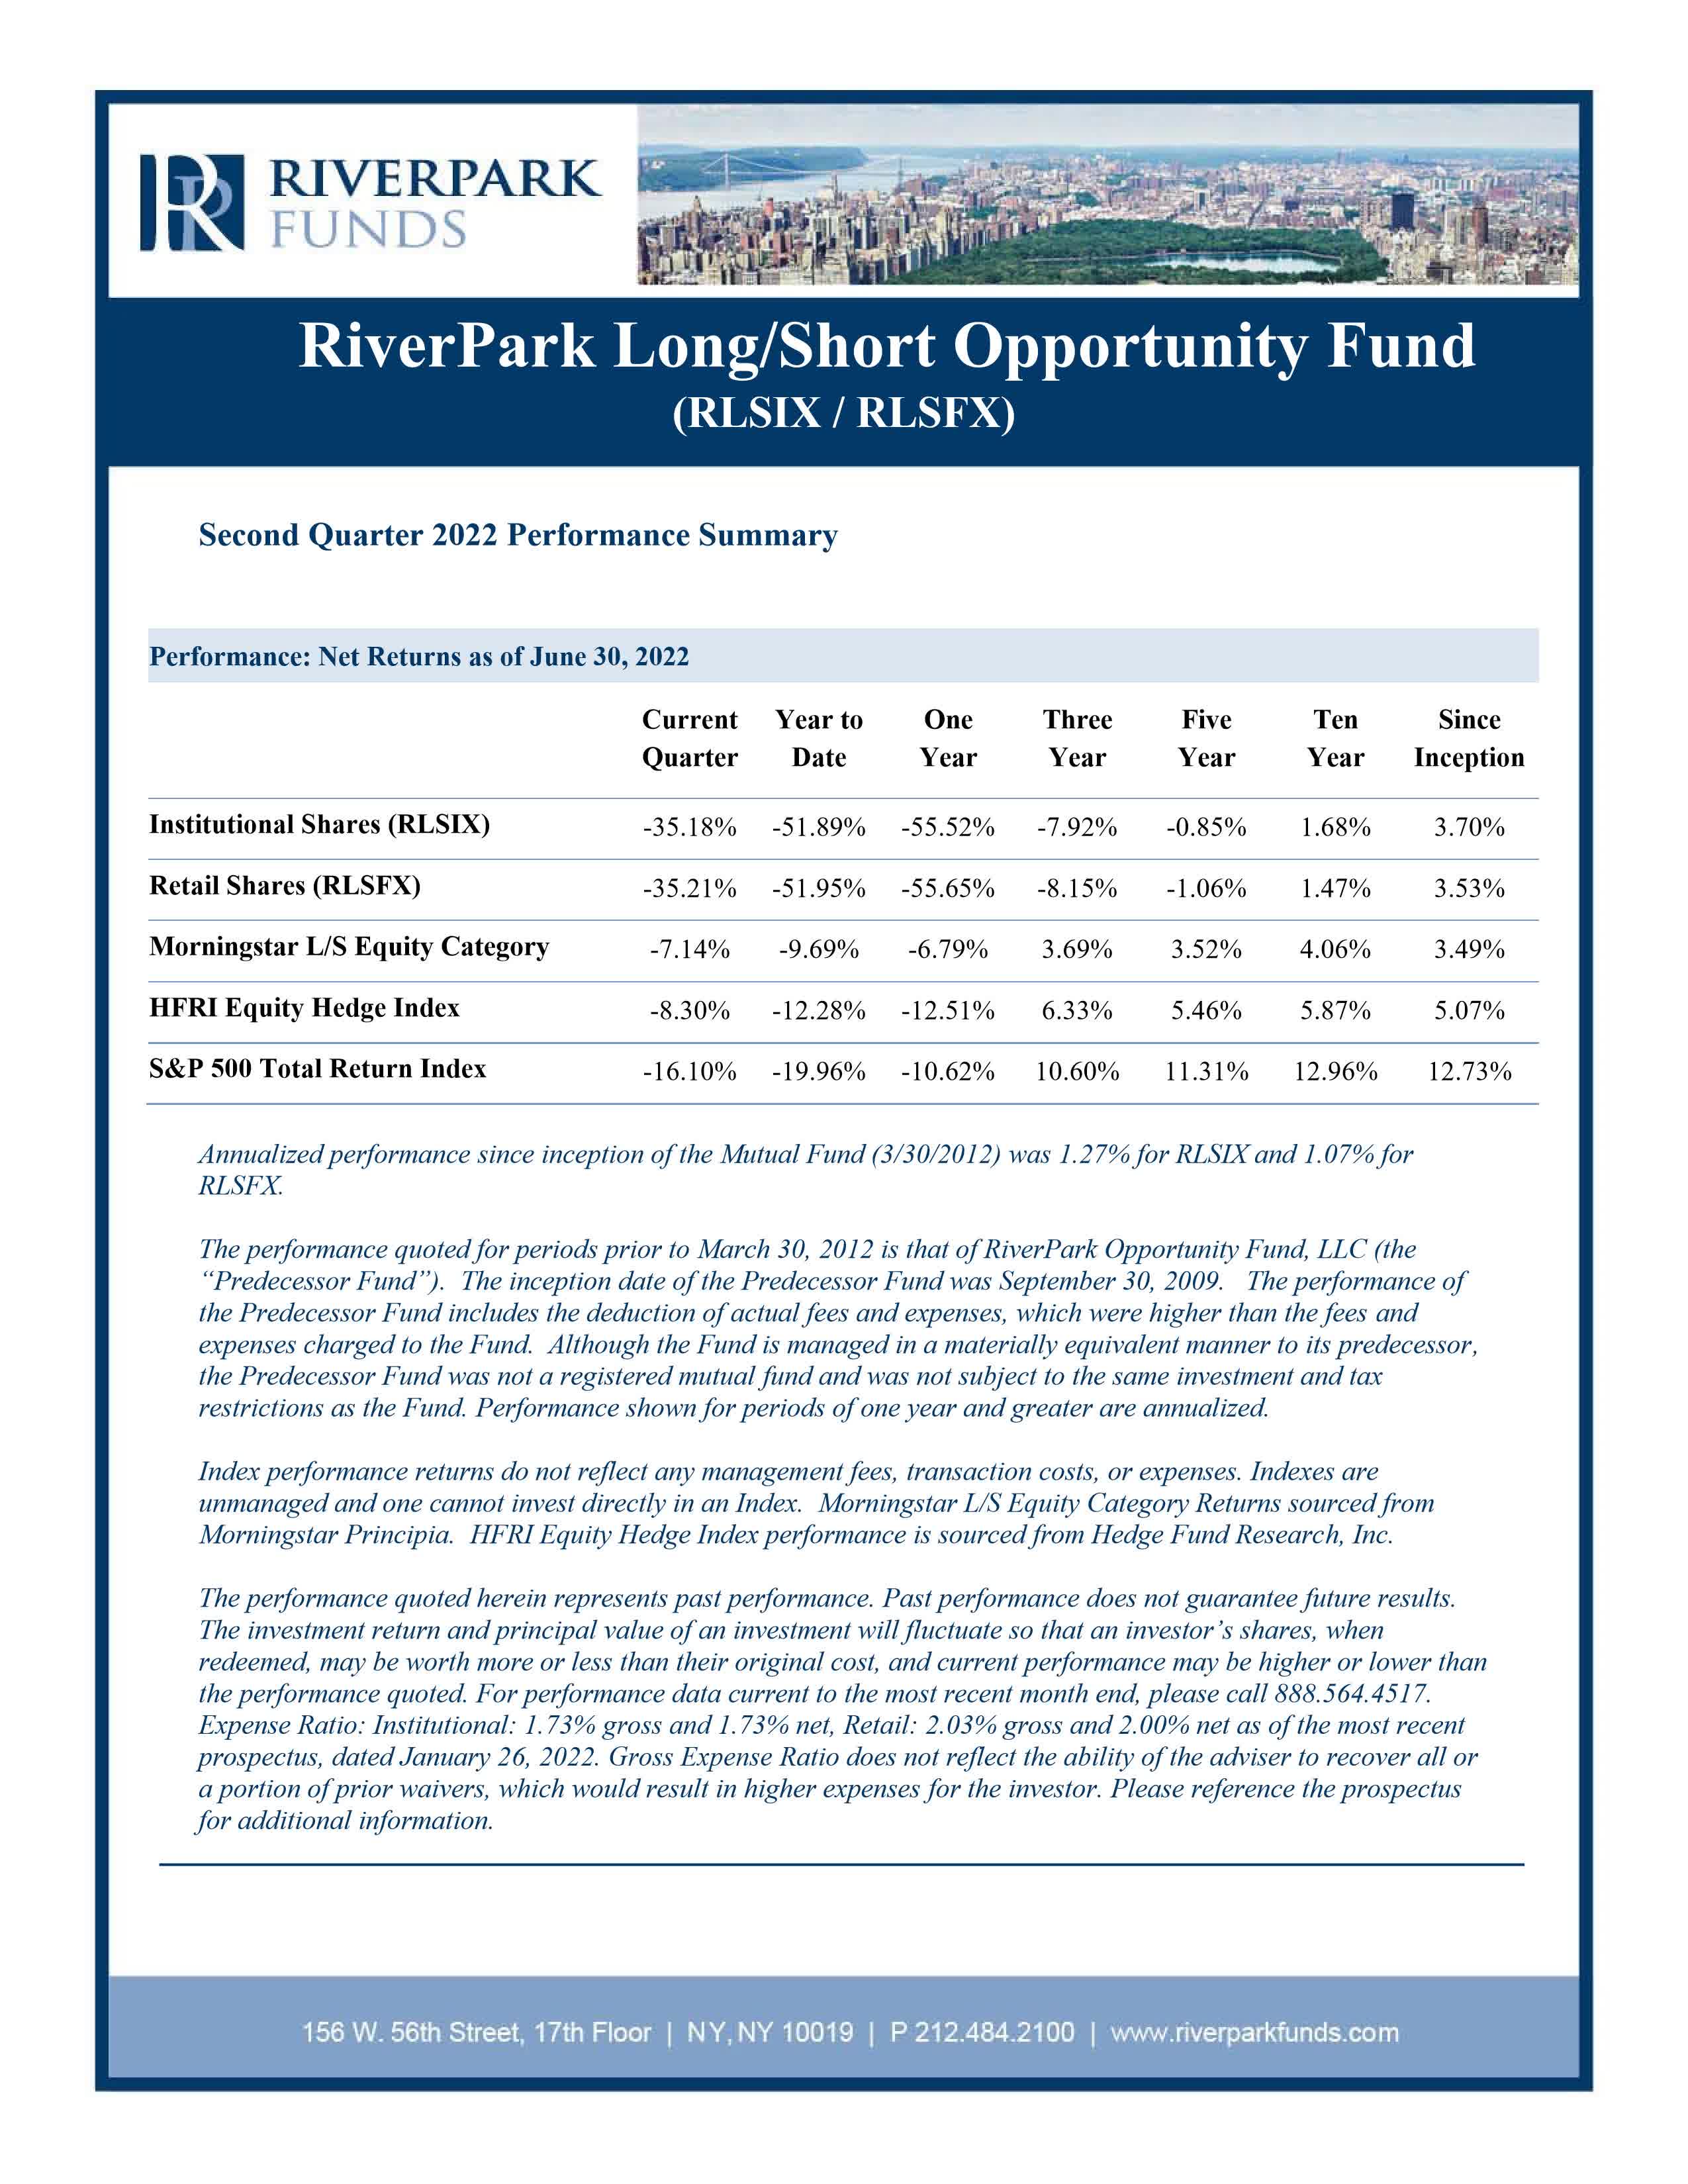
- Over the last three months, the Fund lost 35.2%, bringing our year-to-date loss to 51.9%, materially worse than any six-month performance period for the Fund since inception.
- The Fund did not achieve two of its key objectives – hedging market risk and managing downside volatility.
- While we are deeply disappointed by our recent losses, we believe that we are currently invested in an exceptional risk-reward portfolio.
The second quarter of 2022 was an historically difficult one for the broader markets and for our Fund.
Over the last three months, the Fund lost 35.2%, bringing our year-to-date loss to 51.9%, materially worse than any six-month performance period for the Fund since inception. Our results are also substantially worse than the declines suffered by the S&P 500 (down 20% for this year’s first six months), and most hedge funds (the Morningstar Long/Short Equity Category returned 7.1% for the quarter and 9.7% for this year’s first half, while the HFRI Equity Hedge Fund Index posted a loss of 8.3% for the quarter and 12.3% for the first half).
The Fund did not achieve two of its key objectives – hedging market risk and managing downside volatility. In hindsight, it is clear the dominant economic issues in this year’s first half have been universally negative for stocks – pandemic surges and new lock downs in China, continued disruption in supply chains, rising inflation, the Fed aggressively raising rates, the war in the Ukraine and an increasing risk of recession. And there is little doubt that the epicenter of the sell-off was in the high growth portions of the market on which we focus our long book: although the Nasdaq Composite fell “only” 30% in this year’s first half (22% in the second quarter), 30 of its largest companies declined more than 40% year to date, nearly 1,000 stocks declined more than 50%, and 243 declined more than 75%.
As we have discussed in recent letters, our strategy since the fall of 2021 has been to take advantage of what we believed was an overreaction by the market to macroeconomic events, thus creating what we saw as a buying opportunity in many of the higher growth businesses that we believed would enjoy substantial revenue and cash flow growth in the years to come. Our belief was that not only was inflation predominantly transitory, but more importantly, that our longs with significant competitive advantage would be best positioned to deal with inflation and maintain margins. We also believed that rising rates would have a marginal impact on valuations when compared to the growth in cash flows we were modelling for our longs in the years ahead. Of course, we didn’t anticipate the escalation of hostilities in Ukraine, nor the renewed lockdowns in China, both of which have postponed a resolution to the world’s supply chain problems, keeping inflation elevated. As a result, we failed to lower exposure to protect capital, and our instinct to take advantage of lower valuations was ill-timed, resulting in our worst performance since the Fund’s inception over ten years ago.
In reflecting on our recent results, we note first and foremost that our philosophy and process for managing individual positions within the Fund have remained the same - when we anticipate changes in the fundamentals of the companies in which we have developed an expertise, whether on the long or short side, we react quickly and decisively, to both protect capital and take advantage of investment opportunities. For example, in contrast to our investment decisions in recent quarters, we correctly anticipated the impact of COVID in 2020 on the fundamentals of both the companies in which we were long and short, thus allowing us to protect capital and take advantage of the ensuing market volatility to generate strong results. While we are humbled by our mis-trading the markets in 2022 to date, we maintain conviction in our investment approach and are confident in our ability to recoup losses as the year progresses.
As we enter the second half of the year, we have two predominant views. First, we believe that the macro landscape has evolved materially over the last six months and a different narrative may dominate for the balance of the year and into 2023. Second, with the market’s dramatic sell off, many “babies were thrown out with the bathwater,” and we believe that these companies will lead the market out of its downturn as they continue to have exceptional longer-term fundamentals, reasonable near-term valuations and enormous and growing piles of excess cash. These are precisely the businesses in which our long book is concentrated, and, while we raised our return and cash flow projection hurdles, we have decided to remain fully invested in our long book.
Moreover, we believe that the market will begin to punish those companies with lower top-line growth and high debt balances. These stocks have significant downside equity value risk should they face slowing demand, still elevated costs and higher rates. We have added and pressed our shorts in these businesses and industries.
It is this thinking that informs our current positioning (described in more detail below) and gives us confidence in our ability to rebound from our recent losses.
Long Book Strategy
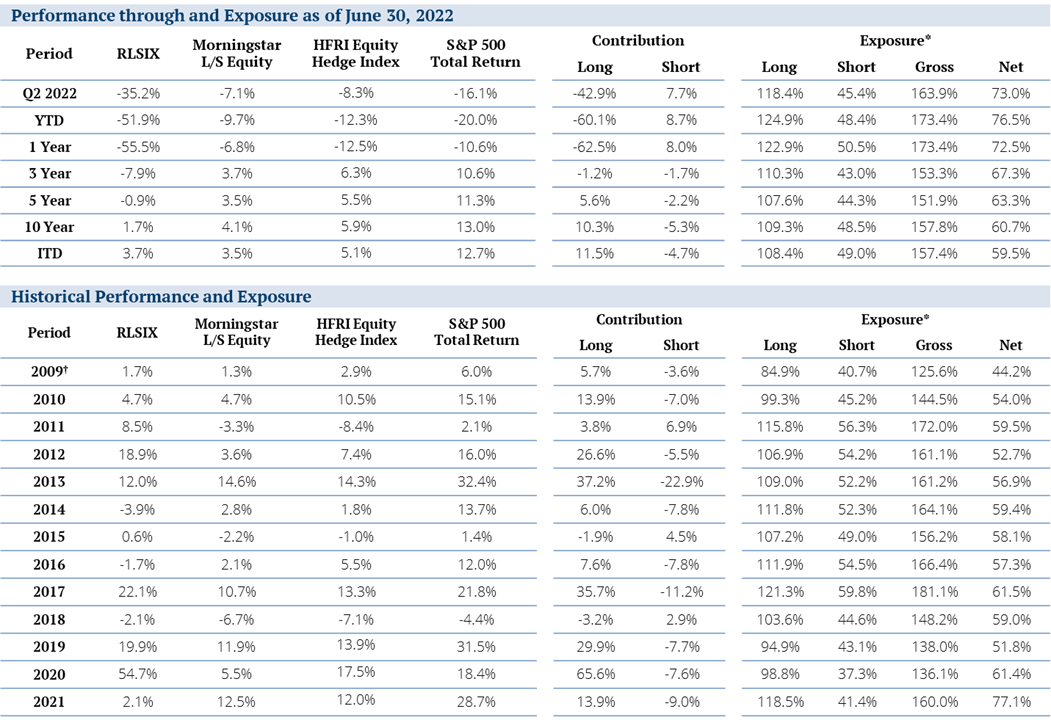
Certainly, the primary driver of our year-to-date losses has been our long book. During the quarter, our longs declined more than 30% which, given the leverage we have used year to date (averaging long exposure of about 120% for the year) has resulted in loss contributions of 42.5% in the quarter and 60.1% year to date – materially worse than any other period in our careers. Although our short book has given us some positive contribution this year and quarter (+7.7% this quarter, and +8.7% year to date), that protection has been far too small.
Our rationale for our long exposure and our stock picking has not changed. We have always invested in growth companies that we believe will generate all or most of their enterprise value in excess cash over a reasonably short period of time. We believe that such businesses offer the best of both worlds - the upside of compounding growth with the downside protection normally associated with lower volatility value stocks. [1] Not only do we believe that companies that can grow substantially while generating huge amounts of excess cash [2] are rare, but the opportunity to buy them at distressed prices is even rarer.
Generally, earlier-stage growth companies are voracious users of cash, and only mature companies with slower growth expectations and low capital expenditures become cash cows. The excess cash of these cash cows, whether used to support major buybacks, higher dividends, M&A or just simply sitting on the balance sheet, is thought to be the ultimate margin of safety. Value investors are often willing to give up excess growth in pursuit of fortress balance sheets and cheaper stock prices, while growth investors are generally comfortable with lower rates of cash accumulation and higher multiples as they seek businesses that can compound revenue at high rates for long periods of time. While in normal markets we generally must make a calculated trade-off between elevated current multiples and the potential for material longer term returns, today, there are a select group of firms that we believe have both enormous long-term cash generating potential as well as attractive nearer term valuation support that should make them stalwarts in both the months and the years to come.
Fortunately (or unfortunately), we have been through several of these painful drawdowns in the past, and they have always offered up spectacular bargains. For example, the Dot Com bust in 2001-2002 caused the shares of Amazon to decline 93% from their previous high, long before the company’s eCommerce dominance was proved, and its AWS business was launched. Similarly, the 2008 financial crisis caused the stock price of Blackstone to decline to around $10 per share, a deep discount to its much-hyped IPO at $31 per share in 2007. In just the next few years the stock returned 150% from dividends alone and shareholders still owned a company whose assets under management are now up more than 10-fold since the time of its IPO.
As the market shifts its focus from concerns predominantly centered on inflation and an overheated economy to the potential for a painful recession, we believe that those companies with high secular demand products and services and asset and capital expenditure-light business models are the ones that may shift back into focus as the “ports in the storm.” These companies can often maintain their growth trajectories during more challenging economic times (while also passing cost increases on to their customers), as they generally offer products and services that help to lower costs and improve operations for their customers.
Given these features, we believe that the market leading secular growth companies in which we are invested will suffer less growth trajectory disruption than the many slower growth companies facing secular headwinds - especially those with large debt balances – that we are short. We believe that our current long book offers a particularly rare combination of high secular revenue growth, stable (if not growing) margins and asset light business models that will both continue to grow during an economic slow-down (if that is in the cards for the next several quarters) while also becoming ever “safer” as cash builds up on their balance sheets.
We have thus decided to maintain our elevated long book exposure, while at the same time refining our return hurdles (seeking more than “just” a double over the coming five years in every position) and we have removed any long positions that aren’t currently generating substantial excess near-term cash. [3] Following this re-balancing, we believe that we are invested in an exceptional group of businesses that will continue to exhibit strong growth through a potential economic slowdown and will also, from today’s prices, return almost 50% of their current enterprise values over the next five years and in excess 100% in free cash by the end of this decade.
| Cash = Margin of Safety |
| FCF 2022-2027/TEV |
| FCF 2022-2030/TEV |
| Pinterest Inc ( PINS ) |
| 108% |
| 264% |
| Zillow Group Inc ( Z ) |
| 93% |
| 170% |
| Twilio Inc ( TWLO ) |
| 77% |
| 226% |
| Uber Technologies Inc ( UBER ) |
| 71% |
| 183% |
| RingCentral Inc ( RNG ) |
| 70% |
| 174% |
| Snap Inc ( SNAP ) |
| 69% |
| 241% |
| Meta Platforms Inc ( META ) |
| 67% |
| 149% |
| Charles Schwab Corp/The ( SCHW ) |
| 66% |
| 122% |
| 57% |
| 118% |
| PayPal Holdings Inc ( PYPL ) |
| 56% |
| 109% |
| Blackstone Inc ( BX ) |
| 54% |
| 104% |
| NVIDIA Corp ( NVDA ) |
| 47% |
| 106% |
| Autodesk Inc ( ADSK ) |
| 47% |
| 94% |
| Block Inc ( SQ ) |
| 42% |
| 123% |
| Apple Inc ( AAPL ) |
| 41% |
| 76% |
| Adobe Inc ( ADBE ) |
| 39% |
| 76% |
| Teladoc Health Inc ( TDOC ) |
| 39% |
| 91% |
| Amazon.com Inc ( AMZN ) |
| 38% |
| 109% |
| Shopify Inc ( SHOP ) |
| 37% |
| 142% |
| NIKE Inc ( NKE ) |
| 34% |
| 64% |
| Microsoft Corp ( MSFT ) |
| 33% |
| 64% |
| Illumina Inc ( ILMN ) |
| 32% |
| 74% |
| KKR & Co Inc ( KKR ) |
| 31% |
| 58% |
| Adyen NV ( ADYEY ) |
| 30% |
| 76% |
| Intuitive Surgical Inc ( ISRG ) |
| 30% |
| 66% |
| Walt Disney Co/The ( DIS ) |
| 30% |
| 59% |
| Mastercard Inc ( MA ) |
| 29% |
| 55% |
| ServiceNow Inc ( NOW ) |
| 28% |
| 63% |
| Netflix Inc ( NFLX ) |
| 24% |
| 58% |
| Portfolio Average |
| 49% |
| 114% |
| Note: TEV source: Bloomberg and is total enterprise value at 6/30, which is market capitalization less cash, plus debt. Charles Schwab uses market capitalization instead of TEV as cash and debt are part of operations. FCF stands for free cash flow and uses RiverPark estimates. For Blackstone and KKR, we use Distributable earnings instead of Free Cash Flow. |
By concentrating our long book even more than usual in only “high quality cash flow compounders”at what we believe to be generationally attractive valuations, we believe we have materially increased both the return potential and the margin of safety for the long book for the months ahead.
Over 70% of our holdings (21 out of 29) are trading today at single digit multiples of our earnings projections five years out, with the entire portfolio trading at 8x our projected 2027 earnings. This compares to the S&P which is currently trading at 13x 2027 earnings. We believe that this valuation level and gap to the market (of both materially higher revenue growth and much lower out-year valuations) will provide the opportunity for both substantial price appreciation and strong relative performance after this bear market runs its course, as it inevitably will.
| Above Market Growth at Below Market Values
Note: 2027 revenue and EPS use RiverPark estimates. We use gross profit instead of revenue for Block due to pass-through costs. We use Fee-earning AUM instead of revenue for Blackstone and KKR. S&P 500 revenue growth rate and 2027 PE uses Bloomberg estimates through 2024 and RiverPark estimates, using historical long-term growth rates, for 2024-2027. Price as of 6/30/2022. |
Further below we offer a brief overview of the key growth plus cash flow investment characteristics of a five of our ten largest long holdings as well as two of our mid-cap holdings that are down the most this year.
Short Book Strategy
Our short book provided too little protection this year given that we mostly short secularly challenged, slower growth legacy incumbents, with limited short exposure to younger, high growth “story” stocks. In most markets, these story stocks often have significant upside risk, which we prefer to avoid. This year, however, the vast majority of our better shorts have come from the story stock universe – including this quarter’s largest contributors: Carvana ( CVNA ) , Affirm ( AFRM ), Trade Desk ( TTD ) and Coinbase ( COIN ). At the same time, many of the larger capitalization and slower growth legacy incumbents that we prefer to short held up relatively well over the last few months, as investors sought the “safety” of lower beta names.
We believe that this has created a compelling window to now press some shorts amongst these lower beta firms as we believe it is precisely such firms that are most at risk should the economy dip into an interest rate driven recession, and they now trade at higher relative valuations. These include several firms that have material debt balances, which we believe could be particularly negatively impacted in a higher rate/lower liquidity environment. These “economically sensitive shorts” encompass a wide range of businesses across several industries, including consumer packaged goods, telecom/cable, and industrial and business services firms that we believe are all on the wrong side of the creative destruction divide. We have also supplemented our single company short positions with select index shorts focused on the economically sensitive sectors of home builders, industrials, and brick and mortar retail. These indexes offer a more cost efficient and flexible way of increasing exposure specifically against the sectors that we believe to be most at risk in a higher rate/lower growth environment. We have also maintained a portion of our short book in growthier shorts that we believe have a flawed foundation or business model, and whose valuation, to us, remains elevated (including continuing shorts in Carvana, Trade Desk and Coinbase as well as small newer short positions in Roblox ( RBLX ) , ZoomInfo ( ZI ) and Unity Software ( U ) ).
At quarter-end, our short exposure was a relatively normal (for us) 44.1%, down from 62.4% at year-end 2021, but up from an all-time low of 17.0% at year-end 2020.
The Future
While we are deeply disappointed by our recent losses, we believe that we are currently invested in an exceptional risk-reward portfolio. We believe that our long book owns a fantastic cross section of long-term secular winners with materially growing cash balances now priced at generationally attractive prices, while our short book remains fully invested against companies and whole industries where we believe the economic landscape as well as the competitive destruction wave is building against them. We thus believe we are well positioned throughout both portfolios to recoup our recent losses and generate substantial gains on both sides in the months and years ahead.
Long Portfolio Investment Summaries
Below we offer a brief overview of the key growth plus cash flow investment characteristics of five of our top ten long holdings as well as two of our core mid-cap holdings that are down the most this year.
Amazon is a company that has been “reinventing normal” since its formation in 1994. In his 2015 shareholder letter, Jeff Bezos wrote that a dreamy business has at least four characteristics: “customers love it, it can grow to very large size, it has strong returns on capital, and it’s durable in time – with the potential to endure for decades.” [4] Jeff’s advice was that “When you find one of these, don’t just swipe right, get married.” Unlike most mere mortal businesses that are lucky to have one such business, at the time, Amazon had three. Today, Amazon has five dreamy businesses under its one roof: AWS, Marketplace, Prime, Advertising and Logistics. Notably, each of these businesses were planted as tiny seeds and have grown mainly organically, quickly into meaningfully large businesses. [5] [6] And, given management’s belief that it is still “Day 1” of the internet, their focus on relentless innovation, and the tiny seeds they have recently planted, more dreamy businesses may soon follow.
In each of its current businesses, Amazon is the (or is one of the top two or three) dominant force in the world. For example, Amazon leads online retail with 41% market share, while the next 'largest' 11 companies each have single digit market share. AWS has 33% share in the cloud infrastructure market, exceeding the market share of its two largest competitors, Microsoft ( MSFT ) and Google, combined. 6 In Prime (launched in 2005), AMZN has well over 200 million subscribers, [7] and with $31 billion of advertising revenue last year, AMZN is already the third largest advertising company (behind Google/YouTube and the Facebook family of apps). And finally, in its newest potential “dreamy” business logistics (encompassing both Fulfillment by Amazon and its recently launched "Buy with Amazon"), AMZN has the largest fulfillment and distribution capacity among U.S. retailers. Amazon has ~375 million square feet of total distribution capacity, dwarfing Walmart’s ~145 million square feet. [8] Amazon is projected to surpass UPS in U.S. package volume in 2022, and in five years have a logistics network large enough that it won't need to rely on UPS or the U.S. Postal Service. [9]
In response to the pandemic, Amazon’s management team made the decision to interrupt its march towards higher margins and higher returns on capital to respond aggressively to its consumer’s demand explosion across its retail and its AWS infrastructure. This has resulted in lower operating margins within the income statement and much higher capital expenditures, reducing near-term free cash flow, but we believe, widening and deepening Amazon’s moats across all of its businesses. The fruits of these investments (increasing margins, expanding free cash flow and increasing ROIC) will ripen over the next few years, which will be one of the catalysts, we believe, that will drive the company’s stock materially higher.
Amazon shares are down by about 47% from its highs last year and is back down to levels previously reached in 2018. While analysts forecast that Amazon will deliver $526 billion in revenues for 2022 - “only” a 12% year-over-year increase – revenues are projected to accelerate to 16% year over year growth over the next two years to $706 billion for 2024, with earnings growth accelerating as the business absorbs recent spending increases (analysts expect earnings to grow 30% annually through 2024 to $5.15). More interesting to us, we see AMZN’s free cash flow per share sprinting materially higher over the next several years to in excess of $10 per share by 2026 and $15 per share by 2027 – putting the company’s slightly further out valuation at a well below market 11x and 7x multiple of free cash flow, respectively.
Blackstone has been investing in private markets since 1987. The company today has over $900 billion in assets under management as compared with about $70 billion at the time of its 2007 debut as a public company. The company’s world-class reputation is built on its superior investment returns which, in private equity, have delivered a compounded 16% net to investors for over 30 years.
BX’s business is asset light and brand heavy as the company has virtually no net debt against its $110 billion equity market capitalization and pays out a large percentage of its earnings each year in dividends (while also supporting a steady stock buyback program). Fee related earnings (a conservative proxy for EPS that does not include lucrative performance fees) have increased 225% since the company’s Investor Day 3.5 years ago, having compounded more than 35% annually over that time.
The company continues to target strong AUM growth, expecting to raise in excess of $150 billion in new assets over the next 1.5 years as it continues to lead in an alternative management industry that continues to take share of institutional assets. AUM in the alt space has steadily migrated up from a low single digit share 25 years ago to the low 30% range today with substantial additional growth coming from the retail and insurance industries. By 2030, some analysts estimate that allocations to alternatives could double again to over 60% of institutional AUM. Today, while AUM in the alternative industry has grown to $10 trillion, there are over $250 trillion of assets in stocks and bonds, leaving a vast runway of growth available for the future.
Despite its 15-year history of success as a public company, BX’s business has vastly outperformed its stock and its valuation remains unassuming. Although the stock has generated a +600% total return since its IPO, its AUM has risen +800% during that time. And, after a 30% decline year to date during 2022, BX’s dividend yield of nearly 6% (annualizing its 1Q22 dividend) remains well ahead of the S&P 500’s 1.7%, while its 2023 PE of 12x represents a discount to the market’s 15x.
To us, BX remains a materially above-average company at a well below-average valuation, and it has remained amongst our largest holdings for years. When we look forward to 2027, we believe that BX’s dividend and distributable earnings will both at least double, as assets under management continue to compound at a +15% rate. This puts the company’s forward valuation at sub 7x future earnings, offering, we believe, enormous long-term upside for the stock.
Alphabet is often described as the "Backbone of the Internet" given its dominance across a multitude of categories from search (87% US market share), to video (YouTube), to mobile operating systems (Android – 71% global market share), and now to cloud (although the number 3 player to Amazon and Microsoft, Google’s cloud business has been growing at a +40% rate for several years and is currently at a run rate of over $23 billion in revenue). [10]
Alphabet's vast array of businesses can be divided into three main segments: Advertising, Cloud, and "Moonshots." In advertising, Google’s scale is hard to fathom as the company completes over 2 trillion search requests each year – about 8.5 billion per day [11] , while also hosting the world’s most popular video platform (YouTube boasts over 2 billion monthly users), managing the world’s most popular browser (Chrome, 64% market share) and hosting the most popular Map and email (Gmail) applications. The company generated nearly 30% of all global digital advertising in 2021, while still growing its overall ad dollars at an impressive 22% 4-year CAGR. The company’s advertising business is extremely profitable generating a 39% operating margin (45% margin excluding stock compensation) in 2021.
In Cloud, the company has quickly gown into a $23 billion run rate business with a 10% market share behind only AWS and Microsoft’s Azure in a market that is forecasted to grow to nearly $2 trillion by 2032. Alphabet is taking a slightly different approach to its larger two competitors creating an open platform of services and applications that can be easily usable across different cloud providers. Many believe this approach will be particularly appealing for larger organizations with massive amounts of cloud data that will not want to be siloed into a single cloud platform.
Finally, in its “moonshots” segment, the company is currently investing billions of dollars per year into a series of bold bets, many of which have the potential to create enormous future value including: Waymo (Alphabet's Self-Driving Vehicle unit) [12] Verily (healthcare businesses), AI and Quantum Computing and a host of other communications, delivery, and computational based initiatives.
Although its Cloud and moonshots, are currently generating operating losses, we believe these businesses offer enormous long-term shareholder value. And, the losses in these divisions are all currently funded by the company’s prodigious operating income and free cash flow (which last year totaled over $90 billion after funding $7-10 billion in operating losses). This enormous free cash flow allows the company to also invest nearly $25 billion annually in its core corporate and computing infrastructure and still return enormous streams of cash to shareholders (the company has repurchased $114 billion of stock over the last five years and the board recently authorized an additional $70 billion stock repurchase program). The company’s balance sheet remains a fortress, with zero net debt and over $125 billion of excess cash.
We believe that the company can continue to grow its advertising businesses at a premium to the overall digital advertising market (which is projected to grow at a double-digit rate for the foreseeable future) while continuing to grow its Cloud revenue substantially faster. We believe that margins in the advertising business will continue to expand and that the Cloud business will turn profitable within the next year or so with margins eventually scaling to +30% (comparable to AWS and Azure). As a result, we project EPS growth for the company to continue to compound in excess of 20% per year for the foreseeable future and project that the company will generate a staggering $700 billion of excess free cash flow through 2027 and over $1.5 trillion by the end of this decade.
Despite these impressive credentials, GOOGL’s stocks has fallen 24% year to date and currently trades at a relatively inexpensive 15x 2023 EPS (with fully allocated losses) and an even more attractive 12x 2023 EPS if one were to exclude its loss-making divisions (still giving those businesses zero enterprise value). As the cloud division turns profitable and the advertising businesses continue to scale, the company trades today at only 7x our 2027 projected earnings, a steep discount to the market’s 13x multiple on 2027 earnings, offering substantial upside to patient shareholders.
UBER is a global technology platform that enables the transportation of people and products across cities and countries. The company’s three main business lines are 1) Mobility where the company is the number one or two player in the app-based personal transportation market in 10,000+ cities globally, 2) Delivery- (Uber Eats in the US) home delivery of prepared meals, grocery, liquor, and increasingly general retail products in seven of the top ten GDP markets globally, and 3) Freight- the largest global marketplace for end-to-end freight solutions including one million digitally connected truck drivers. In the company’s most recent quarter, it grew gross bookings 35% year over year, consummated transactions with 115 million unique customers, completed 1.7 billion trips a month, and all three divisions were adjusted EBITDA positive.
At its February 2022 analyst day, Uber outlined financial goals for 2024 that included $5 billion of adjusted EBITDA and roughly $4 billion of free cash flow. Since then, the company has raised near term guidance on faster post-COVID Mobility recovery, raised near term expectations for margin improvement and generally had positive comments on the trajectory of all three business lines. Despite this, the company’s stock has remained under pressure. Taking into account the value of the company’s equity investments in third party delivery and logistics businesses (mostly received when Uber exited markets by selling to a local competitor), Uber’s enterprise value is currently about $37 billion or less than 10x 2024 expected free cash flow. Looking forward, we think Uber trades at less than four times 2027 free cash flow and less than two times our longer-term target for 2030 free cash flow. Using a historical market multiple of 18x 2027 cash EPS of $5.11 yields a stock price in 2026 (4 years hence) of $92, more than four times its current price.
Meta is the second largest global advertising company and the largest global social media network. The company runs Facebook, Instagram, and WhatsApp which together reach more than 3.5 billion people monthly (a staggering 70% of the roughly 5 billion people thought to use the internet globally each month). The company, through its websites, apps, and media network, has created the most effective advertising targeting system in the world, which has lowered customer acquisition costs and brought down barriers to entry for tens of millions of small merchants in hundreds of industries in nearly every country in the world. We expect the company’s investments in shortform video to reinvigorate growth in the near term and its investments in the metaverse to ensure the company’s dominance in the social media space over the medium to long term.
Meta’s core social media advertising business is high margin and capital efficient. We expect Meta to use a large portion of the cash the advertising business generates to make investments that will lay the groundwork for the next chapter of growth. Despite this reinvestment, we expect Meta to generate roughly half of its current enterprise value in cash over the next five years and about 150% of the current enterprise value in cash by 2030. Using a historical market multiple of 18x 2027 EPS of $39.39 yields a stock price in 2026 (4 years hence) of $709, more than four times its current price.
RingCentral is a software-as-a-service ((SAAS)) provider of communications solutions to large enterprises. The company's solutions replace legacy office phone systems or Private Branch Exchanges (PBX) with a cloud-based virtual solution that enables a customer's employees to communicate via voice, text, video/web conferencing, and fax over multiple devices including cell phones, tablets, and computers from any location. This cloud-based phone systems market, typically referred to as Unified-Communication-as-a-Service (UCaaS) is a roughly $10 billion market today and is projected to grow to over $100 billion over the next ten years as companies move their communications systems to the cloud.
The move to UCaaS adoption is being driven by both the obsolescence of PBX hardware underlying current office phone systems, and, like cloud adoption across the software stack, cloud-based phone systems being less expensive, more feature rich, and accessible anywhere. RingCentral (which went public in 2013) is the leading vendor to the UCaaS market and has enjoyed greater than 28% revenue growth in every year since its IPO, a growth rate that continued in the company’s recently reported 1Q22 in which it grew revenue 33%. We believe the company can continue to grow revenue north of 25% for many years to come, driven by the global conversion of more than 400 million on-premises phone systems to the cloud. RingCentral is well positioned to continue to win the lion’s share of this UCaaS migration, as the company has partnered with many of the largest legacy PBX vendors (including Avaya, Atos, AlcatelLucent, and Mitel) to be their recommended cloud solution for customers whose maintenance period on their installed systems ends (and the vendors no longer support them). RNG has also partnered with communications giants like Vodafone, AT&T and Verizon to sell co-branded cloud solutions into their customer bases.
As the company’s revenue scales, we expect gross margin to continue to improve from its already strong 80%, while we expect the company to continue to expand its EBITDA margin from 18% in 2022, toward typical SaaS margins of 40% or higher over the next several years.
At its current stock price, RNG trades at about 5x our expected 2027 EPS and 2x our 2030 EPS. We project that the company will generate over 60% of its current enterprise value in excess free cash over the next 5 years and 150% of its current enterprise value in excess cash by the end of the decade. Using a historical market multiple of 18x 2027 EPS of $11.85 generates a target in 2026 (4 years hence) of $213, or nearly 4x today’s price. We believe these estimates to be conservative and we believe an 18x multiple is low for a business that is expected to be still being growing free cash flow at a healthy clip. On our longer-term analysis (using 2030 EPS targets and/or one based on excess free cash flow generation), we calculate the potential for a compounded annual return of 35-40% per year through the end of the decade.
Twilio offers a full suite of cloud-based communications software, services and tools that allows companies in a wide range of businesses to build omni-channel communications capabilities (video, chat, voice, SMS, fax and email) directly into their customer facing applications without needing to build back-end infrastructure and interfaces. The company also provides software tools that allow its users to gather and categorize customer data (its Segments offering) and to create next generation call centers ((FLEX)) to utilize this data in customer interactions. Twilio is the leader in this fast growing $80 billion Communications-Platform-as-a-Service (or CPaaS) market, having grown its customer base 5x in the past five years to 268,000 customers and to a $3.5 billion run rate revenue for 1Q22. The company’s net revenue retention rate has exceeded 125% every year since its 2016 IPO and its customer churn remains less than 4% (for customers with > $30,000 revenue), evidence of the loyalty of Twilio’s customers to its platform (and a high switching cost) as well as the company’s increasing number of offerings. The company’s revenue is generated from both recurring revenue from subscription fees as well as volume-based charges for usage.
TWLO expects to maintain a +30% annual organic revenue growth rate through at least 2024, with long-term gross margin expansion from 56% to 60%-65%, and EBITDA margins approaching 35% as revenue scales. As of 1Q22, TWLO had $4.2 billion net cash, and should turn FCF positive this year. Over the next several years, we expect the company to grow its excess cash significantly as the company operates an asset light business model with low capital needs of just over 1% of current revenue.
We forecast 30% annual revenue growth through 2027, with EBITDA margins approaching the company’s long-term model guidance of 27% to generate $11.49 of EPS. At its current stock price, TWLO trades at about 5x this 2027 EPS projection (and trades at only 3x our 2030 EPS estimate). We project that the company will generate nearly 65% of its current enterprise value in excess free cash over the next five years and all of its current enterprise value in excess cash by the end of the decade.
Using an 18x multiple, 2027 EPS of $18.88 generates a target in 2026 (4 years hence) of $377, or roughly 4X today’s price. Looking out to 2030 and applying the same 18x multiple on EPS, we believe Twilio could trade at more than 6x today’s price.
New Positions
We reinitiated a position in [[ KKR]] , an alternative asset manager that we have previously owned, after a recent significant fall in its stock price. Much like our current Blackstone holding, most of KKR’s investor capital is long-dated or even permanent (perpetual capital is currently $165 billion, 43% of its fee-paying assets under management), most of their fees (which are high margin and recurring) are not sensitive to the stock market (fee-paying AUM was $371 billion for 1Q22, up 29% year over year, helping to generate $605 million of fees, up 66% year-over-year), and the company has billions of dollars of uninvested capital available to put to work (KKR has $115 billion of “dry powder” or uncalled capital commitments, an increase of 66% year over year). This combination of large and growing AUM that generates recurring fees, along with the company’s stellar history of opportunistic investing and harvesting, offers a fantastic combination of consistent fee based recurring earnings with the potential for substantial incentive fee upside over time. As with Blackstone, we believe this combination provides a strong foundation for long-term stock performance. Along with the broader markets, KKR’s stock has come under significant pressure over the last several months (falling nearly 40% from its recent November 2021 peak) affording us the opportunity to re-invest in the company at what we believe to be an extremely compelling valuation.
Nike , also a previous holding, is, by far, the leading athletic footwear, apparel, and equipment company in the world with over $46 billion in revenue, $6 billion in 2021 annual free cash flow, and over $4 billion of excess cash. We expect the company to return to at least 10% annual revenue growth over the next few quarters, in line with management guidance. Moreover, we believe that NKE should continue its accelerating profit growth, as we expect margins to increase materially through rising average sales prices (from both increased pricing and a mix shift to more premium products), the company’s deep innovation pipeline, a secular shift from the company’s traditional wholesale channels to a more direct-to-consumer approach (now 35% of revenues up from 16% ten years ago), and a more streamlined supply chain. We believe that the continued global secular growth trend towards active wear will continue to aid Nike’s topline growth, while we expect the combined gross and operating margin improvements from its initiatives will drive long-term mid-teens or higher annual EPS growth for the foreseeable future. We took advantage of the selloff over the past few months to reinitiate a small position in NKE at a multi-year low in its valuation.
Adyen operates a global payments platform, integrating the full payments stack to serve modern global merchants. Unlike its legacy peers, Adyen’s roots are in technology. The company’s platform was built fully in-house on a single code base and operates as a single, integrated end-to-end network, giving it an advantage over competitors that have separate platforms for gateway, risk management, processing, issuing, acquiring, and settlement. The company’s single platform also allows its merchant customers to use one payment service provider globally across all commerce channels (in-store, on the web, and on mobile devices), providing them lower payment costs, a single back end, a single contract, and better visibility of end customers. The company grew revenue 46% last year, and with a high-margin, high-return business model (posting a 63% EBITDA margin for 2021 and with capital expenditures of only 5% of revenue) already generates significant free cash flow. With less than 1% of worldwide electronic payments, we believe ADYEN can continue greater than 30% annual revenue growth for years to come and, due to its low capital needs, we forecast FCF will triple over the next few years.
Portfolio Review
Portfolio Attribution is produced by RiverPark Advisors, LLC (RiverPark), the Fund’s adviser. Although RiverPark believes that its attribution methodology adheres to generally accepted standards in the industry, attribution analysis is not an exact science and different methodologies may produce different results. Performance Attribution is shown gross of fees. Holdings are subject to change . |
Portfolio Attribution is produced by RiverPark Advisors, LLC (RiverPark), the Fund’s adviser. Although RiverPark believes that its attribution methodology adheres to generally accepted standards in the industry, attribution analysis is not an exact science and different methodologies may produce different results. Performance Attribution is shown gross of fees. Holdings are subject to change . |
Top Ten Long Holdings
Below is a list of our top ten long holdings as of the end of the quarter:
Holdings subject to change. |
Below is a list of the key secular themes represented on both sides of our portfolio as of the end of the quarter.
This is a representative (non-exhaustive) list of our largest current long and short themes. Holdings subject to change. | ||||||||||||||||||||||||||||||||
|
Summary
We continue to believe that our secular-themed long/short portfolio is well positioned to generate strong absolute and relative performance in the years to come. We will continue to keep you apprised of our process and portfolio holdings in these letters each quarter. As always, please do not hesitate to contact us if you have any questions or comments about anything we have written or about any of our funds.
We thank you for your interest in the RiverPark Long/Short Opportunity Fund.
Sincerely,
Mitch Rubin | Portfolio Manager and Chief Investment Officer
Footnotes
| [1] In fact, just as growth stock Apple was once amongst the largest holdings in the Russell Large Cap Value index, after their current declines, growth companies PayPal, Netflix, Meta and Pinterest were all just added to that index. [2] We agree with Jeff Bezos’ statement in his inaugural 1997 shareholder letter that “cash flows more than any other single variable seem to do the best job of explaining a company's stock price over the long term. If you could know for certain just two things--a company’s future cash flows and its future number of shares outstanding--you would have an excellent idea of the fair value of a share of that company’s stock today.” [3] We had higher than normal turnover this year in the portfolio to take advantage of particularly attractive valuation disconnects, selling 11 lower-growth businesses and adding four new higher growth compounders that we have been following for some time. Still, 26 out of 37 of our holdings from year-end 2021 remain in the portfolio. [4] Amazon 2015 shareholder letter [5] Amazon was the fastest company ever to reach $100 billion in annual sales. 2015 Shareholder letter. AWS, launched in 2006 has been the company’s fastest to reach $10 billion in annual sales. 2015 Shareholder letter. At 1Q22, AWS is at a $74 billion revenue run rate. [6] Q21. Statistica. Global cloud infrastructure market share 2022 | Statista [7] https://www.cnbc.com/2022/02/03/amazon - increases - the - price - of - prime - nearly - 17percent - to - 139 - per - year.html . February 2022, Amazon announced its first increase in almost four years for the annual US Prime membership fee from $119 to $139. [8] Amazon is slowing down its fulfillment center spend. What's next? [9] Amazon is UPS's biggest customer, and its biggest competitive threat [10] At 1Q22. [11] FB is estimated to have 2.5 b visitors per day while Amazon gets only about 74 million visitors per day. [12] The worldwide autonomous vehicle market is forecasted to reach a staggering $2.1 Trillion by 2030. |
| † Inception date of the Fund was September 30, 2009. Annualized performance since inception of the Mutual Fund (3/30/12) was 1.3% for RLSIX. The performance quoted herein represents past performance. Past performance does not guarantee future results. The performance quoted for periods prior to March 30, 2012 is that of RiverPark Opportunity Fund, LLC (the “Predecessor Fund”). The inception date of the Predecessor Fund was September 30, 2009. The performance of the Predecessor Fund includes the deduction of actual fees and expenses, which were higher than the fees and expenses charged to the Fund. Although the Fund is managed in a materially equivalent manner to its predecessor, the Predecessor Fund was not a registered mutual fund and was not subject to the same investment and tax restrictions as the Fund. The Contribution numbers set forth above are produced by RiverPark Advisors, LLC (RiverPark), the Fund’s adviser, in accordance with generally accepted standards in the industry. The calculation of contribution is not an exact science and different methodologies may produce different results * Where applicable, the exposures are delta-adjusted and are computed by averaging the exposures of each month-end within each period. |
Editor's Note: The summary bullets for this article were chosen by Seeking Alpha editors.
For further details see:
RiverPark Long/Short Opportunity Fund Q2 2022 Quarterly Letter