VNQ - RLTY: Deep Discount On A Quality REIT Portfolio
2023-03-20 05:03:10 ET
Summary
- RLTY launched at a bad time but shares characteristics of its older sister funds.
- At the same time, RLTY was pushed to a deep discount despite the similarities.
- The deep discount and high-quality holdings make this a buy.
Written by Nick Ackerman, co-produced by Stanford Chemist. A version of this article was originally published to members of the CEF/ETF Income Laboratory on March 5th, 2023.
Cohen & Steers Real Estate Opportunities and Income Fund ( RLTY ) launched at an unfortunate time. All real estate-related investments took a heavy hit in 2022, and this fund launched at the beginning of 2022. As is typical with new closed-end funds, despite the term structure, they generally slump to a discount. That's happened with RLTY, as the fund's discount has now been pushed to double-digits.
However, I view REITs as favorable now as we should be getting nearer to the end of interest rate hikes. The valuations have come down, making them more compelling. Any interest rate stabilization or even cuts in the coming years could be a tailwind to the sector as well.
Cohen & Steers is one of the best REIT managers; RLTY trades at a deep discount now, but its other sister funds do not. At the same time, they carry significant overlap. In my opinion, they aren't entirely the same, but they are high quality enough to trade at similar valuations. RLTY carries heavier leverage and has underperformed since launch. More recent results have shown much more similar results. However, if you feel positive about the future of REITs, then higher leverage could be a benefit going forward.
Since our last update , RLTY has been rebounding. Some of that was through the fund's discount narrowing.
RLTY Performance Since Prior Update (Seeking Alpha)
We also have a new annual report to look at as this fund crosses over its one-year anniversary of February 24th, 2022.
The Basics
- 1-Year Z-score: -0.78
- Discount: -12.47%
- Distribution Yield: 9.61%
- Expense Ratio: 1.74%
- Leverage: 33.78%
- Managed Assets: $435.17 million
- Structure: Term (anticipated liquidation date February 23rd, 2034)
RLTY's investment objective is "high current income." The secondary objective is for "capital appreciation." To achieve this, the fund will invest "at least 80% of its managed assets in (i) real estate-related investments, and (ii) preferred and other income securities." This is pretty straightforward and quite similar to Cohen & Steers' other real estate-focused funds.
They are all mostly flexible to investing wherever they see fit. However, they tend to keep it consistent. RLTY is in the middle of Cohen & Steers Quality Income Realty Fund ( RQI ), and Cohen & Steers REIT and Preferred and Income Fund ( RNP ), carrying equity/preferred weightings at around 65/35% splits. RNP is around 50/50% generally, and RQI floats around an 80/20% split.
When including leverage, the fund's expense ratio comes to 3.14%. The fund is the smallest of the trio of funds, so seeing a higher expense ratio isn't overly surprising. It's also important to note that this latest annual report it's a slightly shortened period and involves a time when the portfolio was getting set up.
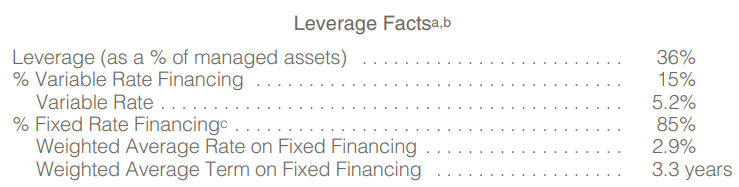
On top of this, the fund carries a higher amount of leverage. That was one of my critiques when this fund first launched. They wasted no time and leveraged the fund right up to their 33.3% limit. Fortunately, despite the volatile market through 2022, they didn't have to deleverage.
The C&S funds hedged against leverage by mostly fixing their leverage costs. Therefore, interest rate increases have made them less susceptible to rising costs. This benefits RLTY and the other C&S funds and is a benefit they'll enjoy for the next few years.
RLTY Leverage Facts (Cohen & Steers)
Performance - Brighter Future Possible
RLTY has been the underperformer of its sisters. As touched on above, having a larger amount of leverage could have been a factor. Plus, the positioning mix will play a role, too; while overlap exists, there are differences. RNP, in this case, performed the best since RLTY's inception. I think that's reflecting the heavier weighting to preferreds relative to the sister trio.
Perhaps also worth noting is that all of them beat out the Vanguard Real Estate ETF ( VNQ ) during this time. This non-leveraged equity-focused REIT fund can help provide some color for the overall sector.
Since the fund's inception, RLTY has been an underperformer. However, if we look at the YTD results, RLTY has been the middle performer. RNP has slipped to negative due to what is presumably the preferred sell-off due to the financial sector. That's been grabbing all the headlines lately with the bank failures. RQI being the least exposure to financials, fell to a smaller degree lately.
Where RLTY underperformed significantly since inception was on a total share price basis; however, that results in the opportunity we have now. That would be picking up shares of RLTY at a deep discount. Relative to its sister funds, it is truly a deep discount too. The actual discount of RLTY is 12.47%, but Ycharts data has not been updated yet. This can still highlight the relative discounts between the trio of funds.
I think it isn't deserved even if the fund has slightly underperformed since its inception. All else being equal, RLTY will have an easier time outperforming on a total share price basis in the future. Additionally, if we get a rebound in the next year or two for the REIT space, I think RLTY could slightly outperform, given the additional leverage.
Distribution - Return of Capital
RLTY launched at a distribution rate of $0.1040 per month. They have maintained this rate, which comes out to a distribution yield of 9.61%. The NAV yield is still a moderate 8.14%. However, the biggest discussion will likely be centered around the return of capital the fund is paying.
As with most CEFs, particularly those with heavy equity positioning, most of their distribution coverage relies on capital gains. We know that since RLTY launched, that hasn't been available to them.
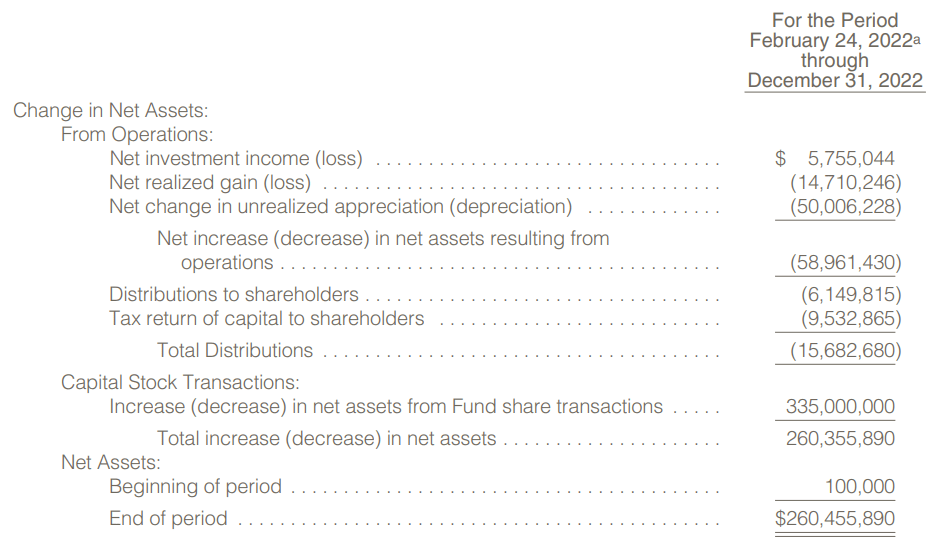
Thus, we see the fund's earnings like this, with limited net investment income to cover the distribution. NII coverage is 36.7%, albeit this isn't a full year, but it's also not a full year for the amount of the distributions paid out.
RLTY Annual Report (Cohen & Steers)
We also see that they realized around $14.7 million in capital losses and unrealized losses of ~$50 million. Therefore, we know the fund hasn't earned its distribution.
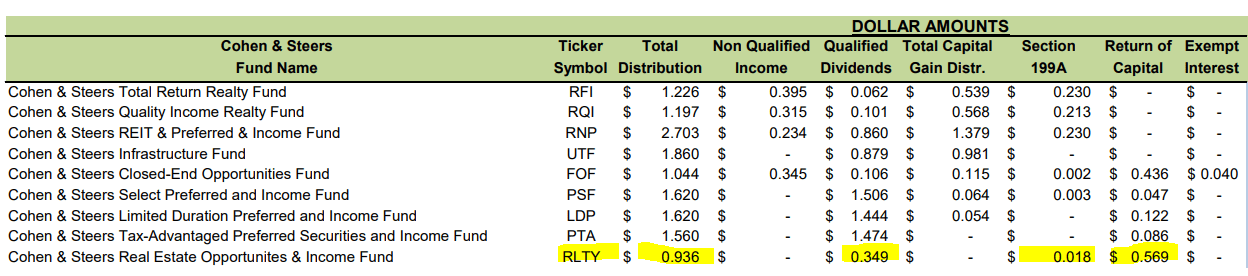
Thus, it isn't too surprising when we look at the tax classifications of the fund and see return of capital. Some investors would probably automatically assume that they will cut the distribution. After all, this is an example of "destructive" ROC , which we don't want to see regularly.
RLTY Distribution Tax Classifications (Cohen & Steers)
While they could, I don't believe that will be the case. I think the NAV yield is more important to watch. Whether the fund is paying out capital gains or return of capital, it's essentially paying out assets from the fund. So, in this case, it isn't any different than RQI or RNP paying out their capital gains. Asset prices were still falling, and they were still paying out capital from their funds.
Due to the timing of the launch for RLTY, they didn't have time to have any prior appreciation in their portfolio - at least not to a significant level, as things have mostly been down since they launched. RQI and RNP had the benefit of catching lots of appreciation from prior years, where they could sell off assets for gains.
The big benefit of ROC is that the distributions containing ROC are tax-deferred as it reduces an investor's cost basis. Meaning that no taxes are due for the year received, only potentially when the position is sold if you sell above your cost basis. I bought my initial position in November, so at this point, ROC is beneficial to me to defer tax obligations. At the same time, the share price has appreciated some.
Again, it's more important to what one believes the future will be. I believe that real estate could do better going forward than we have seen in the last year. If that is the case, then the distribution could become covered via realized capital gains and income. That's why I'm less concerned about what has happened in the last year.
The main point is that return of capital doesn't always have to be feared as much as some investors make it seem. It's a tax classification, not a performance metric. It's more important to watch NAV trends over time to know if a fund is "covering" its distribution. Even in that case, some funds have trended lower and lower, yet they continue to provide positive total returns when factoring in distributions over time. Several PIMCO funds are an example of this.
RLTY's Portfolio
RLTY wasn't overly active in 2022 in terms of portfolio turnover; it came in at 38%. Interestingly, the other C&S funds provide a sector breakdown of their portfolios in their fact sheets. In the case of RLTY, they appear only to provide an asset breakdown. However, it's been fairly consistent since our last update, so we don't see any dramatic shift. This data is for the period ending December 2022. The preferred exposure in the fixed-income sleeve is going to be mostly issued from financial institutions.
RLTY Sector Allocations (Cohen & Steers)
That being said, we can infer that they will be somewhat similar in their industry allocations. This is because the top ten of these funds overlap significantly, with RLTY and RQI only having a couple of differences. RQI is fresh on my mind as we've recently provided an update, but we see a lot of overlap with RNP too.
RQI overweight their top ten, and it appears RLTY is the same, with the top ten being 41.4%. RQI's top ten make up 49% of the fund.
RLTY Top Ten Holdings (Cohen & Steers)
The overlap isn't even limited to just carrying the same names; they are in the same order for the top four. Prologis ( PLD ), American Tower Corp. ( AMT ), Welltower ( WELL ) and Realty Income Corp. ( O ), all being the top four in the same order for RQI at the end of 2022.
However, Simon Property Group ( SPG ), Digital Realty Trust ( DLR ), Invitation Homes ( INVH ), Mid-America Apartment Communities ( MAA ) and Equinix ( EQIX ) can all be found as top positions for RQI.
That leaves only Camden Property Trust ( CPT ) as the sole difference in the top ten. For RQI, it's the 19th largest holding . So it's still in there, just at a 1.53% weighting.
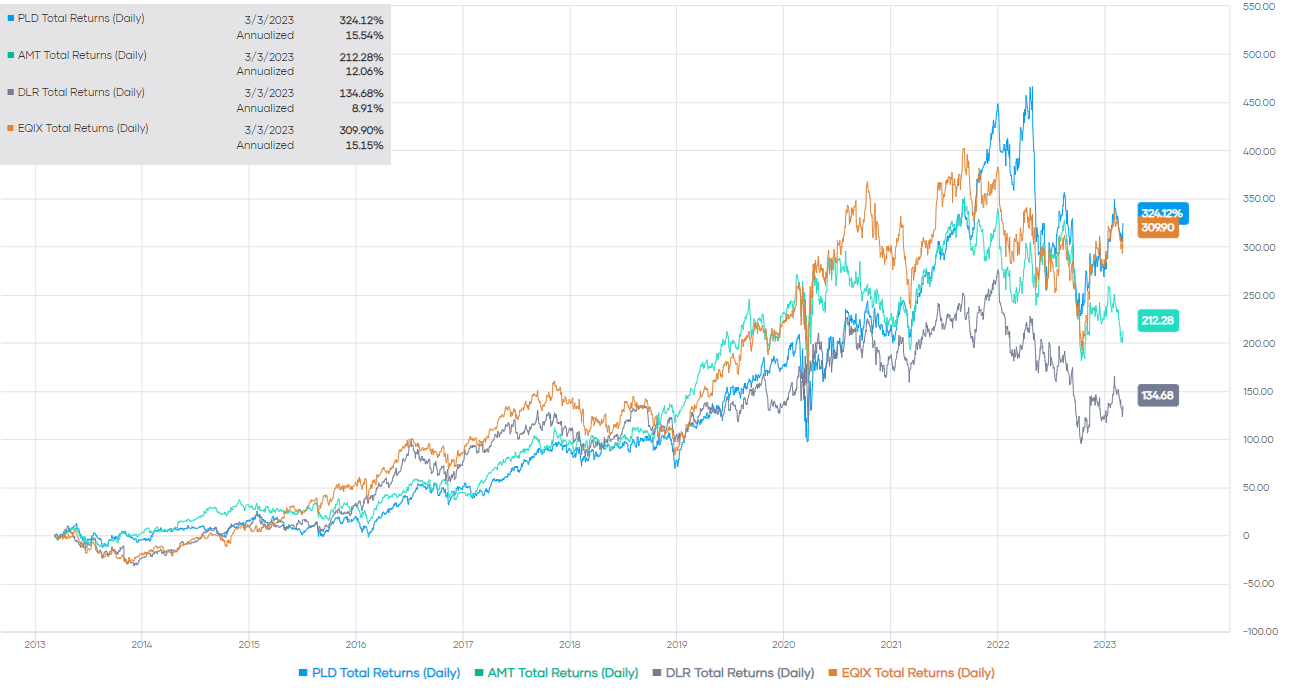
Some REITs benefiting from significant appreciation due to being invested in growth areas included PLD, AMT, DLR and EQIX. Over the last ten years, they've provided significant gains.
Total Return For Some Top RLTY Positions (Portfolio Insight)
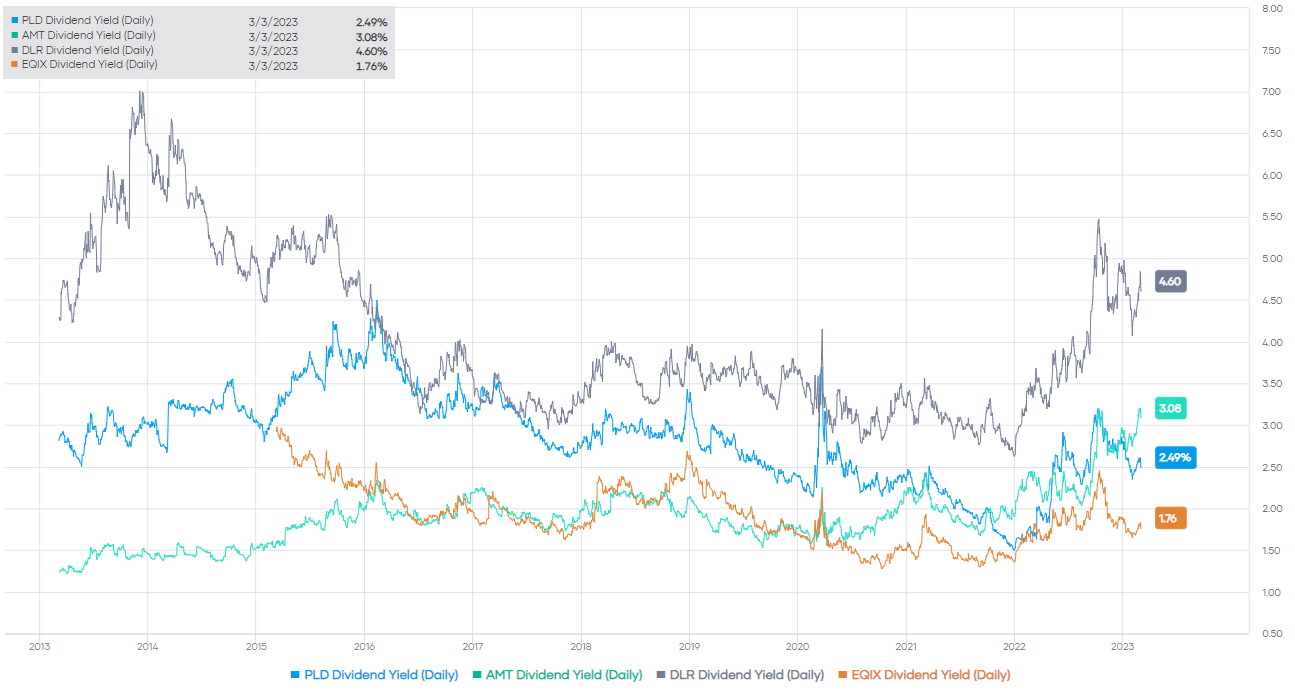
REIT prices have been coming down substantially in the last year, which means yields are rising on these investments. EQIX has been able to mostly buck that trend as it hasn't sunk as low as these REIT peers and has recovered quite sharply more recently. Of course, these are not necessarily direct peers, as AMT and PLD are in different industries within the REIT space.
Dividend Yield For Some Top RLTY Positions (Portfolio Insight)
The risk-free Treasury yield is a competitor in terms of attracting investing dollars from investors who would otherwise consider REITs. That's one of the reasons why REITs can be so sensitive to interest rate changes. Another would be the fact that debt becomes more expensive to fund future acquisitions or projects. Higher debt costs can limit profitability on growth.
Conclusion
Looking at the top holdings shows us just how similar RQI and RLTY are, with significant overlap. This is why I believe the discount difference between the two is too excessive. It makes RLTY seem like a clear choice. If REITs perform well going forward, RLTY might even have a leg up in terms of performance due to its higher leverage utilization. Of course, the downside of that is if REITs continue to perform poorly over the next couple of years, it also amplifies the downside.
For further details see:
RLTY: Deep Discount On A Quality REIT Portfolio