ROP - Roper Technologies: Difficult Growth Prospects
2023-11-28 13:47:12 ET
Summary
- Roper Technologies operates in multiple industries, though it has made an effort to shift purely to the software industry.
- However, with the wide array of software businesses, the company does not appear to have any clear market share leadership in any of the major software market.
- Roper's future depends on its acquisition strategy, however, we believe the high debt levels and low cash reserves limit acquisition opportunities moving forward.
Reading into Roper Technologies, Inc. ( ROP ), it is clear from the business descriptions of the company that it operates many different businesses that span the entire software arena. Roper wasn't always a Technology company. In fact, the company only changed its name to Roper Technologies in 2015 from Roper Industries . However, the transformation was only largely completed in 2021 when Roper sold off a 51% stake in its industrial businesses. Despite that, the company still consists of a wide array of smaller companies.
This analysis involves determining if the company has built any specializations among its portfolio of companies that give it a competitive advantage or if it is just spread too thin. We aim to identify if Roper can maintain its positive growth outlook to justify its current market value.
Strategic Shift to Software, but Lacking Market Leadership
We determined that Roper has an established acquisition strategy completing 40 acquisitions over the past 8 years. The company also had divestitures, but to a much lesser extent with just 9 divestitures over the same time period.
| Acquisitions and Divestitures |
| 2015 |
| 2016 |
| 2017 |
| 2018 |
| 2019 |
| 2020 |
| 2021 |
| 2022 |
| Acquisitions |
| 8 |
| 6 |
| 4 |
| 4 |
| 4 |
| 6 |
| 3 |
| 5 |
| Divestitures |
| 1 |
| 0 |
| 1 |
| 0 |
| 1 |
| 1 |
| 2 |
| 3 |
Source: Company Data, Khaveen Investments
Looking closer at these acquisitions though, we see 36 out of those 40 acquisitions have all been within the Application Software sub-industry, and the 4 which weren't were all prior to 2018. The divestitures paint a different story, with only 1 out of the 9 was the Application Software sub-industry. This suggests to us that the company is indeed trying to shift its business and is strategically focused on carrying out its acquisitions.
Company Data, Khaveen Investments
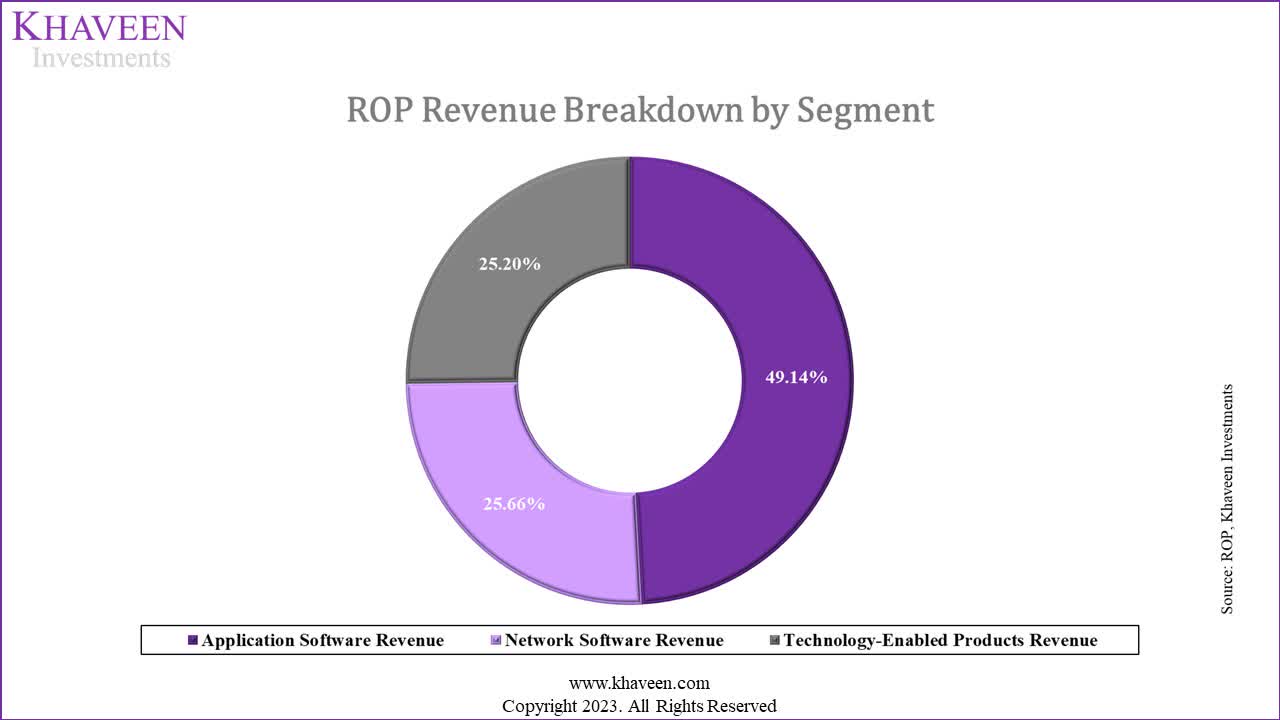
The table above shows how the company categorizes its portfolio of businesses into 3 segments which are Application Software, Network Software and Technology-Enabled Products Revenue. We believe this does not accurately reflect Roper's business operations. While the company selling off a 51% stake in its industrial businesses presents the company as more focused, 49% ownership in those companies is still retained. Under both IFRS and US GAAP accounting standards, ownership of companies under 50% is not required to be reported as revenue but instead included as part of other income. This leads to an understatement of revenue and inflation of net margins.
By using GICS, we are better able to distinguish and classify these companies into their appropriate industries and sub-industries to determine the business segmentation of the company. To do this, we examined the business description, website and products of each of its 27 businesses. We additionally included the 14 industrial businesses it still retained 49% ownership of, to better reflect its actual business operations.
| Industries |
| Subindustries |
| Companies |
| Number of Companies |
| Software |
| Application Software |
| Aderant, CBORD/Horizon, CliniSys, Data Innovations, Deltek, Frontline Education, IntelliTrans, PowerPlan, Strata, Vertafore, ConstructConnect, DAT, Foundry, iPipeline, iTradeNetwork, LoadLink, MHA, SHP, and SoftWriters |
| 19 |
| Health Care Equipment & Supplies |
| Health Care Equipment |
| CIVCO Medical Solutions, Northern Digital, Verathon, IPA |
| 4 |
| Technology Hardware, Storage & Peripherals |
| Technology Hardware, Storage & Peripherals |
| Inovonics |
| 1 |
| Electronic Equipment, Instruments & Components |
| Electronic Equipment & Instruments |
| rf Ideas, Alpha, Dynixco, FTI, Hardy, Logitech, PAC |
| 6 |
| Machinery |
| Industrial Machinery & Supplies & Components |
| Neptune, FMI, AMOT, Cornell, Hansen, Metrix, Roper Pump, Stuers, Technolog, Uson, Viatran |
| 11 |
Source: Company Data, Khaveen Investments
As seen, the company has wider exposure than is commonly understood. It has businesses across 3 different sectors (Technology, Healthcare, Industrials), and 5 industries. While the company presents itself as a software provider, less than 50% of its businesses are within the Software industry.
Additionally, Roper Technologies claims to have market leadership in several niche software segments with limited information on the actual markets.
Roper Technologies
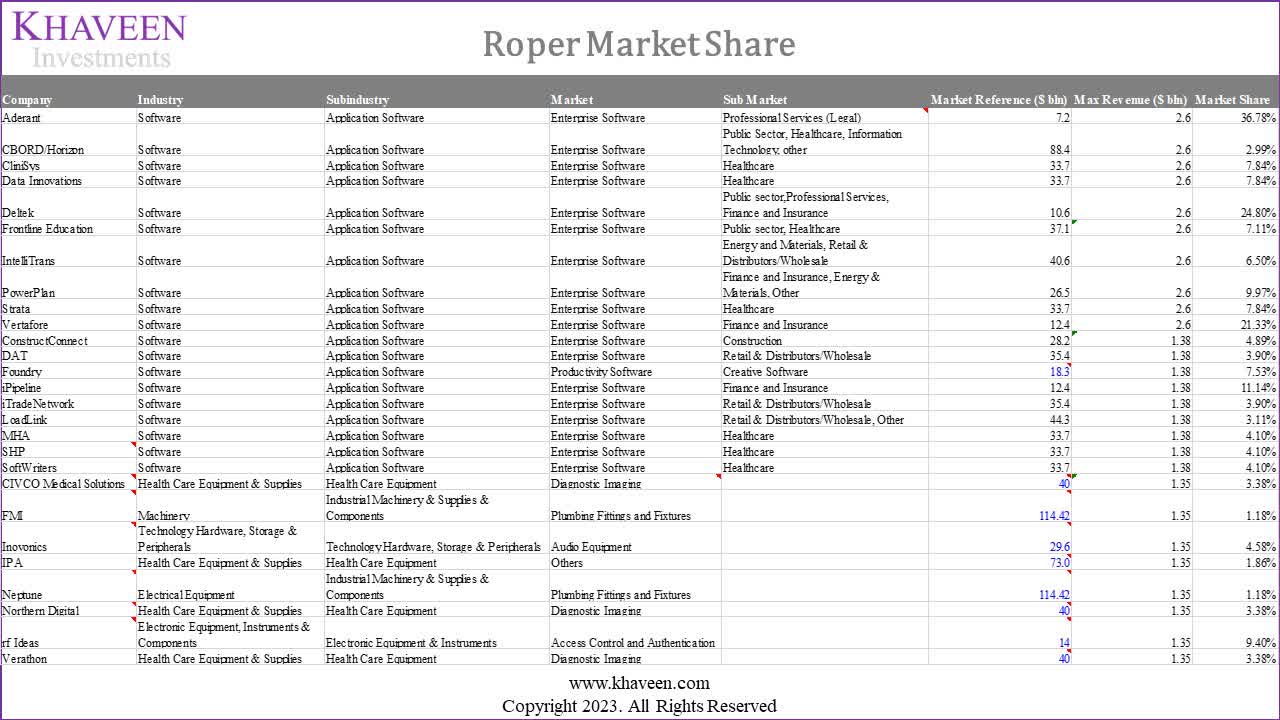
To verify this, we identified the market and sub-markets that its 27 current businesses operate in and determined the possible market shares for these businesses ourselves. For the company's businesses in the Enterprise Software markets, we categorized them into their respective submarkets based on end-market customer segments which we based on the breakdown of the ERP market. For the reference market sizes for each market, we utilized various market research reports such as GMI Insights (Medical imaging), Market Research Future (plumbing fittings and fixtures), Grand View Research (audio equipment) and Statista for the enterprise software market. Additionally, as the revenue for each business is not disclosed, we used the segment revenue as the maximum revenue for each business and calculated the estimated market share based on the market reference sizes as seen in the table below.
Company Data, Khaveen Investments
Even by assuming the maximum possible revenues by using its entire segment revenue, we see 23 of the 27 businesses have market shares <10%. The other 4 have the maximum possible market shares between 11% to 37%. More accurately, had we not used entire segment revenues, each of these businesses would have market shares of approximately 8x to 10x smaller than what is presented above. We do not see any clear indication of Roper's businesses having market share leadership in any of the markets we have evaluated.
Furthermore, when calculating Roper's market share based on the entire Software Industry, Application Software Sub-industry, and Enterprise Software Market, we can see they are actually much smaller than it is based on the table below.
| Software Industry |
| Market Size ($ bln) |
| Max Revenue ($ bln) |
| Roper Market Share |
| Software Industry |
| 610.11 |
| 4.0 |
| 0.66% |
| Application Software Subindustry |
| 471.81 |
| 4.0 |
| 0.85% |
| Enterprise Software Market |
| 247.48 |
| 4.0 |
| 1.62% |
Source: Company Data, Statista , Khaveen Investments
This further strengthens our belief that the company does not have that strong of a position in the markets it operates in. We reached out to Roper Investor Relations to gain more information or data about the company's 'leadership in niche markets' but received no response.
Outlook
While the company is trying to shift its business structure to build market leadership, we believe there is still some way to go. Based on our analysis, we believe the idea of the company being a software-focused company with leadership in various niche industries is very unjustified. Roper's past 5-year average revenue growth has only been 4%, and Analyst consensus 3-year forward average growth is only 9.8%. Screening companies in the Application Software industry with a market cap > $2 bln, we find that Roper has the 10th lowest growth out of 85 companies. This is certainly not indicative of a software company with niche market leadership in the businesses it operates.
Considering the company's relatively small size compared to large players, we believe Roper has too wide of an array of businesses to build a competitive advantage in. Thus, we believe the prospect of the company improving its growth outlook due to market leadership advantages is very limited.
High Debt Limits Acquisition Opportunities
We analyze the company's revenue to determine how effective its acquisition strategy has been.
| Roper Revenue Breakdown by Type ($ mln) |
| 2020 |
| 2021 |
| 2022 |
| Recurring |
| 1,965 |
| 2,553 |
| 2,939 |
| % Share |
| 49% |
| 53% |
| 55% |
| Reoccurring |
| 300 |
| 361 |
| 370 |
| % Share |
| 7% |
| 7% |
| 7% |
| Non-recurring Revenue |
| 597 |
| 685 |
| 721 |
| % Share |
| 15% |
| 14% |
| 13% |
| Product Revenue |
| 1,161 |
| 1,235 |
| 1,341 |
| % Share |
| 29% |
| 26% |
| 25% |
| Total |
| 4,022 |
| 4,834 |
| 5,372 |
Source: Company Data, Khaveen Investments
The table above shows that the company's recurring revenue share has increased over the past 3 years which is one of the aims of the company's strategy. However, we note that its non-recurring revenue share decrease only contributed to part of this, and a larger reason for this was due to the shift from product to non-product revenue. This data is only limited to 3 years though, and we conducted a better analysis by calculating the company's revenue breakdown by its organic and inorganic revenues. We calculated its organic revenues based on its organic revenue growth from its annual reports on the previous year's revenue.
| Roper Technologies Organic and Inorganic Revenue ($ mln) |
| 2014 |
| 2015 |
| 2016 |
| 2017 |
| 2018 |
| 2019 |
| 2020 |
| 2021 |
| 2022 |
| Average |
| Organic Revenue |
| 3,465 |
| 3,539 |
| 3,572 |
| 3,991 |
| 5,041 |
| 5,337 |
| 4,680 |
| 4,376 |
| 5,288 |
| Growth Contribution % |
| 7.0% |
| -0.3% |
| -0.3% |
| 5.3% |
| 9.4% |
| 2.8% |
| -1.0% |
| 8.8% |
| 9.4% |
| 4.6% |
| Inorganic Revenue |
| 85 |
| 44 |
| 218 |
| 617 |
| 151 |
| -609 |
| -658 |
| 457 |
| 84 |
| Growth Contribution % |
| 2.6% |
| 1.2% |
| 6.1% |
| 16.3% |
| 3.3% |
| -11.7% |
| -13.9% |
| 11.4% |
| 1.7% |
| 1.9% |
| Total |
| 3,550 |
| 3,582 |
| 3,790 |
| 4,608 |
| 5,191 |
| 4,728 |
| 4,022 |
| 4,834 |
| 5,372 |
| Growth % |
| 9.6% |
| 0.9% |
| 5.8% |
| 21.6% |
| 12.7% |
| -8.9% |
| -14.9% |
| 20.2% |
| 11.1% |
| 6.4% |
Source: Company Data, Khaveen Investments
We can see that the inorganic average revenue contribution due to acquisition was 73.6% which is significant in terms of the company's revenue generation. In terms of the company's overall revenue growth though, it is quite poor with a 10-year average of just 6.4%. We note that without the 2 negative growth years in 2019 and 2020, the average growth would have been much higher at 11.7%. The reason for the negative years was due to divestitures in 2021 and subsequent restatement of the company's 2020 and 2019 financial statements to exclude the contribution from its divested businesses.
| Roper Capex ($ mln) |
| 2013 |
| 2014 |
| 2015 |
| 2016 |
| 2017 |
| 2018 |
| 2019 |
| 2020 |
| 2021 |
| 2022 |
| Capex |
| 43 |
| 38 |
| 36 |
| 37 |
| 49 |
| 49 |
| 43 |
| 25 |
| 29 |
| 40 |
| Investing Cash Flow |
| 1,116 |
| 348 |
| 1,698 |
| 3,753 |
| 210 |
| 1,335 |
| 1,296 |
| 6,074 |
| 143 |
| -1,210 |
| Revenue |
| 3,238 |
| 3,550 |
| 3,582 |
| 3,790 |
| 4,608 |
| 5,191 |
| 4,728 |
| 4,022 |
| 4,834 |
| 5,372 |
| Capex as % of Revenue |
| 1.3% |
| 1.1% |
| 1.0% |
| 1.0% |
| 1.1% |
| 0.9% |
| 0.9% |
| 0.6% |
| 0.6% |
| 0.7% |
| Investing Cash Flow % of Revenue |
| 34.5% |
| 9.8% |
| 47.4% |
| 99.0% |
| 4.5% |
| 25.7% |
| 27.4% |
| 151.0% |
| 3.0% |
| -22.5% |
Source: Company Data, Khaveen Investments
Looking at Roper's cash utilization for acquisition, we separate the capex and non-capex components of its investing cash flow. Its Capex as % of revenue is low and decreasing but not relevant to Roper given its cash used for acquisitions (part of total investing cash flow) is what we want to analyze. Looking at the investing cash flow % of revenue, it does not seem to indicate any pattern.
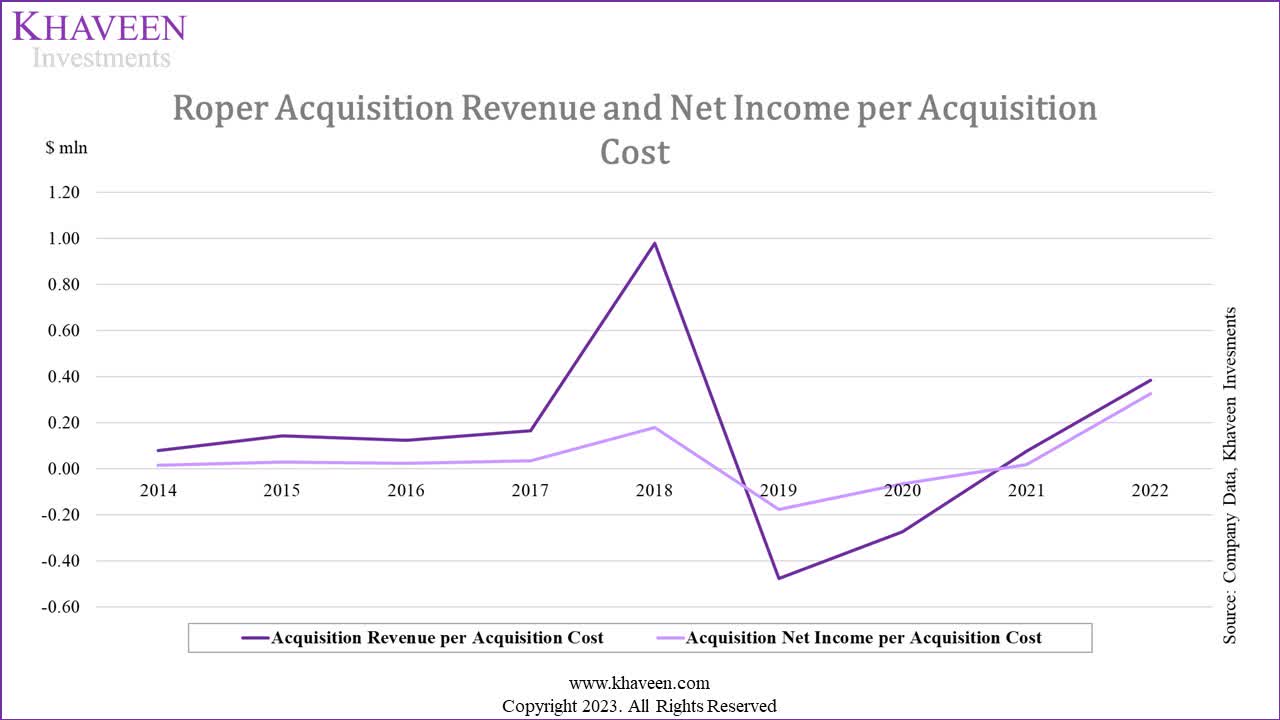
To examine further, we calculated the company's average acquisition revenue and net income contribution per acquisition cost in the table below. We based the acquisition revenue for each year on our calculated inorganic revenue as mentioned above. We estimated its acquisition net income per year by multiplying the acquisition revenue with the company's net margins for each respective year. Then, we calculated both the acquisition revenue and net income per acquisition cost by dividing the acquisition revenue and net income by the previous year's acquisition cost.
| Roper Revenue and Net Income per Acquisition Cost ($ mln) |
| 2014 |
| 2015 |
| 2016 |
| 2017 |
| 2018 |
| 2019 |
| 2020 |
| 2021 |
| 2022 |
| Acquisition Revenue (Inorganic Revenue) |
| 85 |
| 44 |
| 218 |
| 617 |
| 151 |
| -609 |
| -658 |
| 457 |
| 84 |
| Inorganic Net Income |
| 15 |
| 8 |
| 38 |
| 130 |
| 27 |
| -228 |
| -155 |
| 109 |
| 71 |
| Acquisition Costs |
| 305 |
| 1,763 |
| 3,722 |
| 154 |
| 1,276 |
| 2,387 |
| 6,018 |
| 217 |
| 4,280 |
| Acquisition Revenue per Acquisition Cost |
| 0.08 |
| 0.14 |
| 0.12 |
| 0.17 |
| 0.98 |
| -0.48 |
| -0.28 |
| 0.08 |
| 0.39 |
| Acquisition Net Income per Acquisition Cost ('ROIC') |
| 0.01 |
| 0.03 |
| 0.02 |
| 0.03 |
| 0.18 |
| -0.18 |
| -0.07 |
| 0.02 |
| 0.33 |
Source: Company Data, Khaveen Investments
As seen, each dollar spent on acquisitions generates on average 13 cents in revenue and 4 cents in net income. That translates to a ROIC average of just 4%, which is lower than the current treasury yields.
As seen in the chart below, there is also no trend in terms of increasing effectiveness in generating higher revenue or net income per dollar spent on acquisition, indicating no increasing ROIC as the years go by.
Company Data, Khaveen Investments
Outlook
We first identified all the funding methods Roper has utilized in the past for its acquisitions.
| Roper Technologies Acquisition Financing Mix ($ mln) |
| 2013 |
| 2014 |
| 2015 |
| 2016 |
| 2017 |
| 2018 |
| 2019 |
| 2020 |
| 2021 |
| 2022 |
| Average |
| Debt |
| 950 |
| 0 |
| 1080 |
| 2950 |
| 0 |
| 1500 |
| 1200 |
| 4920 |
| 0 |
| 0 |
| 1260 |
| Equity |
| 10.40 |
| 13.20 |
| 21.20 |
| 13.30 |
| 32.70 |
| 16.00 |
| 41.70 |
| 74.90 |
| 79.40 |
| 82.50 |
| 38.53 |
| Internal (Operating Cash Flow) |
| 114 |
| 292 |
| 662 |
| 759 |
| 121 |
| -240 |
| 1,146 |
| 1,023 |
| 138 |
| 4,198 |
| 821.12 |
| Total Acquisitions |
| 1,074 |
| 305 |
| 1,763 |
| 3,722 |
| 154 |
| 1,276 |
| 2,387 |
| 6,018 |
| 217 |
| 4,280 |
| 2,120 |
| Roper Technologies Acquisition Financing Mix % |
| 2013 |
| 2014 |
| 2015 |
| 2016 |
| 2017 |
| 2018 |
| 2019 |
| 2020 |
| 2021 |
| 2022 |
| Average |
| Debt |
| 88.4% |
| 0.0% |
| 61.3% |
| 79.3% |
| 0.0% |
| 117.6% |
| 50.3% |
| 81.8% |
| 0.0% |
| 0.0% |
| 47.9% |
| Equity |
| 1.0% |
| 4.3% |
| 1.2% |
| 0.4% |
| 21.3% |
| 1.3% |
| 1.7% |
| 1.2% |
| 36.6% |
| 1.9% |
| 7.1% |
| Internal (Operating Cash Flow) |
| 10.6% |
| 95.7% |
| 37.5% |
| 20.4% |
| 78.7% |
| -18.8% |
| 48.0% |
| 17.0% |
| 63.4% |
| 98.1% |
| 45.1% |
Source: Company Data, Khaveen Investments
We can see that most of the acquisitions used up funding from debt or internally generated cash instead of equity issuance. The debt (47.9%) and cash funding (45.1%) are almost equal in proportions. This means that both funding methods should be examined to see if either is still a viable option moving forward for acquisitions.
Company Data, Khaveen Investments
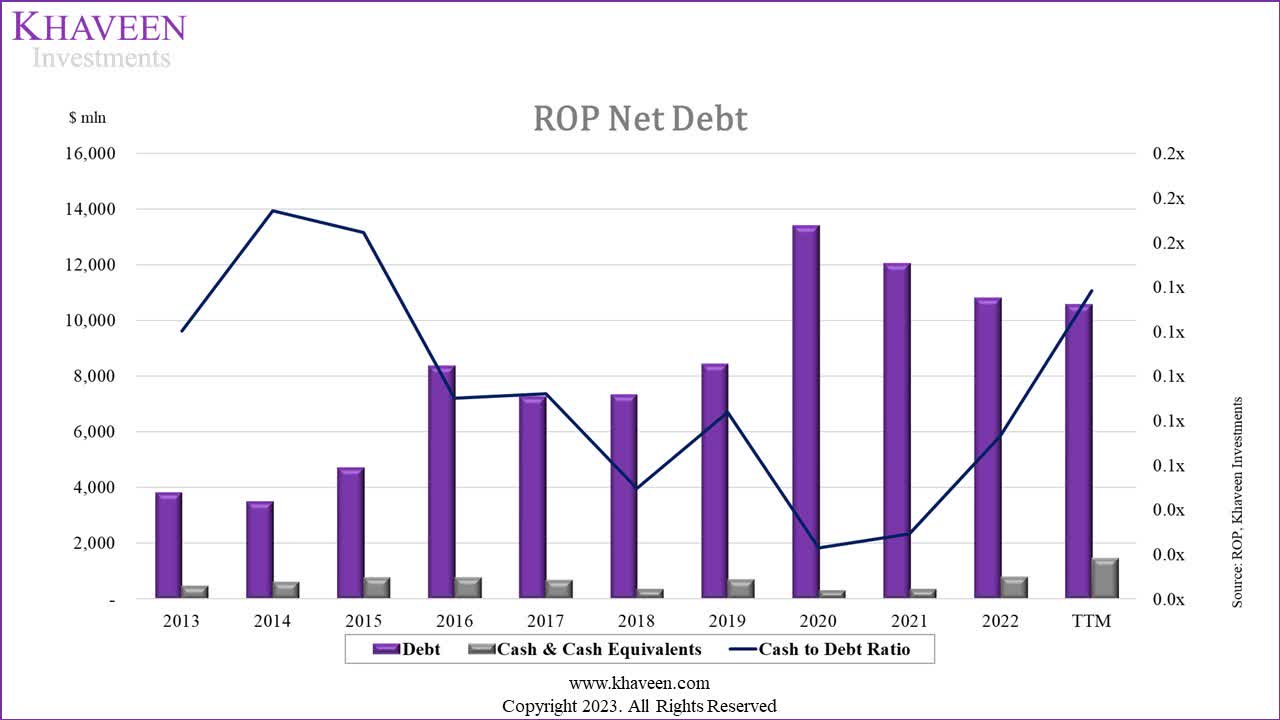
The company's cash-to-debt ratio has declined significantly from 2014 to 2020, which is not surprising. It is interesting to see that it has increased since then though. Roper had started to pay down its debt in these years. This might signal the company freeing up its balance sheet for additional acquisitions.
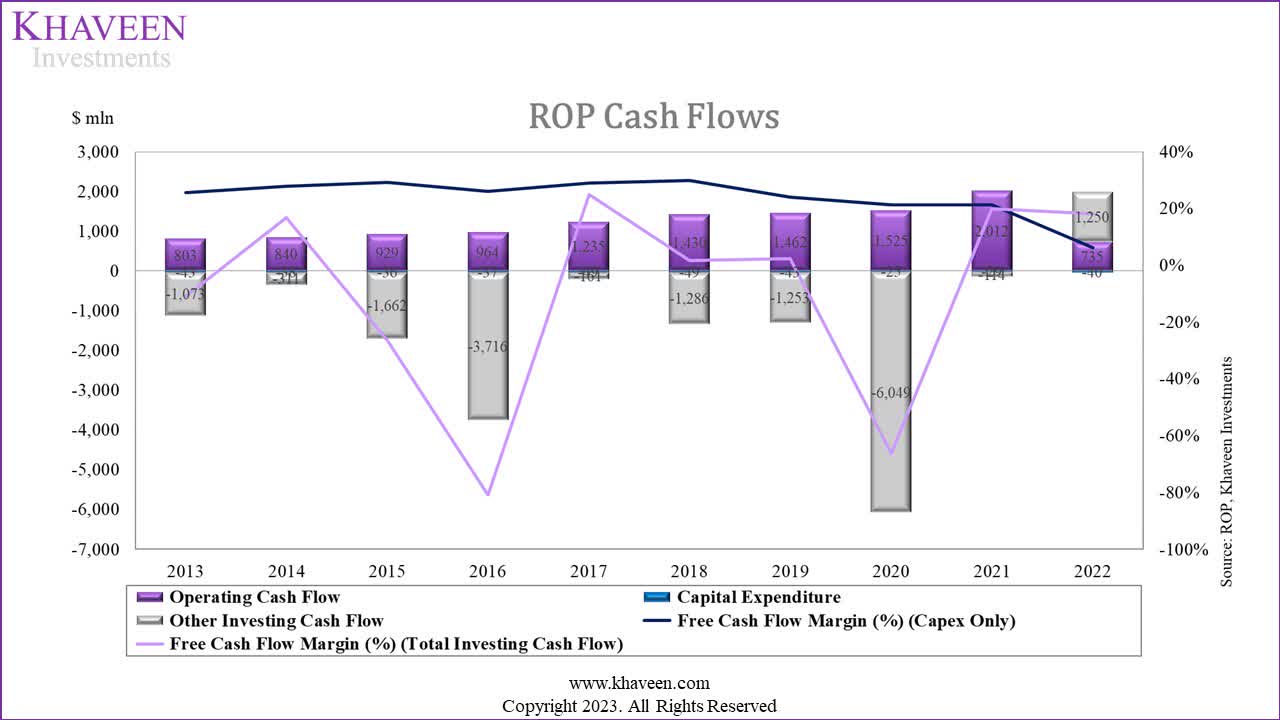
In terms of its FCF margins factoring in capex only, it has a 5-year and 10-year average of 20.5% and 24% respectively. On the latest TTM, that's an FCF of more than $2 bln. This is quite solid.
Company Data, Khaveen Investments
In its latest earnings briefing , management highlighted that over the past quarter, it had spent $2 bln in acquisitions which include Syntellis and Replicon. In addition, management indicated that they could continue spending $4 bln in acquisitions going forward.
Looking forward, we have capacity to deploy $4 billion or more over the foreseeable period even after deploying $2 billion in the third quarter. - Jason Conley, Executive Vice President and Chief Financial Officer
Roper's latest cash balance was only $300 mln down from around $800 mln in 2022. While we believe that free cash flow funding can cover around $2 bln of the expected acquisition costs, the remainder would have to be funded through debt, which would decrease its cash-to-debt ratio to 10-year lows. We believe this is not sustainable moving forward which would limit Roper's growth opportunities through acquisitions.
Nevertheless, while Roper has historically not relied on equity funding, it is still a viable option, if the company has a reasonably priced stock to entice investors. Looking at the software company's average EV/EBITDA for the top 10 software companies is 29.99x, whereas Roper's current EV/EBITDA stands at 25.71x which is 14% lower. Hence, we believe the company still has the capability to fund through equity as a last resort, however, at a ROIC of 4%, it does not contribute much to improving the company's outlook.
Room for Margin Expansion Limited
We believe that the company's acquisition strategy plays an important part in terms of its revenue generation and that it does have some strategic focus in its acquisition strategy by sticking to buying Application Software companies. However, as analyzed above we do not observe any increase in the effectiveness of the company's acquisitions in terms of revenue and net income earned per dollar spent. The company may be able to improve its ROIC on acquisitions in the future given increasing margins in the company. However, we saw that despite the company's increasing margins in the past, its ROIC has still remained low on average.
This could mitigate the benefits of rising margins for the company if the higher acquisition costs are eroding it. We believe that this would lead to sustainability issues in the acquisition strategy when the company's margin expansions finally stabilize.
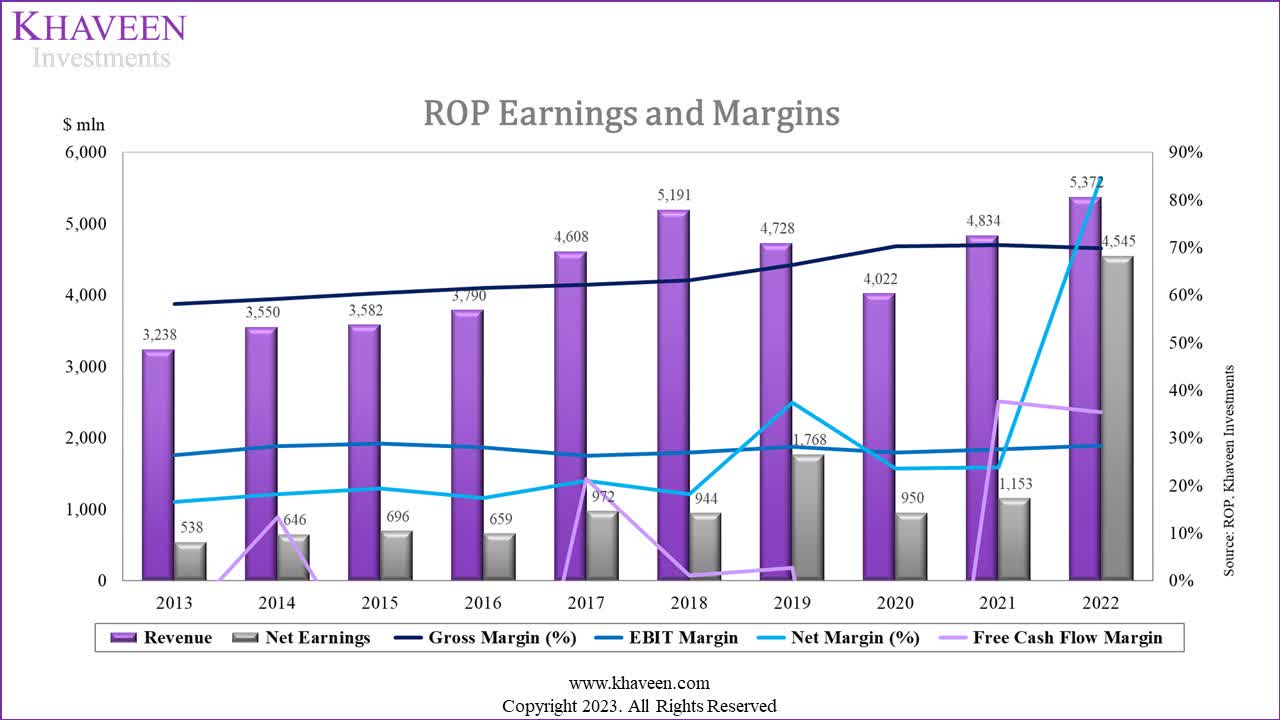
In 2022, the company recorded "earnings from discontinued operations" of $3.56 bln following its divestiture, which led to the increase of its net margin to 66.3%. Excluding earnings from discontinued operations, its margin for that year is only 18.3%.
Company Data, Khaveen Investments
Outlook
Based on its earnings briefing, management highlighted opportunities for cost synergies from its acquisitions to support its EPS growth next year.
Of note, our recent acquisitions had minimal impact on earnings this quarter. We expect DEPS accretion from these deals in 2024 as we pay down the revolver and benefit from full synergy realization. - Jason Conley, Executive Vice President and Chief Financial Officer
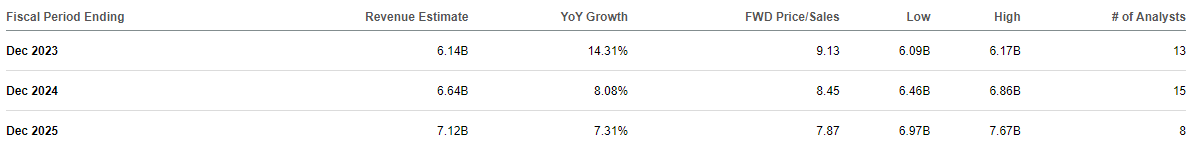
We do notice analyst consensus for EPS for the next three years is higher than analyst consensus for revenue growth, implying an expansion in margins, in line with management guidance.
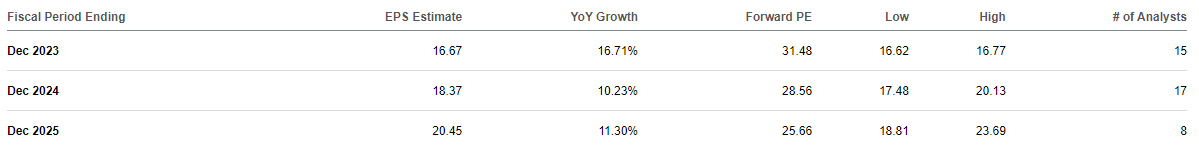
| Roper Technologies Net Margin |
| 2022 |
| 2023F |
| 2024F |
| 2025F |
| Revenue ($ mln) |
| 5,372 |
| 6,141 |
| 6,649 |
| 7,125 |
| Growth % |
| 14.31% |
| 8.28% |
| 7.16% |
| Net Income ($ mln) |
| 986 |
| 1,150 |
| 1,272 |
| 1,427 |
| Growth % |
| 16.71% |
| 10.56% |
| 12.23% |
| Net Margin % |
| 18.3% |
| 18.7% |
| 19.1% |
| 20.0% |
Source: Company Data, Khaveen Investments
Based on analysts' consensus revenue and earnings growth, we calculated the net margin estimates of the company in the table above, which shows it is expected to increase slightly by 1.7% from 18.3% to 20% by 2025.
To get an idea of software company margin averages, we derived an average net income margin of 40 application software companies (with >$1 bln in TTM revenue) which is only 4.62% compared to the company's net margins of 18.3%. Even when looking at the largest 10 companies which includes Roper, the average net income margin is only 16.4%. Hence, while Roper's above-average margins are a good characteristic of the company, we believe it doesn't leave much room for continued margin expansion.
Risk: Competition in Application Software
The company states itself that its "products and solutions face significant competition". Contrary to the company's claim about its market leadership in niche markets, we calculated earlier that this is unlikely, which makes this risk even greater, especially considering there are over 100,000 software companies in the world. We also note that in the Software industry, the top players have the scalability to adapt to newer technologies quicker to build better leadership positions and competitive advantages, as we determined in our coverages of Microsoft Corporation ( MSFT ), Salesforce, Inc. ( CRM ) and Adobe Inc. ( ADBE ).
Verdict
In summary, the company's exposure is broader than it presents as it operates across three different sectors (Technology, Healthcare, Industrials) and five industries, with less than 50% of its businesses in the Software industry. Even with maximum revenue assumptions, 23 out of 27 businesses have market shares below 10%, and the other four are not significantly higher. Thus, we believe the company does not have market share leadership in any of its evaluated markets and no geographical diversification. Given the company's size, we believe this diverse array of businesses may not allow the company to build a specific competitive advantage.
We believe the company's future likely hinges on its acquisition strategy, which we consider the company is executing with great focus (where 36 out of 40 acquisitions were in Application Software). However, we believe the high debt levels and low cash reserves limit acquisition opportunities moving forward. Nonetheless, we believe the company still has the capability to fund additional acquisitions going forward due to its lower valuation compared to the Software industry EV/EBITDA. In terms of margins though, we believe the company is already reaching its peak margins, and there is limited room to improve in this area.
Hence, we rate the company as a Hold with an average price target of $550.56 based on analyst consensus, which is an upside of only 4.4%.
For further details see:
Roper Technologies: Difficult Growth Prospects