ROST - Ross Stores: Valuation Not As Attractive As That Of Its Peers
2023-11-13 23:00:26 ET
Summary
- Ross Stores is a chain of off-price department stores in the US. The company acquires discounted merchandise from well-known brands.
- These stores become relevant to consumers when the macroeconomic environment is not favorable, making it a defensive sector.
- The current valuation does not offer attractive returns, and I think there are better alternatives in similar businesses.
Investment Thesis
Ross Stores (ROST) operates in a sector renowned for its resilience during economic downturns, making it an appealing choice for portfolio diversification. Despite having some of the best margins in its sector and favorable market conditions supporting its ongoing growth, it appears that the current valuation already reflects these strengths, limiting the potential for attractive returns.
In this article, we will delve into the commendable characteristics of the business and its sector, exploring the reasons for its resilience during crises. Additionally, I will conduct a comparative analysis with its peers and perform a valuation to substantiate why I advocate for a ' hold ' rating.
Business Overview
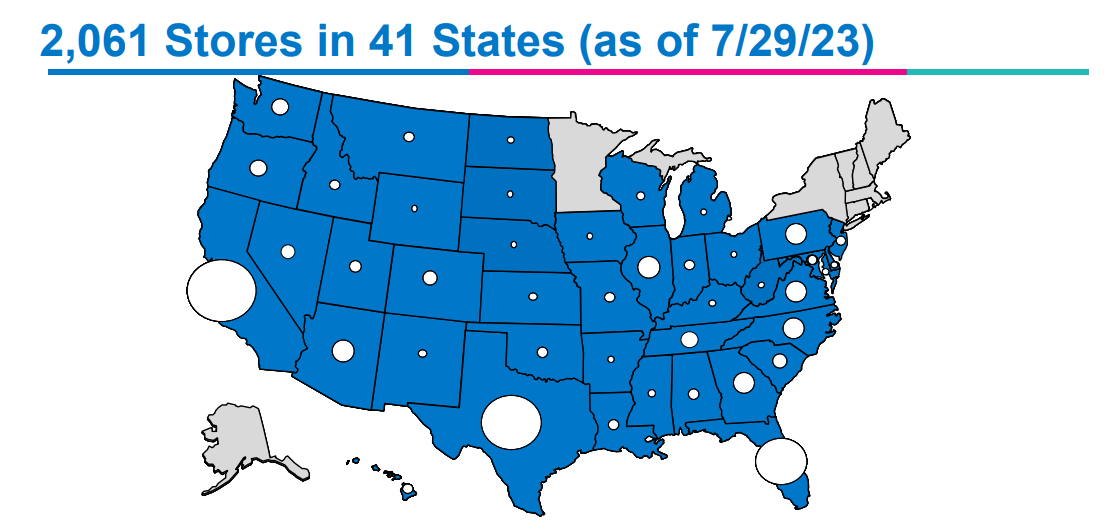
Ross Stores is a chain of off-price department stores, and it's one of the largest off-price retail chains in the United States. The company operates under two main brands: Ross Dress for Less and dd's DISCOUNTS. Ross stores offer a variety of products, including clothing, shoes, home goods, and accessories, at discounted prices. As of July 2023, the company operated 1,772 Ross Dress for Less in 41 states in the country and 339 dd's DISCOUNTS stores in 22 states, so it still has potential room to continue growing within the United States.
Ross Stores follows an off-price business model, which means they acquire merchandise from a variety of sources, including manufacturers, department stores, and other retailers, at a significant discount . They then sell these products to consumers at lower prices than traditional retailers, attracting bargain-seeking shoppers. The company has various levers it can employ to secure discounts on products. Among them, we can highlight the following:
- Overstock and Closeouts : Ross often purchases merchandise that other retailers, manufacturers, or distributors couldn't sell at regular retail prices. This could be due to overstock, closeouts, or excess inventory.
- Negotiating Discounts : Ross negotiates with vendors, manufacturers, and other suppliers to acquire products at lower prices. They leverage their position as a large and established retailer to secure favorable terms and discounts.
- Irregulars and Seconds : Ross may also purchase irregular or slightly imperfect items that didn't meet the quality standards of the original retailer. These items are often perfectly usable but are sold at a discount due to minor flaws.
- End-of-Season Goods : As the fashion seasons change, retailers often need to clear out their inventory to make room for new products. Ross takes advantage of this by purchasing end-of-season goods at a reduced cost.
- Flexible Merchandising Strategy : Ross maintains a flexible and opportunistic approach to merchandising. They adapt to market conditions and take advantage of buying opportunities as they arise, ensuring a constant flow of new and diverse products.
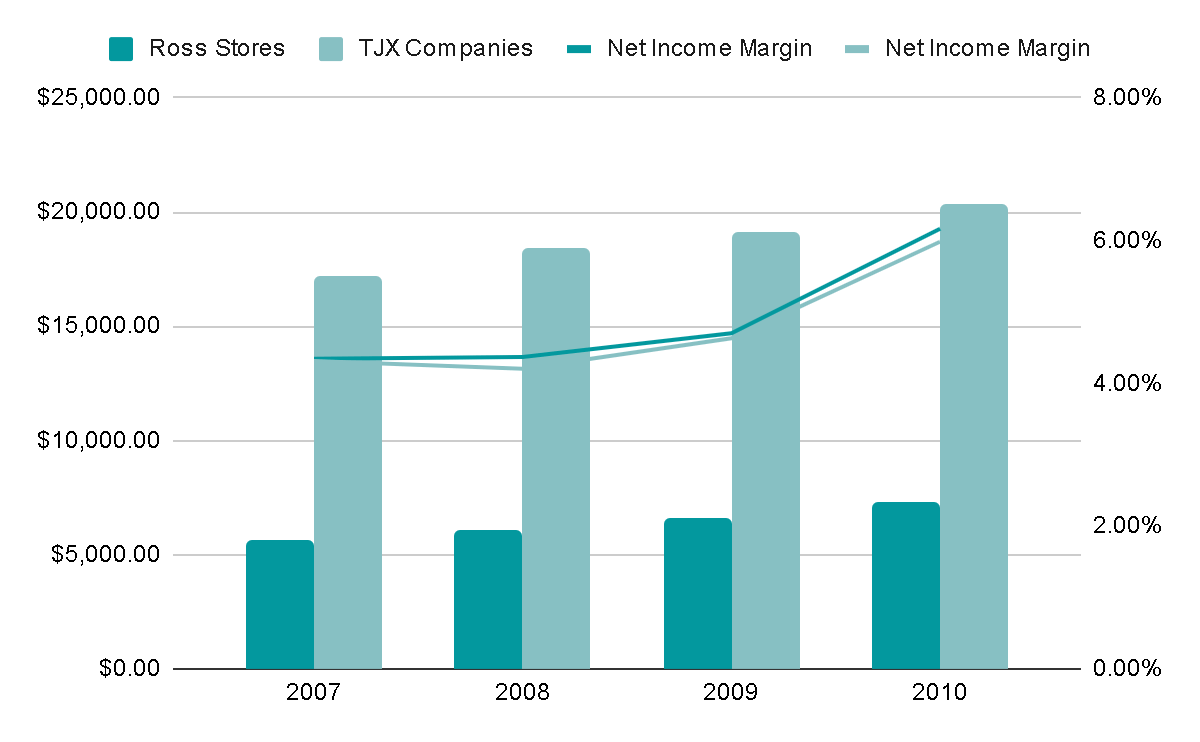
This strategy has played a significant role in the popularity of off-price retailers like Ross, particularly among budget-conscious shoppers seeking quality products at discounted prices. This becomes even more crucial in macroeconomic environments marked by high inflation or concerns about potential recessions, as is the case at present. Examining the performance of these businesses during crises , such as the 2008 financial downturn, reveals that both revenues and margins were not only sustained but also improved . This is because the products offered by off-price stores are perceived as a means for individuals to stretch their paycheck.
Not only are we discussing robust businesses, but the market is also substantial and anticipated to maintain an annual growth rate of 8% until at least 2028. This growth can be attributed to the considerable value users perceive in the products, coupled with the 'treasure hunting' shopping experience within these stores.
Key Ratios and Competitors
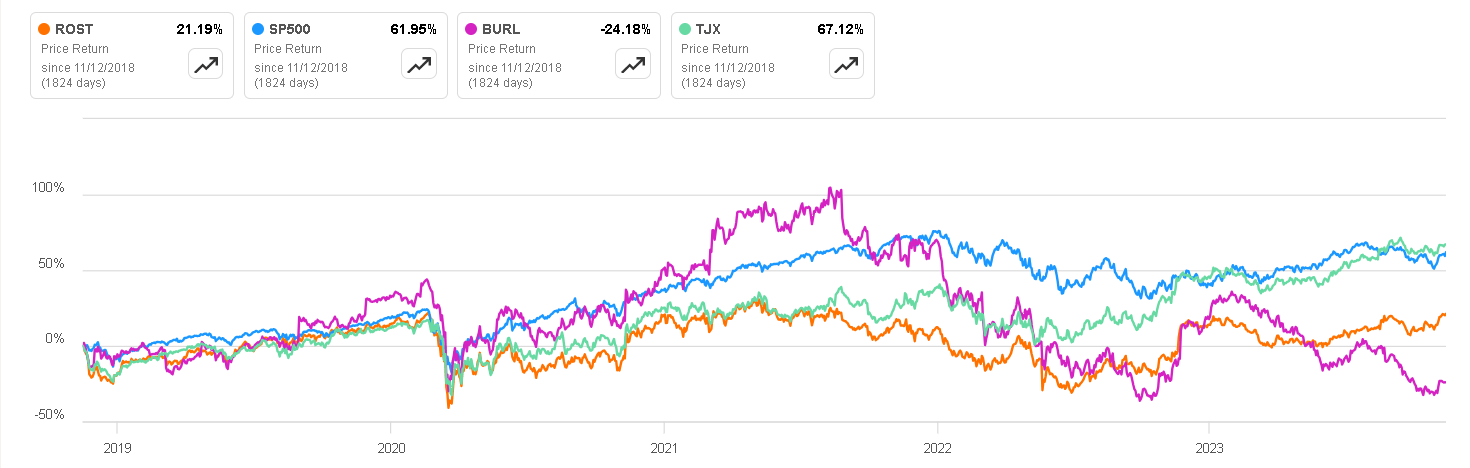
Ross Stores faces direct competition from two main competitors : TJX Companies (NYSE: TJX ), the owner of T.J. Maxx, Marshalls, and HomeGoods, and Burlington (NYSE: BURL ). To assess Ross's performance in comparison to its competitors, we can analyze their respective figures.
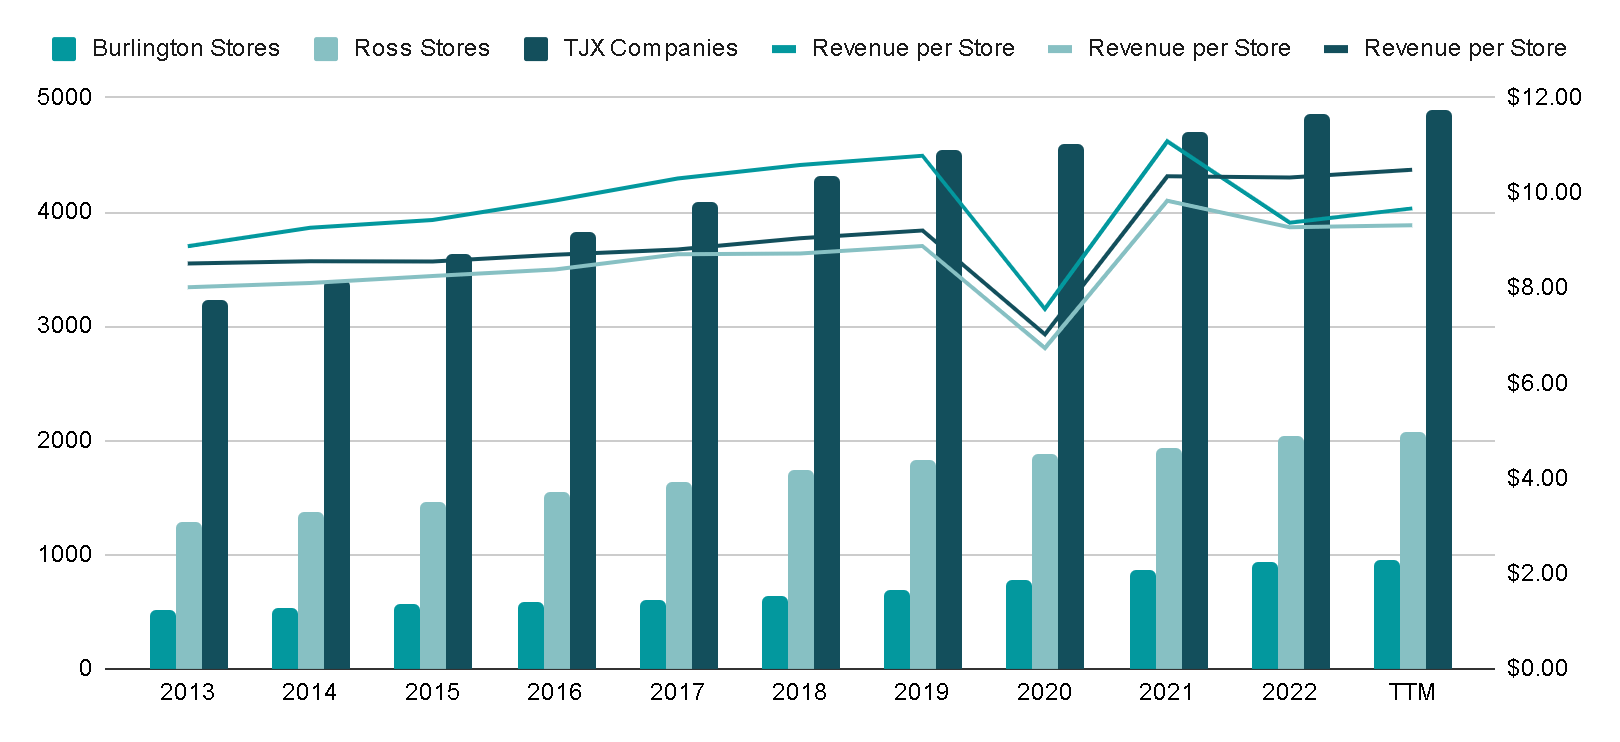
TJX Companies stands out as the competitor with the largest scale, supported by its global presence. When focusing solely on U.S. operations, it maintains its lead with 3,411 stores comprising TJ Maxx, Marshalls, and HomeGoods.
In contrast, Burlington currently operates on a smaller scale with only 939 stores, indicating significant potential for expansion. Notably, Burlington boasts the highest store growth rate among its competitors. Over the past decade, it has achieved an annual expansion rate of 7%, surpassing both Ross Stores, which grew at 5.2% annually, and TJX, with a growth rate of 4.6%.
The revenue per store of the three ranges around $10 million, so there is not a big difference between the profitability of the three.
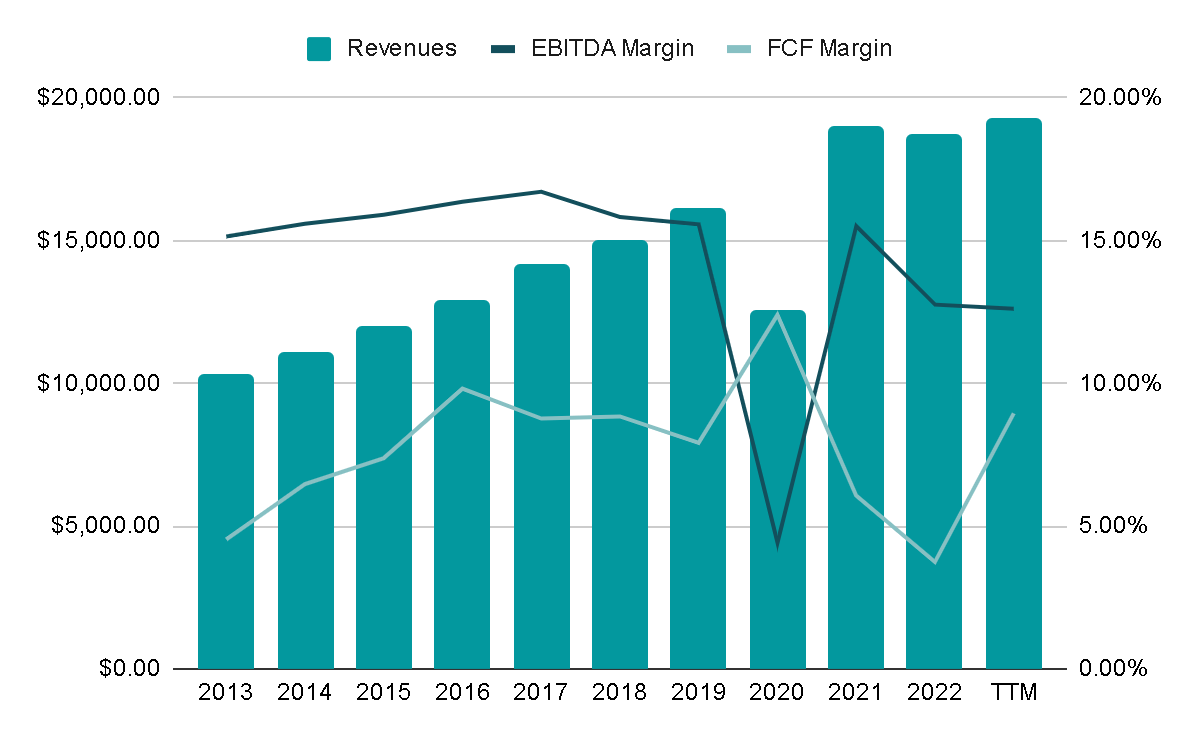
Ross Stores' revenues have grown at a steady annual rate of 7% over the past decade, consistently maintaining average EBITDA margins of 15%. Although not characterized by rapid or exhilarating growth, the stability and sustainability of this growth over time are evident. Furthermore, the continued positive trajectory in the top line is notable, particularly considering the company's existence for over 40 years .
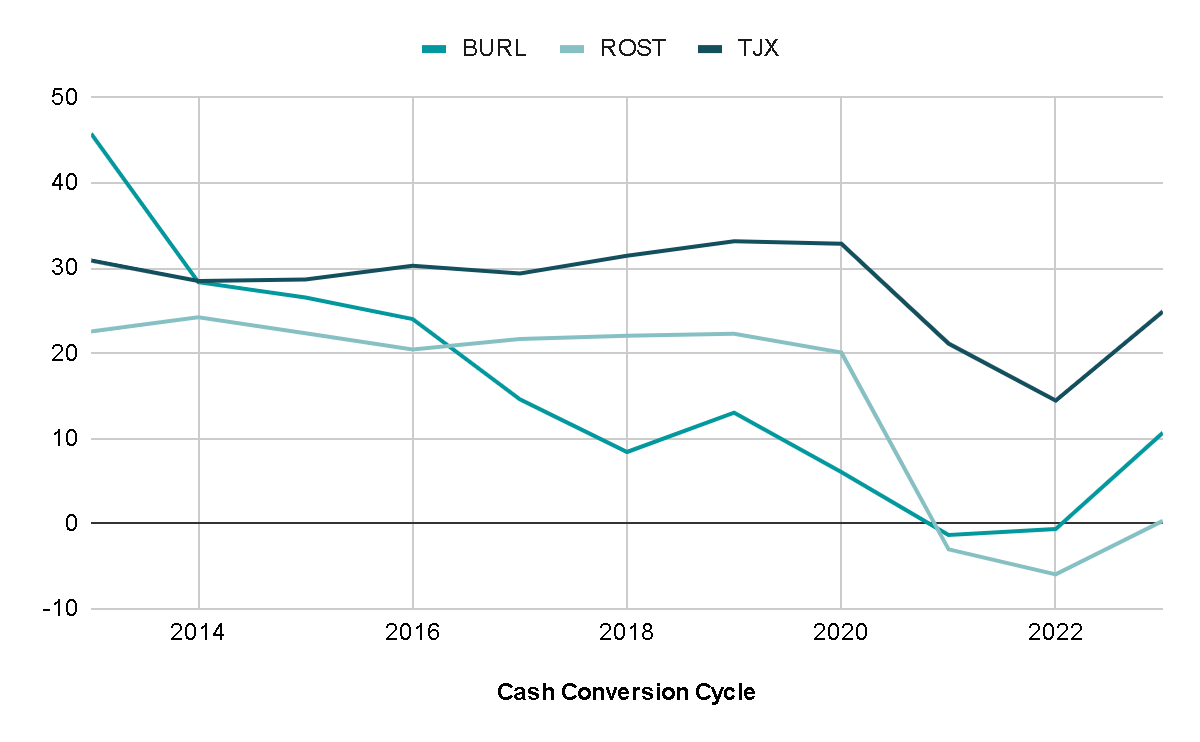
The cash conversion cycle is a metric that discloses the duration it takes for a company to convert the cash invested in inventory back into cash through product sales. This metric is crucial for assessing a retail business's ability to negotiate with suppliers. A company can improve its payment terms by building a strong reputation and achieving substantial sales volume, encouraging suppliers to agree to more favorable terms rather than risk losing a significant client.
In this context, Ross Stores boasts the most favorable cash cycle, with Burlington following closely behind. It is important to note, however, that the metric for TJ Companies may be influenced by its foreign operations, potentially distorting the comparison, but it already gives us a sample of how good ROST is for managing your cash cycle and the benefits it can have on the Free Cash Flow margin.
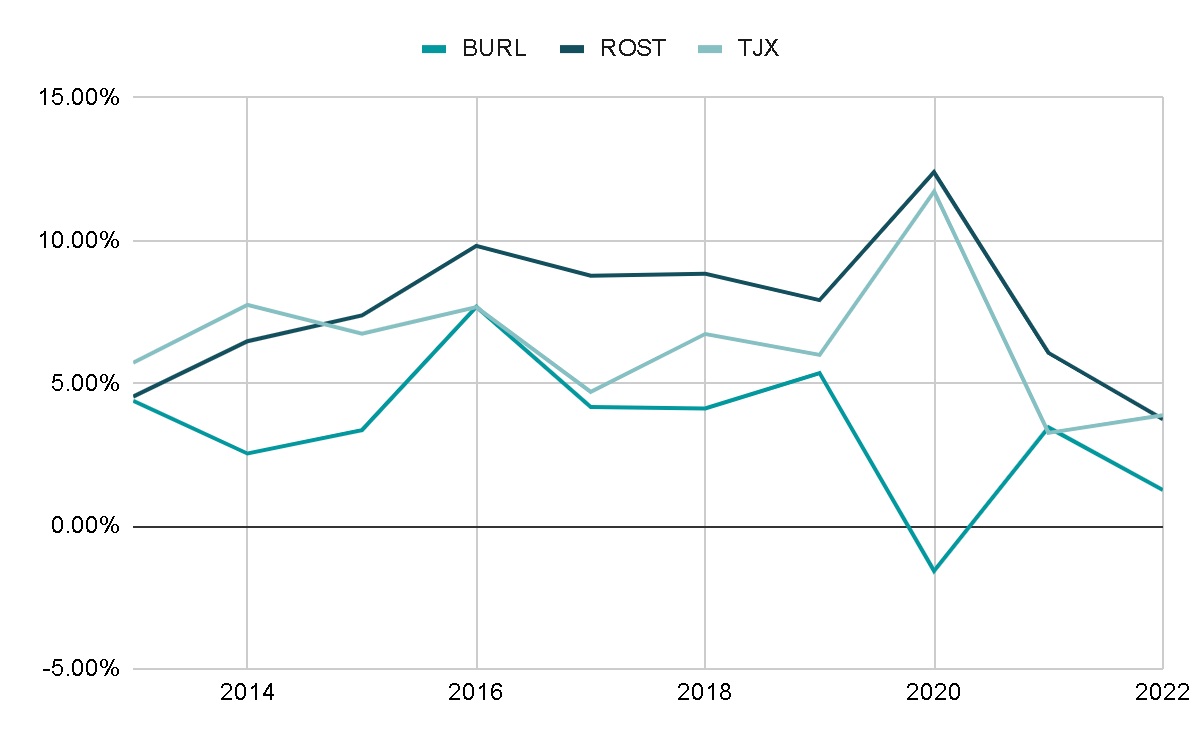
What mentioned before can be observed in the Free Cash Flow margins of each company, as Ross Stores has consistently maintained higher margins since 2015.
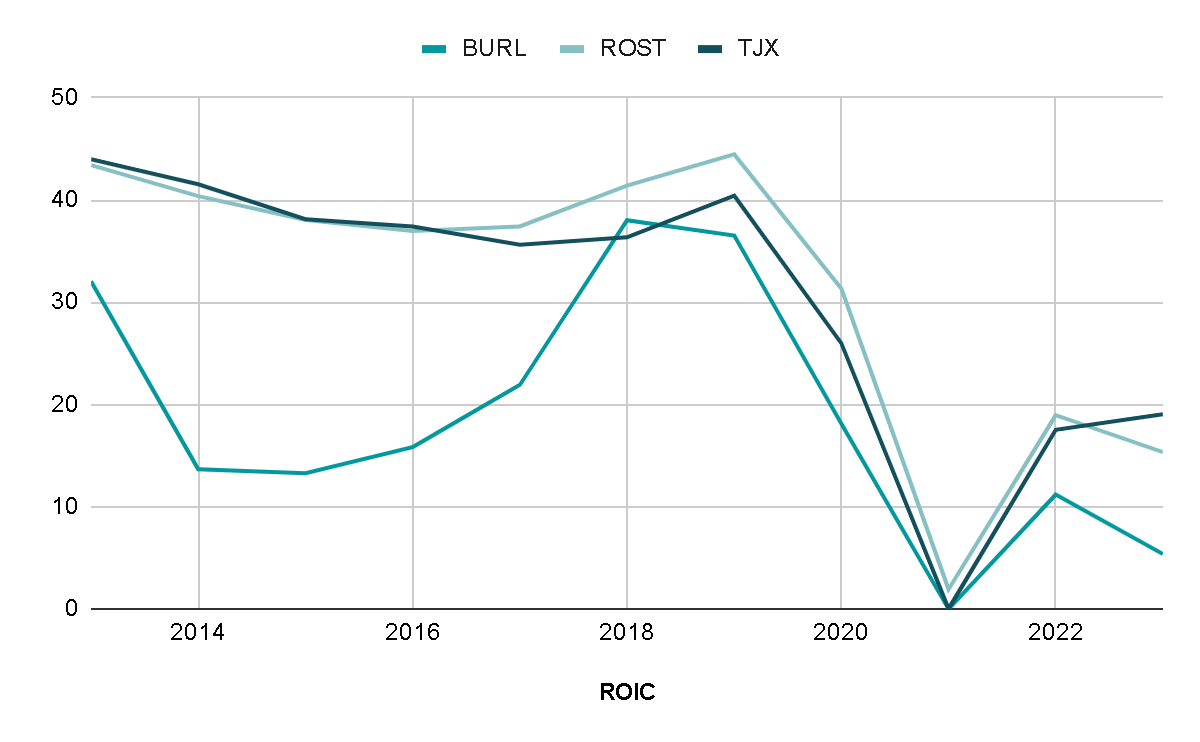
Ross's return on invested capital ((ROIC)) is usually slightly higher among its peers, which is a sign of good capital allocation and competitive advantages.
ROIC also provides insight into how all companies in the sector have faced challenges in regaining their pre-pandemic profitability since the COVID-19 pandemic. With reduced consumer spending in 2020 and ongoing supply chain disruptions in 2022, full recovery remains elusive. To provide perspective, the ROIC averages for the three companies combined were 33% before 2020, but in the last two years has decreased to only 15%.
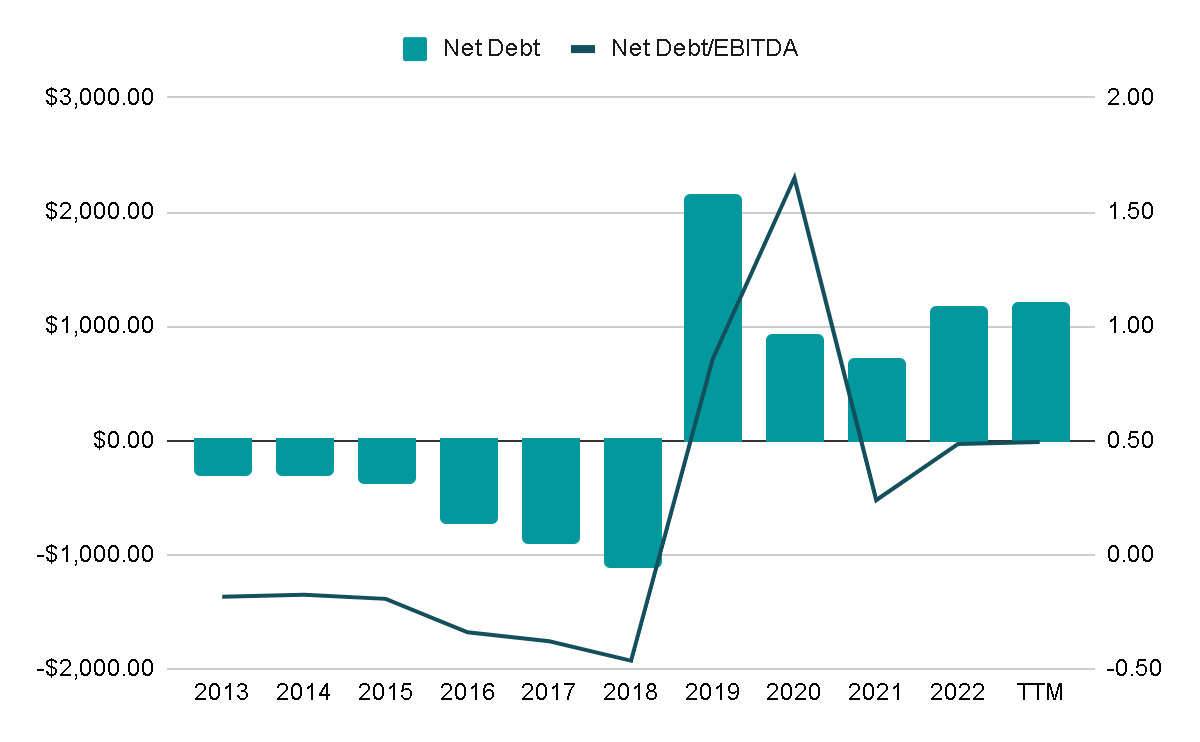
In terms of debt , the company historically operated with negative Net Debt levels, meaning that the cash and cash equivalents on its balance sheet were sufficient to cover its total debt. However, with the onset of COVID-19 and the subsequent economic closures, the company had to issue a significant amount of debt.
Specifically, it transitioned from a ratio of -0.5 to 0.9, which it has managed to reduce to 0.5 at present. It is anticipated that this ratio will continue to decrease, aligning with the company's strategy of maintaining conservative debt levels.
Valuation
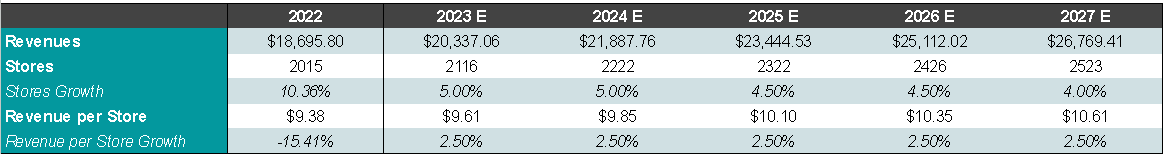
In assessing the valuation, I will focus on key performance indicators (KPIs) crucial for a retail store: the opening of new stores and revenue growth per store .
Ross Stores has consistently opened stores at an annual rate of 7% over the past decade, with revenue per store showing an increase of 0.6%. However, it's important to acknowledge the impact of the years 2020 and 2022 on these metrics. If we exclude these years, the revenue per store would have demonstrated a more robust annual growth of 3%.
In the most recent conference call , the company expressed its intention to open between 100 stores this year and I think this trend could go further. For revenue per store, I will have a conservative approach and assume a 2.5% increase over the next five years.
Turning to store growth, we opened 18 new Ross and nine dd's DISCOUNT locations in the second quarter. We remain on track to open a total of approximately 100 locations this year, comprised of about 75 Ross and 25 dd's.
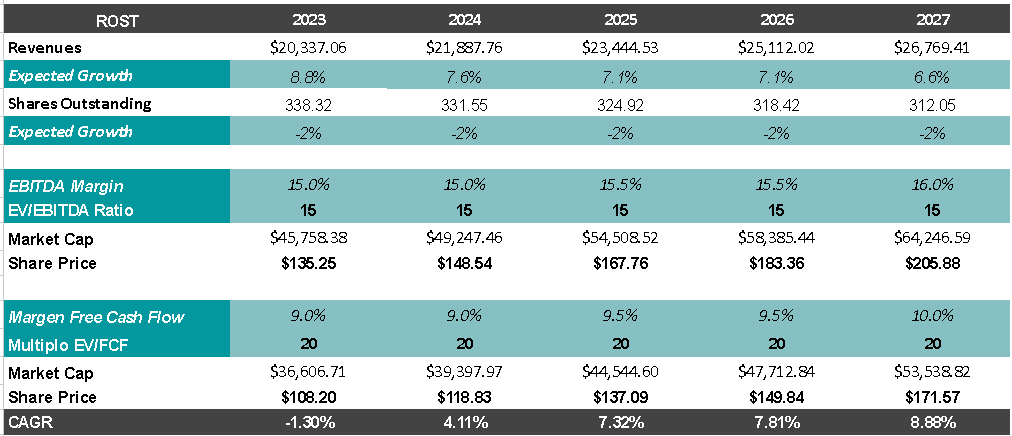
This implies an annual revenue growth of 7% . Assuming the company continues to repurchase shares at the 2% rates seen in previous years, and margins return to the nearly 16% levels achieved before the onset of COVID-19, we could anticipate generating $4.3 billion in EBITDA. Applying multiples consistent with the company's historical performance and comparable benchmarks, a projected share price range of $145 to $165 USD within five years could be expected. This represents an annual return of 4.7% , in addition to the 1% dividend.
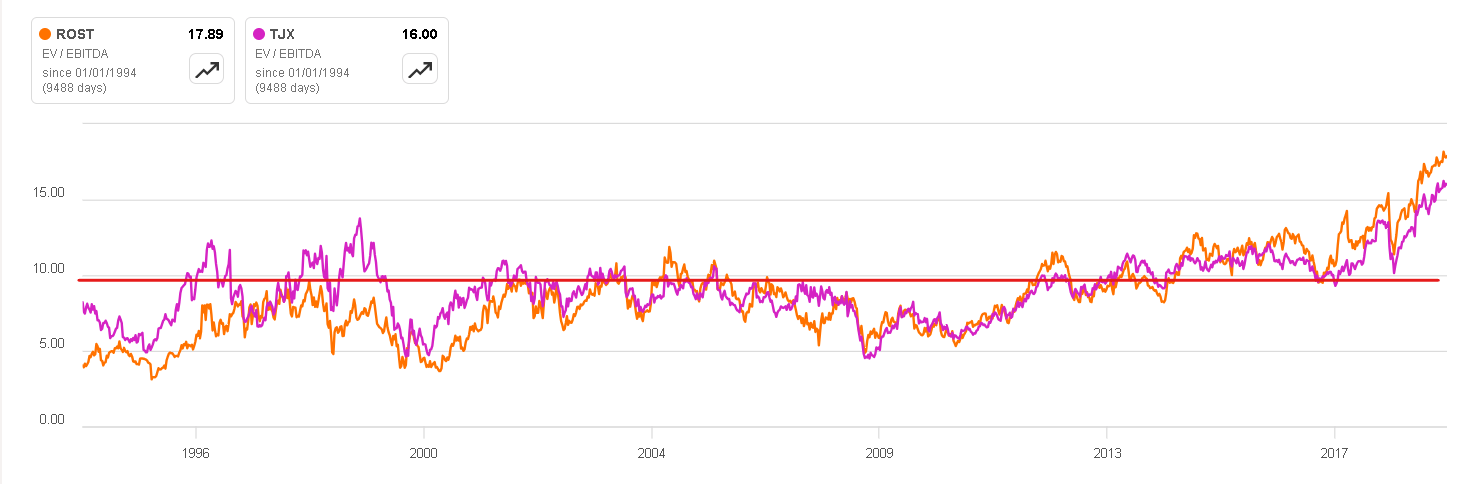
I believe the modest return is attributed to the market's awareness of the defensive nature of these companies. Currently, there is a willingness to pay nearly 18x EBITDA for the stability these assets provide. However, historically, the average for Ross Stores and TJ Companies has hovered around 10-12x EBITDA. If the economy returns to normal and the market's perception of fear diminishes, there is a likelihood of a rotation from stable assets to growth or somewhat more speculative stocks. In such a scenario , companies like ROST could experience a compression in their valuation.
Final Thoughts
Ross Stores has demonstrated its resilience as a highly defensive business, maintaining relevance over many years. Moreover, the potential for growth seems promising, with room for an increase in store count in the USA and potential international expansion, as observed in the case of TJ Companies.
However, despite these positive aspects, the current valuation does not offer a compelling return, leading me to advocate for a ' hold ' rating rather than a purchase. And if you are still interested in positioning yourself in a company with these characteristics, similar companies, like Burlington , appear more attractive to me at present due to their potentially higher growth and margin expansion.
For further details see:
Ross Stores: Valuation Not As Attractive As That Of Its Peers