FNV - Royal Gold: A Streamer For The Long Term
2023-09-06 16:12:36 ET
Summary
- Royal Gold, Inc. reported a net income of $63.45 million in Q2 2023, with adjusted earnings per share of $0.88.
- The company's revenue for the quarter was $144.04 million, with gold accounting for 77% of the revenue.
- Royal Gold has a strong balance sheet, with $702 million in liquidity and a quarterly dividend of $0.375 per share.
- I recommend buying Royal Gold, Inc. between $107 and $105.5 with possible lower support at $104.35.
Introduction
Denver-based Royal Gold, Inc. ( RGLD ) is one of the reliable streamers I have regularly covered on Seeking Alpha since September 2018.
This article covers the Q2 2023 earnings released on August 2, 2023, and all the following new information. This article updates my preceding article on RGLD, published on June 5, 2023.
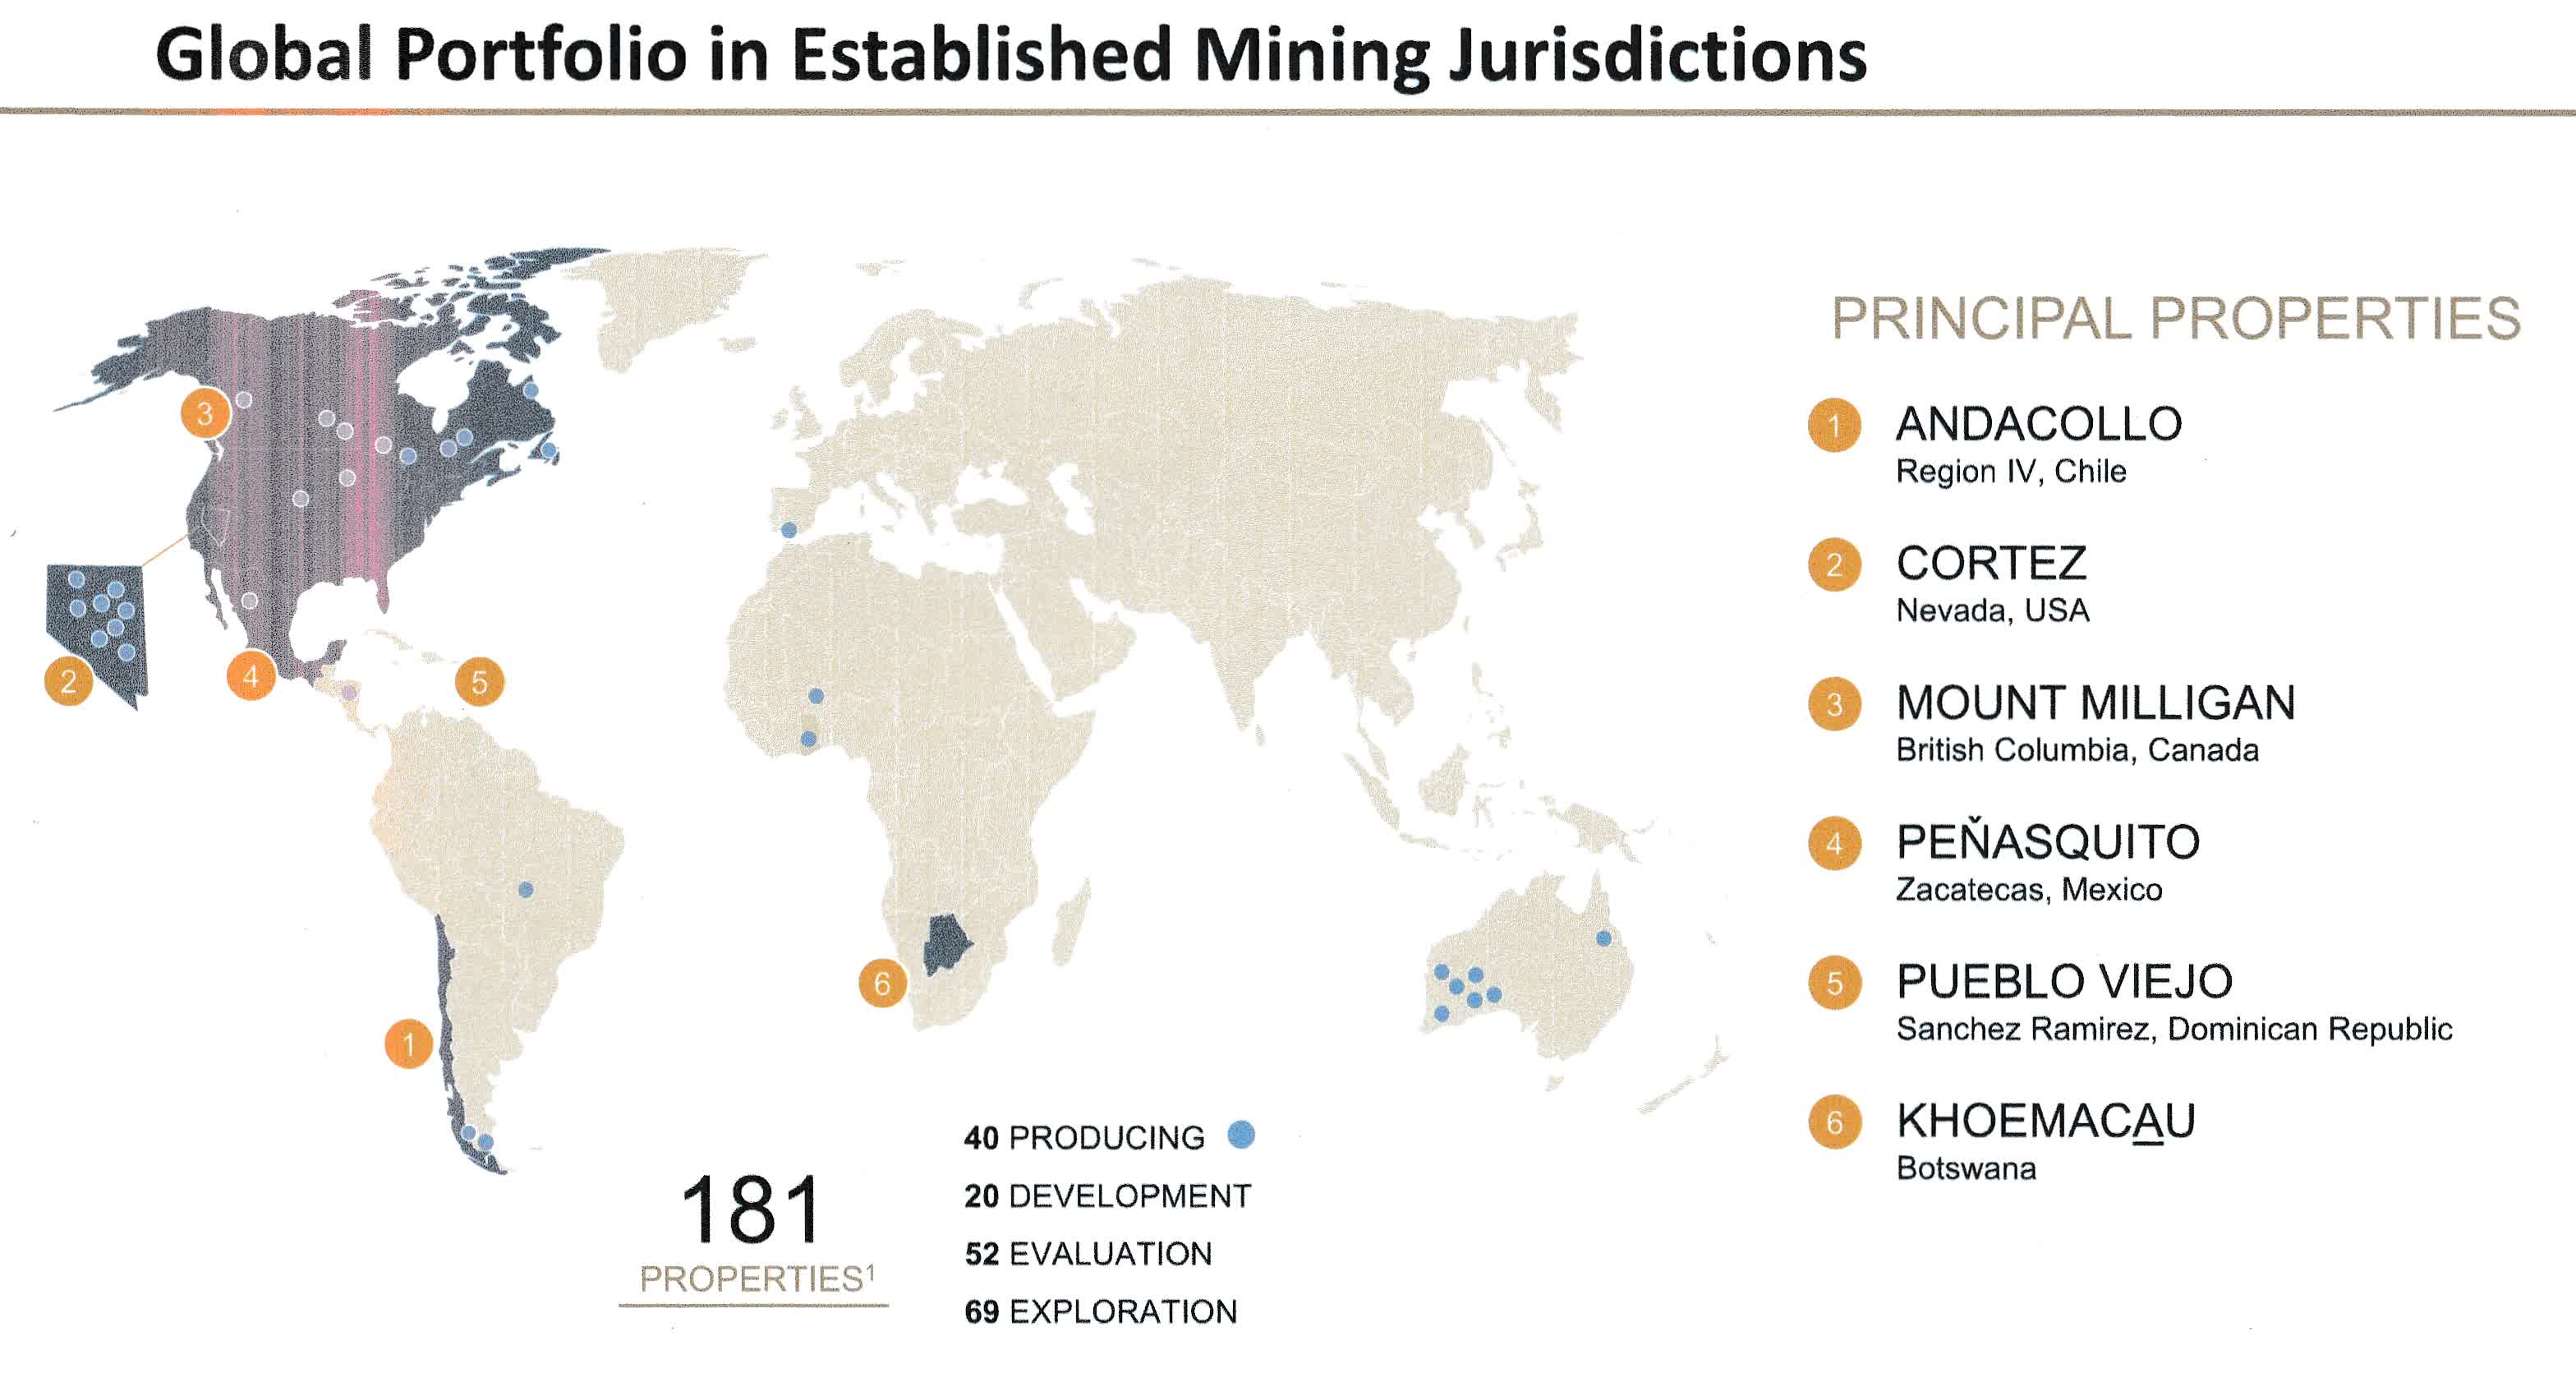
RGLD has a solid asset portfolio with six principle-producing mines and 181 properties as of June 30, 2023. The Map below is from the August Presentation.
RGLD Assets Map (RGLD Presentation)
1 - 2Q23 Results Snapshot and recent activity
Royal Gold posted a net income of $63.45 million , or $0.97 per diluted share, compared to $71.14 million, or $1.08 per basic and diluted share, in the second quarter of 2022. The adjusted earnings per share were $0.88 in the second quarter of 2023.
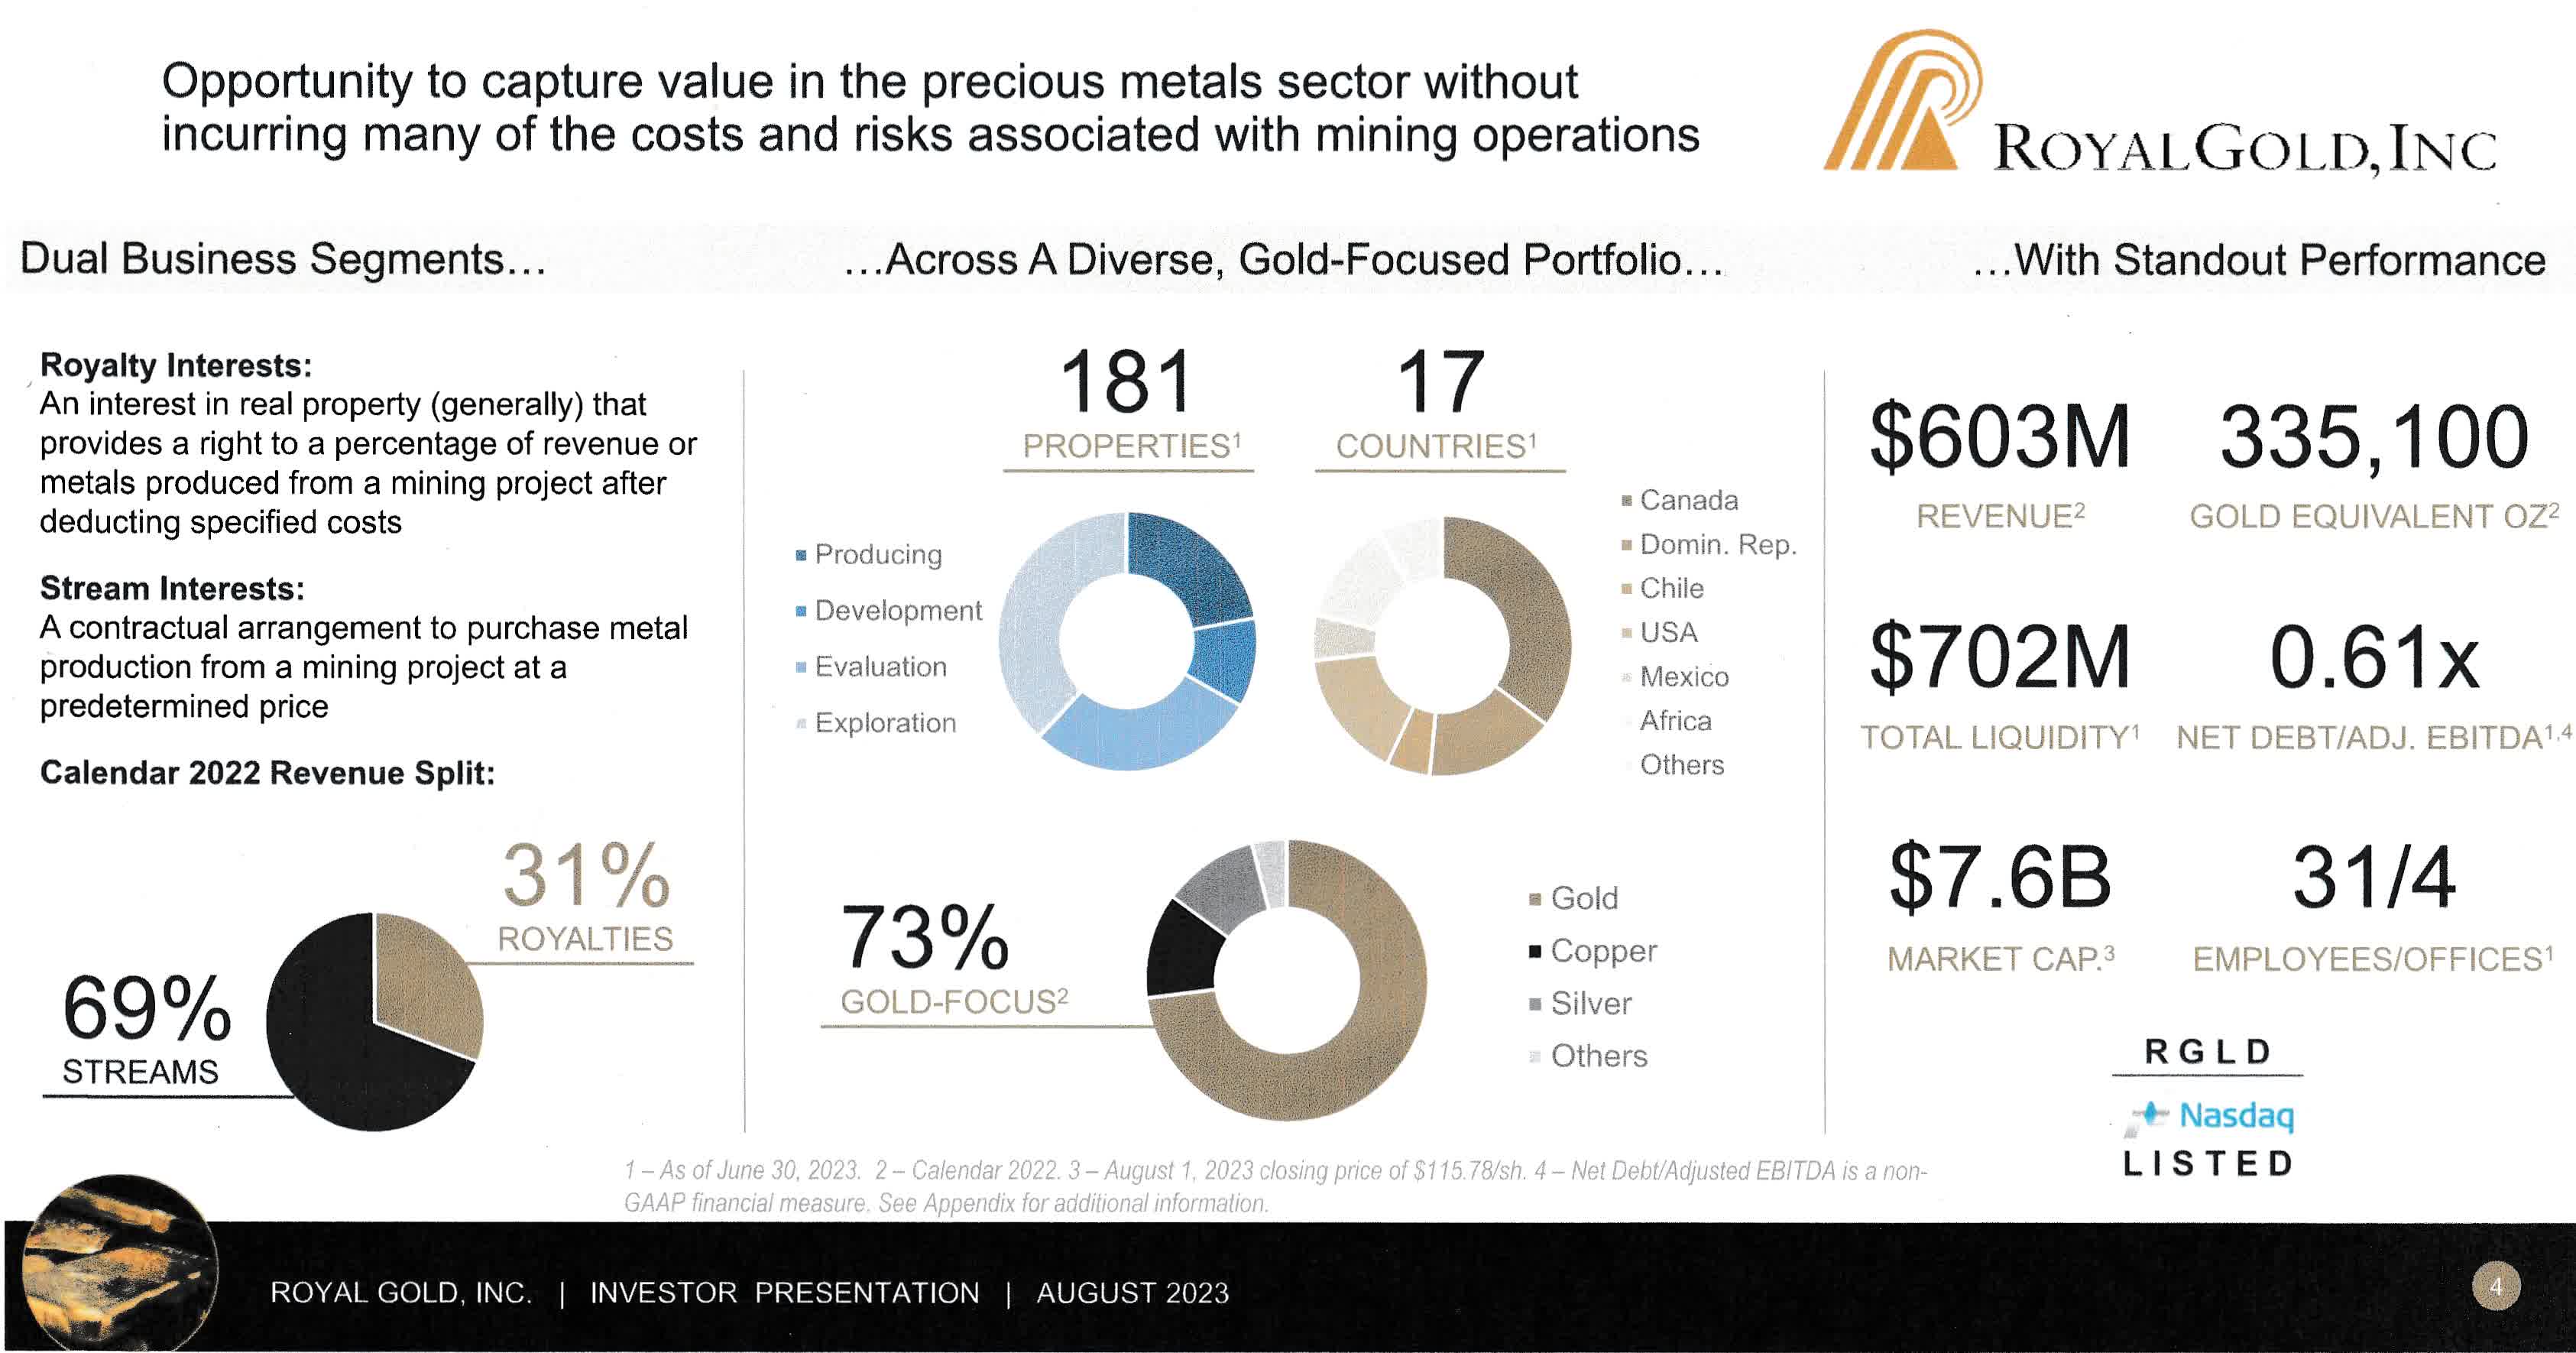
RGLD Company Overview 2Q23 (RGLD Presentation)
During the second quarter, Royal Gold posted total revenue of $144.04 million , comprised of stream revenue of $106.02 million and royalty revenue of $38.03 million at an average gold price of $1,976 per ounce, an average silver price of $24.13 per ounce and an average copper price of $3.84 per pound .
Gold equivalent production was significantly down in 2Q23 with 72.9K GEOs. Metal Production was 39.0K Au ounces, 620K Ag ounces, and 2.5 Moz of Copper.
Royal Gold still has an excellent debt profile, with a net debt of $293.84 million and $702 million in liquidity.
2 - Investment Thesis
Royal Gold, Inc. is an excellent long-term investment with significant liquidity at about $702 million after funding three large projects. The company pays a quarterly dividend of $0.375 per share in 2Q23 or a yield of 1.40%, which aligns with its peers FNV and WPM.
RGLD's strength is its geographically and operationally diverse portfolio based mainly on Gold. The revenue split for 2Q23 was: 77% gold, 15% silver, 6% copper
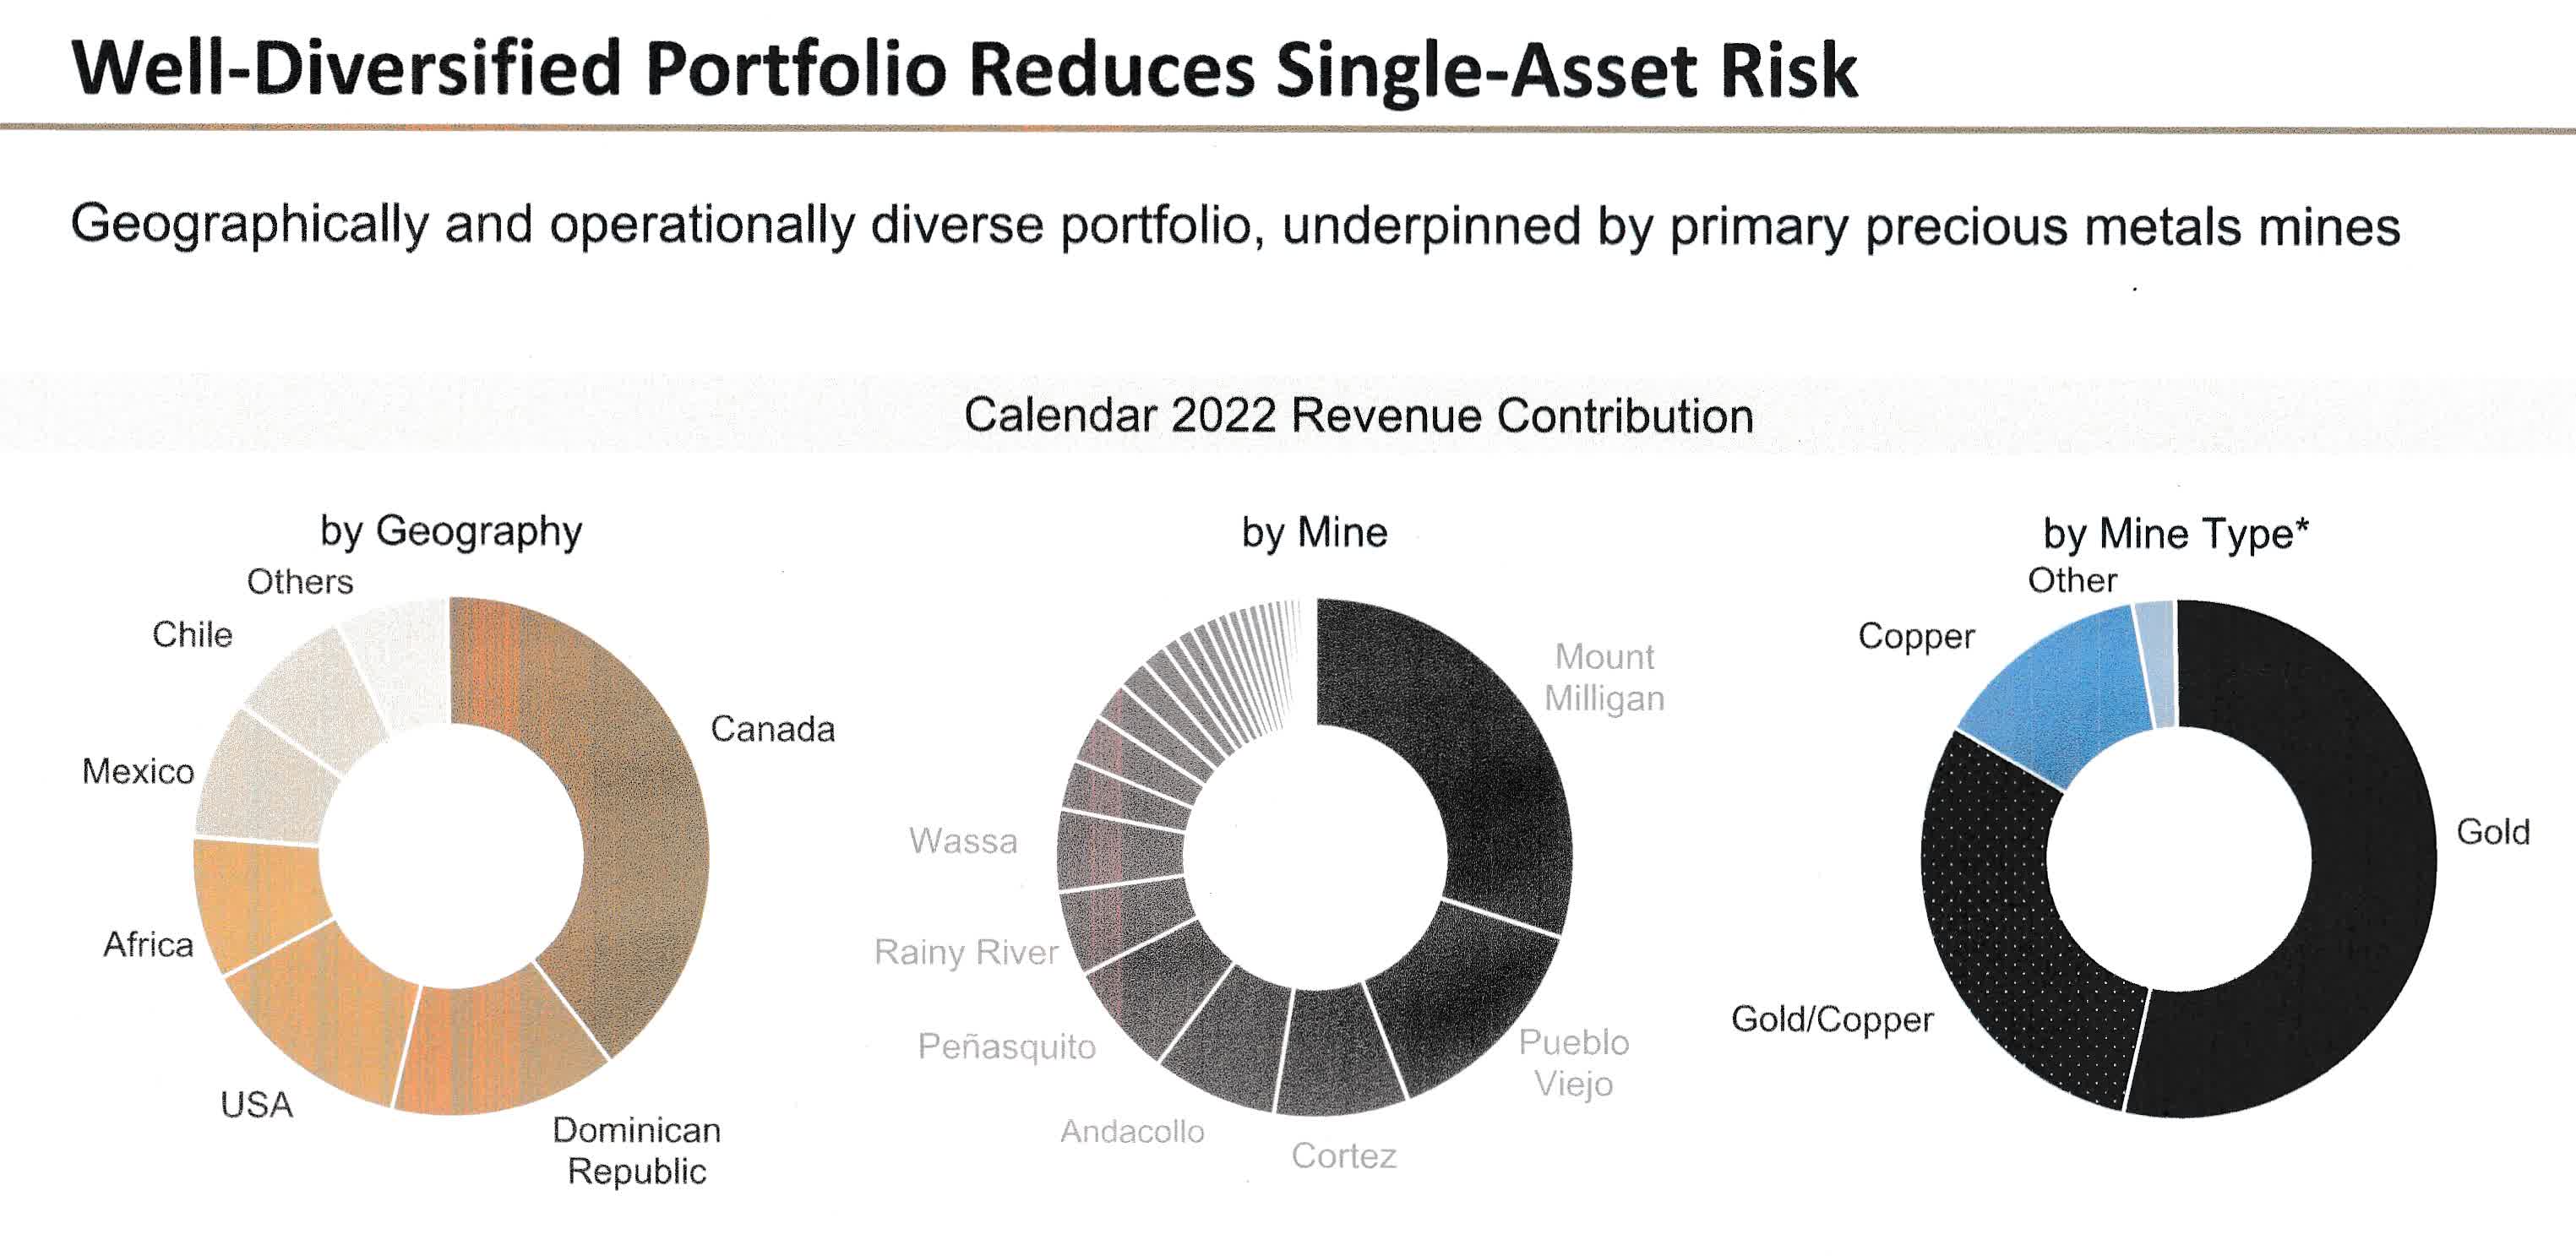
Below is the 2022 calendar revenue distribution:
RGLD Diversified Portfolio (RGLD August Presentation)
One recent new potential acquisition is yet to be agreed upon.
Royal Gold will get gold royalties from the Serrote mine, while the Santa Rita mine will provide it with gold, platinum, and palladium. The company will also receive royalties for copper and nickel from both locations.
CEO Bill Heissenbuttel said in the conference call (emphasis added):
With respect to potential new business during the quarter, we announced the signing of a With respect to potential new business during the quarter, we announced the signing of a commitment letter to acquire precious and base metal royalties for $250 million on the producing Serrote and Santa Rita mines in Brazil as part of the acquisition financing of the mines by ACG Electric Metals. l as part of the acquisition financing of the mines by ACG Electric Metals.
I do not own RGLD because I already own Franco-Nevada Corporation ( FNV ), Wheaton Precious Metals Corp. ( WPM ), and Sandstorm Gold Ltd. ( SAND ). Still, I consider RGLD one of the strongest with Franco-Nevada and Wheaton Precious Metals.
I recommend short-term trading LIFO, 40%-50% of your long-term position, due to the volatility of the streams & royalties industry and gold price fluctuation.
3 - Stock Performance
Royal Gold, Inc. has dropped significantly since May 2023 after the Fed turned hawkish again and signaled more rate increases.
Royal Gold is up 20% on a one-year basis, which is in line with its peers, excluding SAND, which continues to underperform and is down 7%.
Royal Gold Inc: Balance Sheet And Production History Ending In 2Q23 - The Raw Numbers
| Royal Gold |
| 2Q22 |
| 3Q22 |
| 4Q22 |
| 1Q23 |
| 2Q23 |
| Total Revenues in $ Million |
| 146.44 |
| 131.43 |
| 162.98 |
| 170.39 |
| 144.04 |
| Net Income in $ Million |
| 71.14 |
| 45.79 |
| 56.37 |
| 63.88 |
| 63.45 |
| EBITDA $ Million |
| 110.82 |
| 103.46 |
| 124.54 |
| 135.45 |
| 112.45 |
| EPS diluted in $/share |
| 1.08 |
| 0.70 |
| 0.86 |
| 0.97 |
| 0.97 |
| Operating cash flow in $ Million |
| 120.20 |
| 94.99 |
| 101.03 |
| 108.66 |
| 107.93 |
| Capital Expenditure in $ Million |
| 0.04 |
| 677.99 |
| 206.33 |
| 0.00 |
| 0.00 |
| Free Cash Flow in $ Million |
| 120.16 |
| -583.00 |
| -105.30 |
| 108.66 |
| 107.93 |
| Total cash in $ Million |
| 280.62 |
| 122.24 |
| 118.59 |
| 126.82 |
| 106.16 |
| Long-term debt in $ Million |
| 0 |
| 446.33 |
| 571.57 |
| 496.82 |
| 395.53 |
| Dividend per share in $ |
| 0.35 |
| 0.35 |
| 0.375 |
| 0.375 |
| 0.375 |
| Shares outstanding (diluted) in Million |
| 65.68 |
| 65.66 |
| 65.66 |
| 65.71 |
| 65.76 |
| Gold Production |
| 2Q22 |
| 3Q22 |
| 4Q22 |
| 1Q23 |
| 2Q23 |
| Gold Equivalent ounce Production K Geo |
| 78.3 |
| 76.0 |
| 94.3 |
| 92.0 |
| 72.9 |
| Gold price realized $/ GEO |
| 1,871 |
| 1,729 |
| 1,726 |
| 1,869 |
| 1,976 |
Data Source: Company release and Fun Trading.
Analysis: Revenues, Earnings Details, Free Cash Flow, Debt, And Production Details
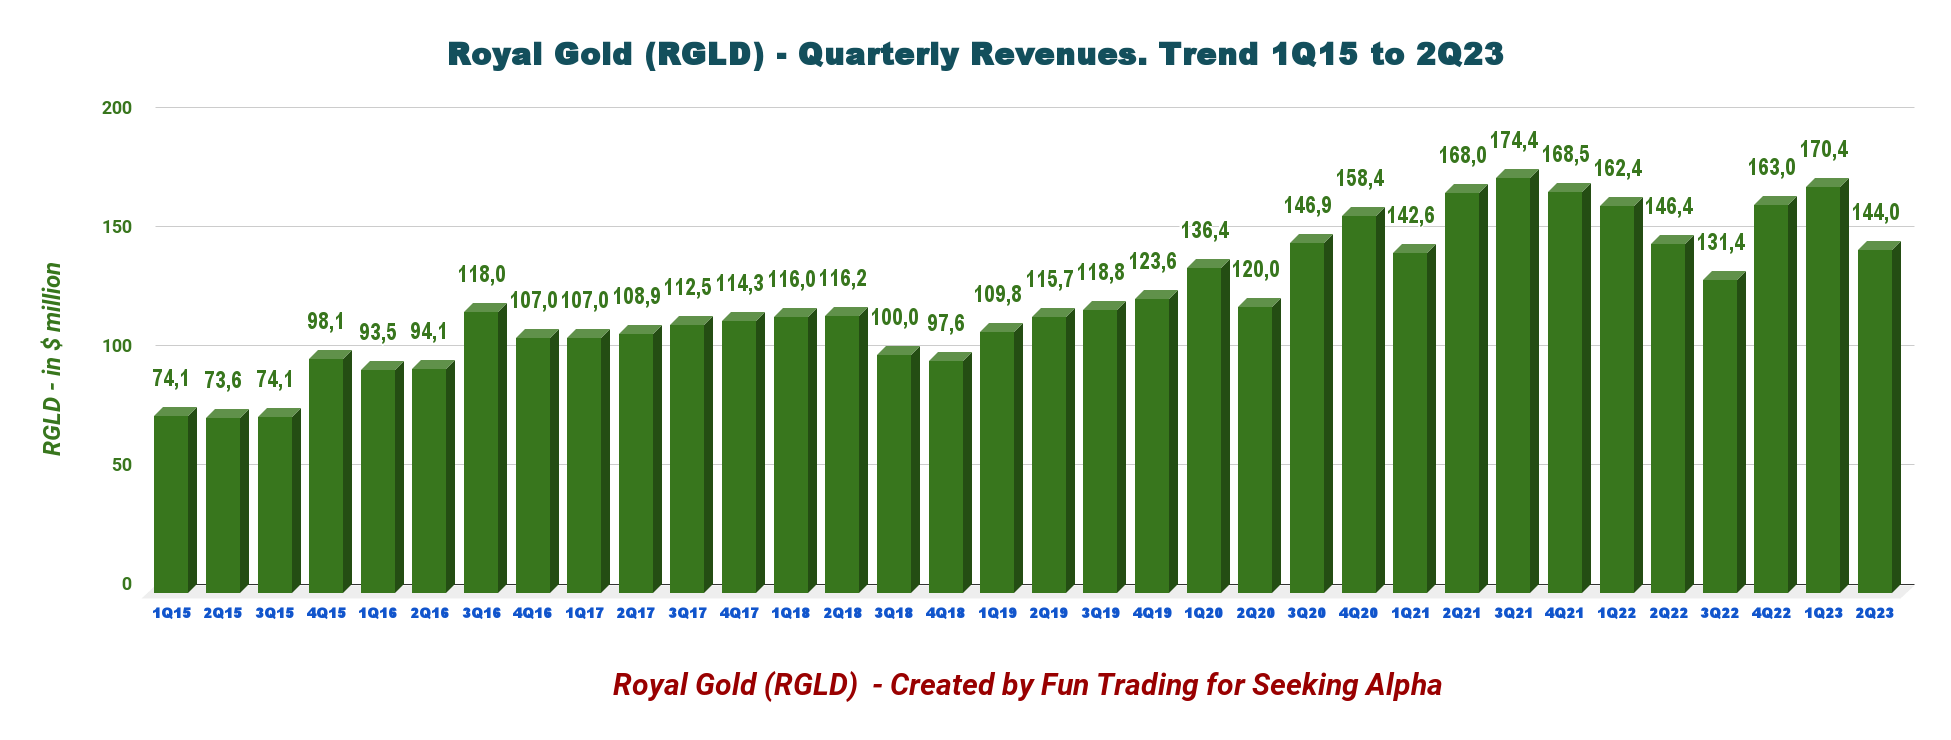
1 - Revenues Were $144.04 Million in 2Q23
RGLD Quarterly Revenues History (Fun Trading)
As of June 30, 2023, Royal Gold reported total revenues of $144.04 million, comprised of stream revenue of $106.015 million and royalty revenue of $38.027 million at an average gold price of $1,976 per ounce , an average silver price of $24.13 per ounce and an average copper price of $3.84 per pound.
The decrease in total revenue in the second quarter was due to lower gold sales at Andacollo, lower copper sales at Mount Milligan, and lower gold and silver production attributable to our interest at Peñasquito.
The drop in revenue this quarter was lower sales of metal, the impact of the strike at Penasquito , and a shutdown of the Long Harbour processing plant at Voisey's Bay.
The downward impacts on the revenue this quarter from Penasquito and Voisey's Bay were partially offset by new revenue of approximately $6 million from the additional Cortez royalty interest acquired during H2 2022.
The decrease was offset by higher gold production attributable to Cortez due to the newly acquired royalties and higher Gold and Silver prices compared to the prior year period.
Net Income for the quarter was $63.45 million or $0.97 per diluted share , from $71.14 million or $1.08 per diluted share last year. Adjusted earnings were $57.2 million or $0.88 per share.
Net cash provided by operating activities totaled $107.93 million for the second quarter, compared to $120.20 million for the prior year. The decrease was mostly due to higher interest payments on amounts outstanding under the revolving credit facility and lower royalty revenue than the previous year's period.
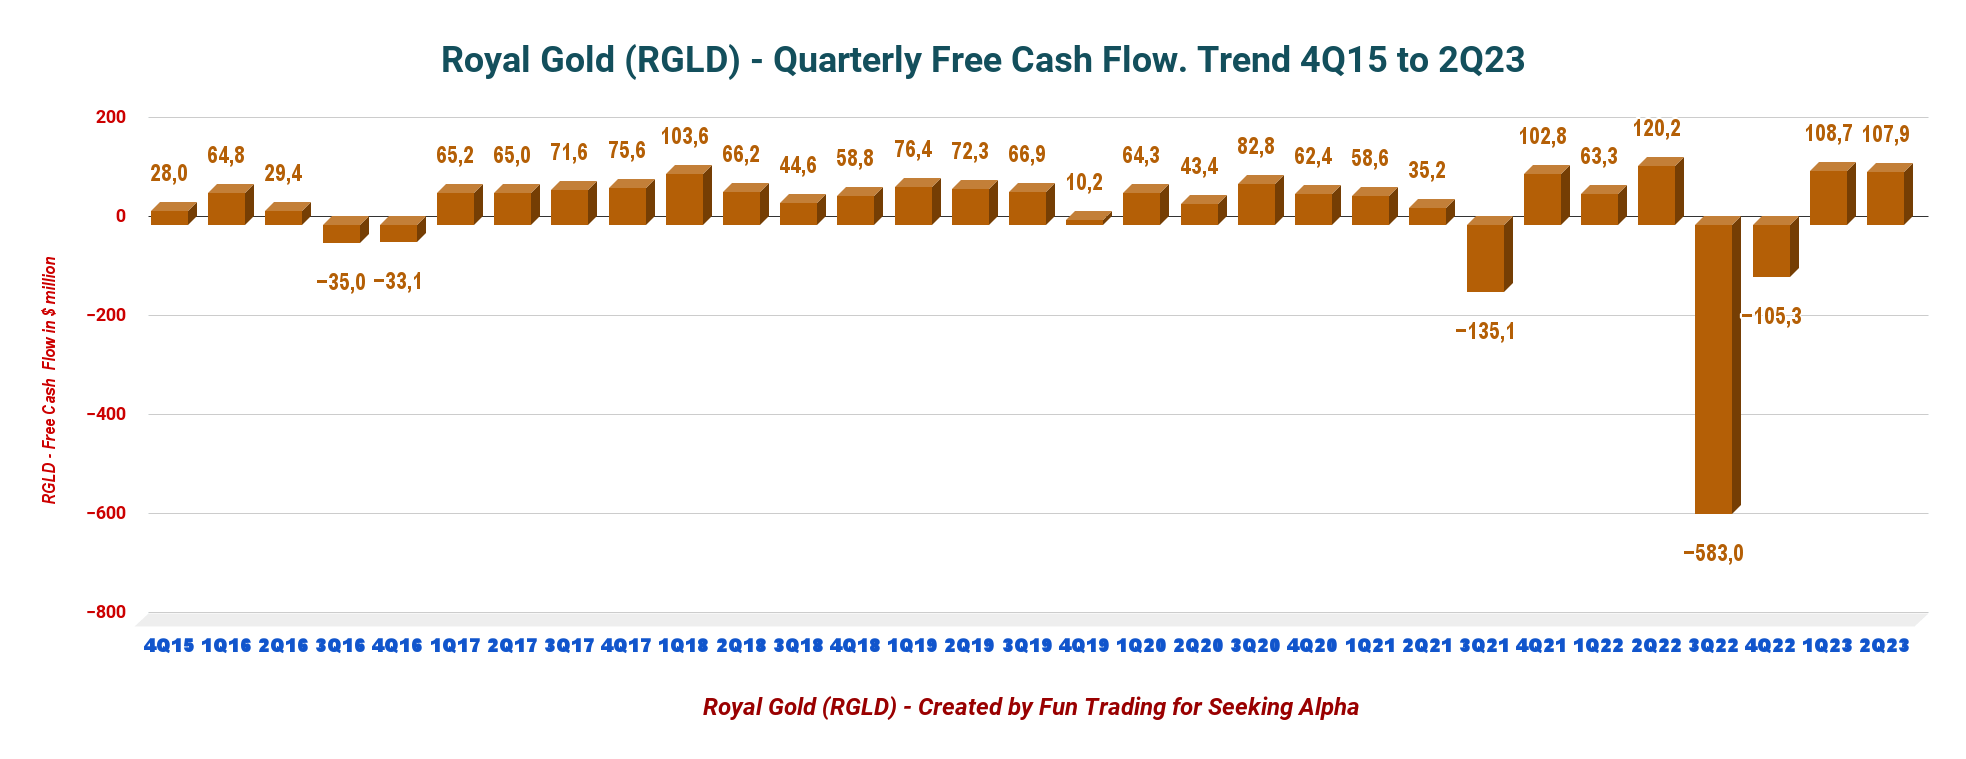
2 - Free Cash Flow was $107.93 million in 2Q23
RGLD Quarterly Free Cash Flow History (Fun Trading)
Note: The free cash flow is the cash from operating activities minus CapEx.
The quarterly free cash flow was $107.93 million in 2Q23 , and the trailing 12-month free cash flow was negative $351.55 million.
The quarterly dividend is $0.375 per share for 2Q23.
Note: As I have indicated in my prior article, the Free cash flow is negative for the year after Royal Gold acquired a sliding-scale gross royalty (the "Cortez Complex Royalty") on an area including the Cortez mine operational area and the Fourmile development project in Nevada (the "Cortez Complex") for $525 million in cash consideration. Also, On September 9, 2022, Royal Gold announced that it had completed the previously announced acquisition of all of the issued and outstanding shares of Great Bear Royalties Corporation for approximately $151.7 million in cash consideration.
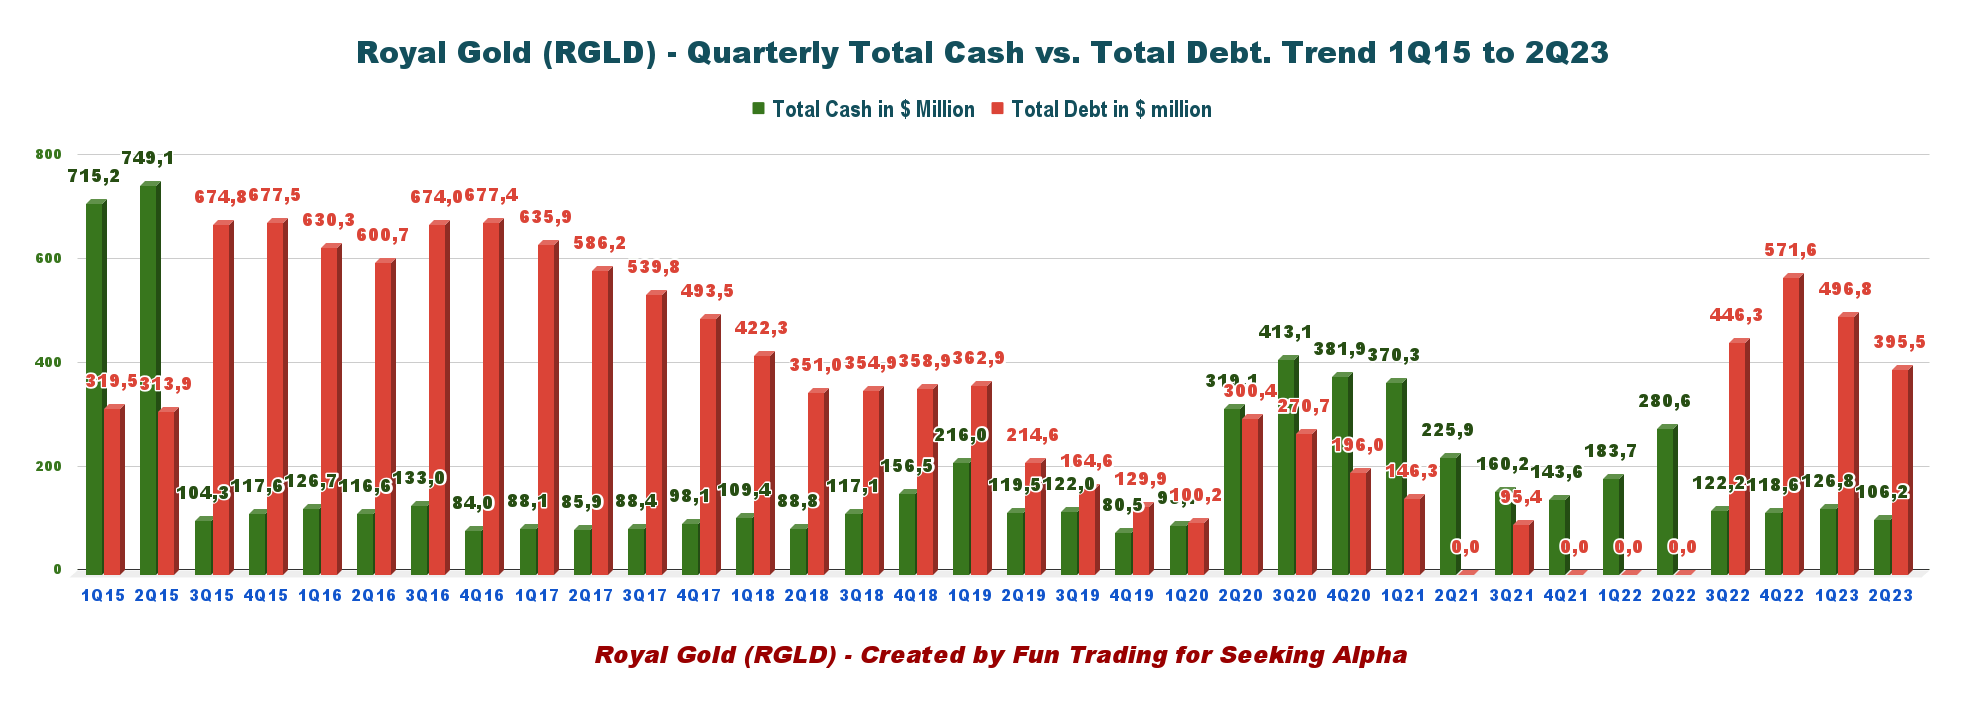
3 - $703 million available in Liquidity on June 30, 2023
RGLD Quarterly Cash versus Debt History (Fun Trading)
RGLD had a debt of $395.53 million in 2Q23. Liquidity was $702 million , with total cash of $106.16 million at the end of June 2023.
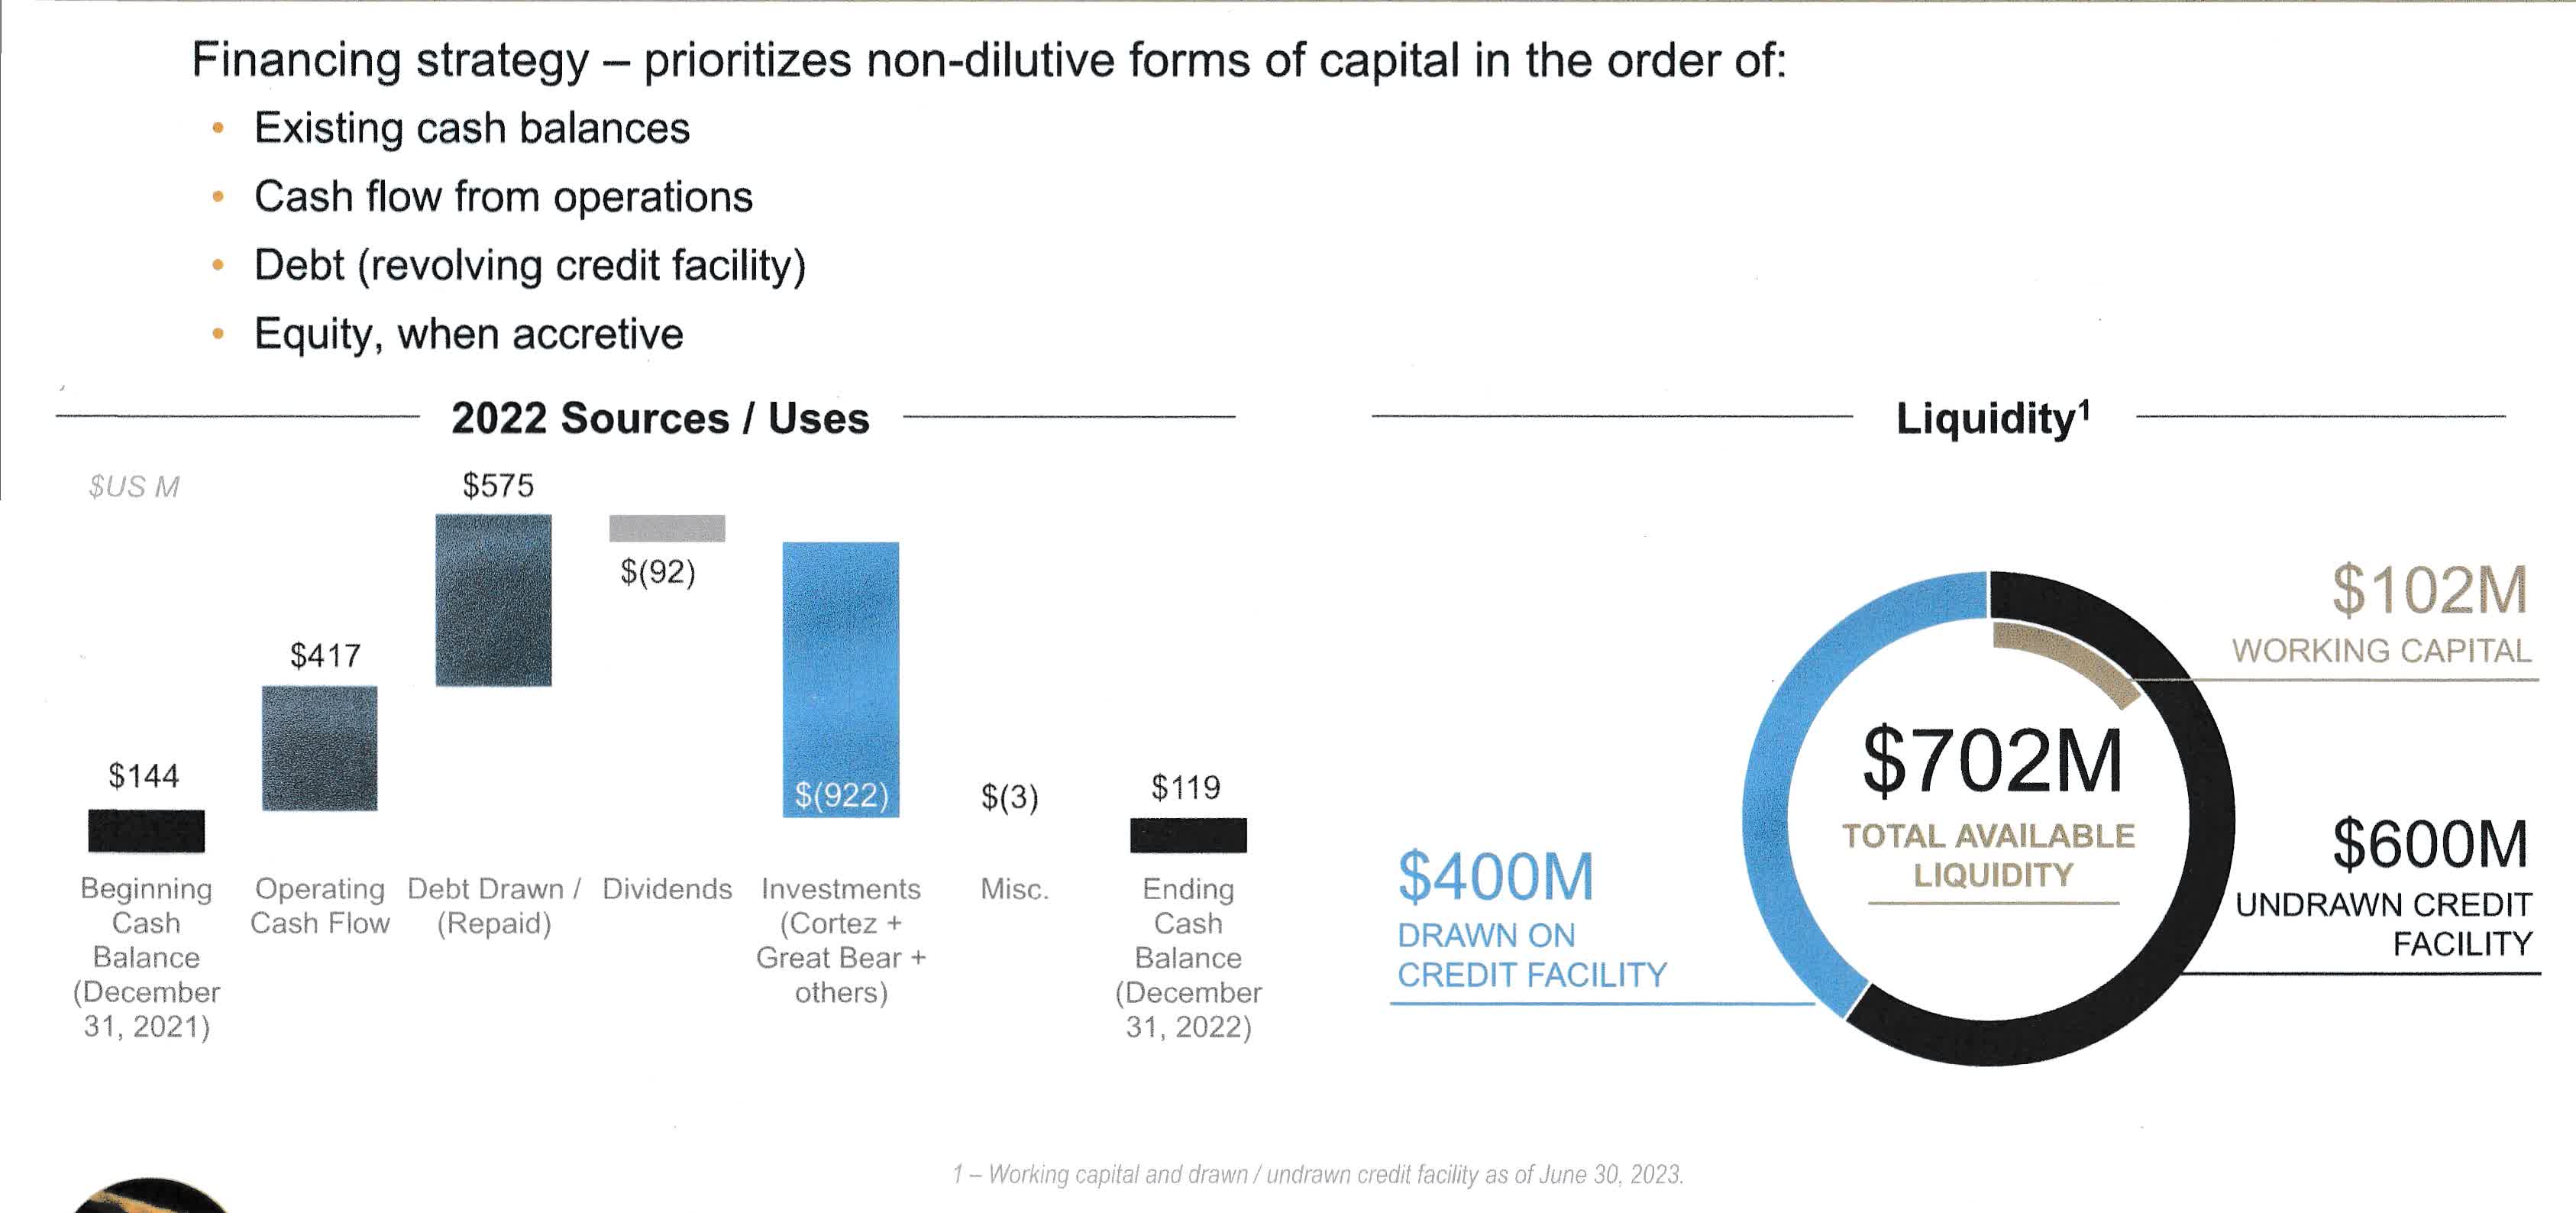
RGLD Balance Sheet (RGLD Presentation)
On June 30, 2023, RGLD had current assets of $165.3 million compared to current liabilities of $63.1 million , which resulted in a working capital of $102.2 million and a current ratio of approximately 3 to 1 .
RGLD extended the maturity of its $1 billion revolver to June 2028, in which $600 million was still undrawn as of June 2023.
CFO Paul Libner said in the conference call:
During the quarter, we repaid $100 million on the revolving credit facility and reduced the amount drawn on the facility to $400 million. For the first six months of 2023, we have repaid $175 million of our revolver balance. And in keeping with our approach to capital allocation, we expect to repay the remaining $400 million in a revolver balance as cash flow allows. The $600 million undrawn revolver capacity, combined with $102 million of working capital, provided us total available liquidity of just over $700 million at the end of the quarter.
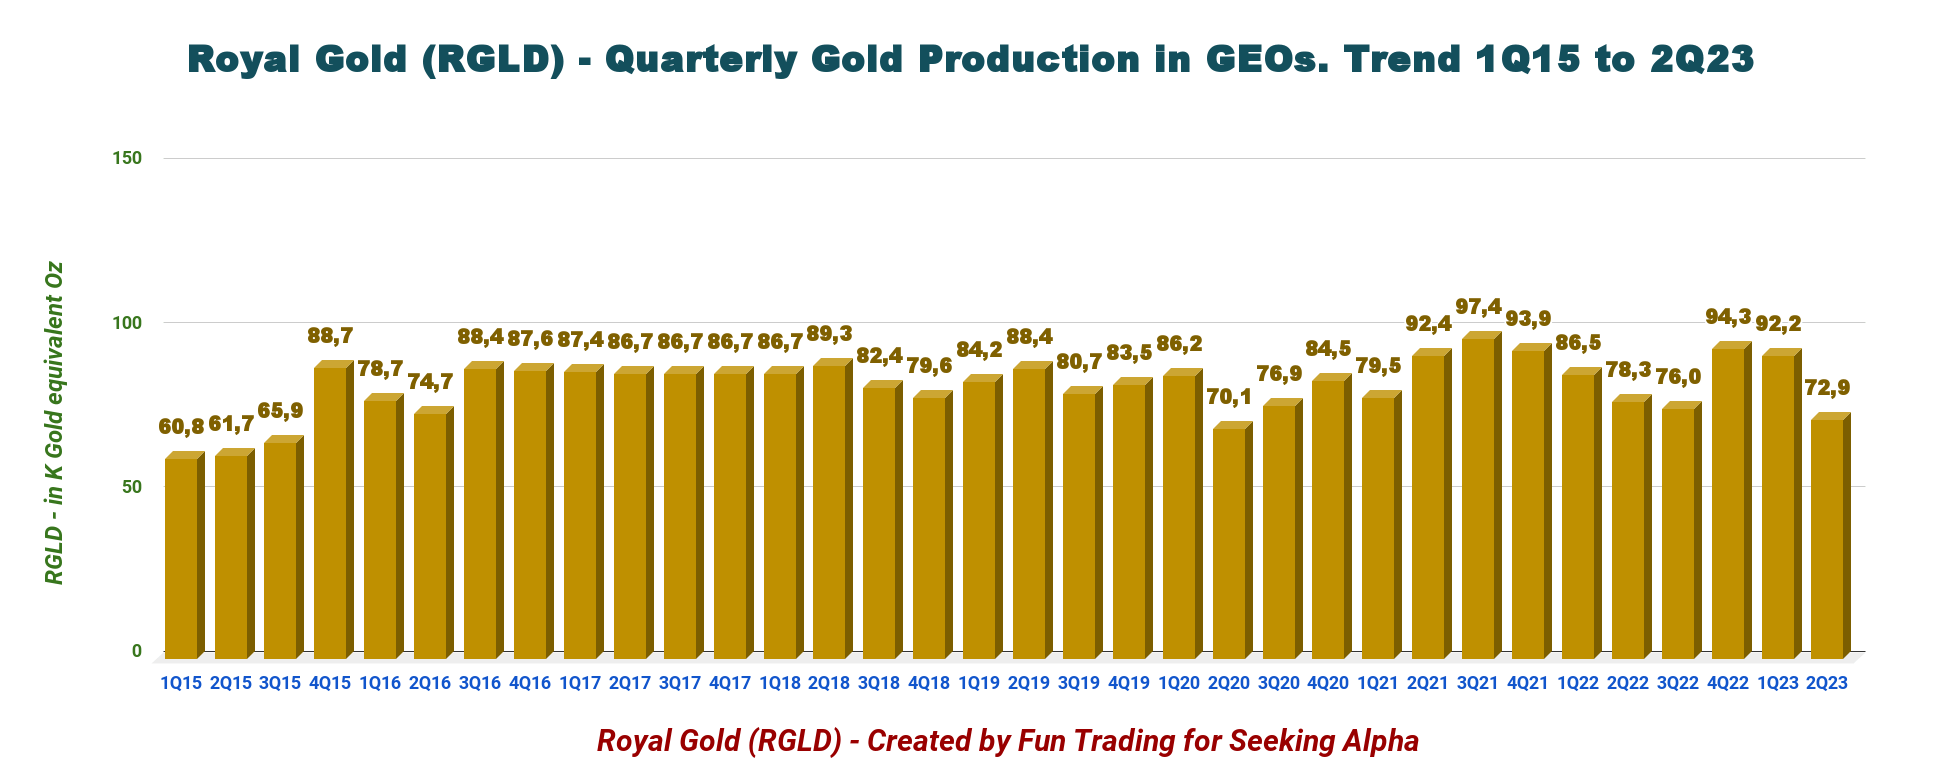
4 - Production In Gold Equivalent Ounce And Details
RGLD Quarterly GEO Production History (Fun Trading)
Royal Gold reported a quarterly production volume of 72.9K GEOs (Gold Equivalent Troy Ounces) compared to 78.3K GEOs in the same quarter last year.
Gold, Silver, and copper commodity prices dropped significantly in the second quarter.
This quarter's average prices:
- $1,890 per ounce for Gold.
- $22.55 per ounce for Silver.
- $4.05 per pound for Copper.
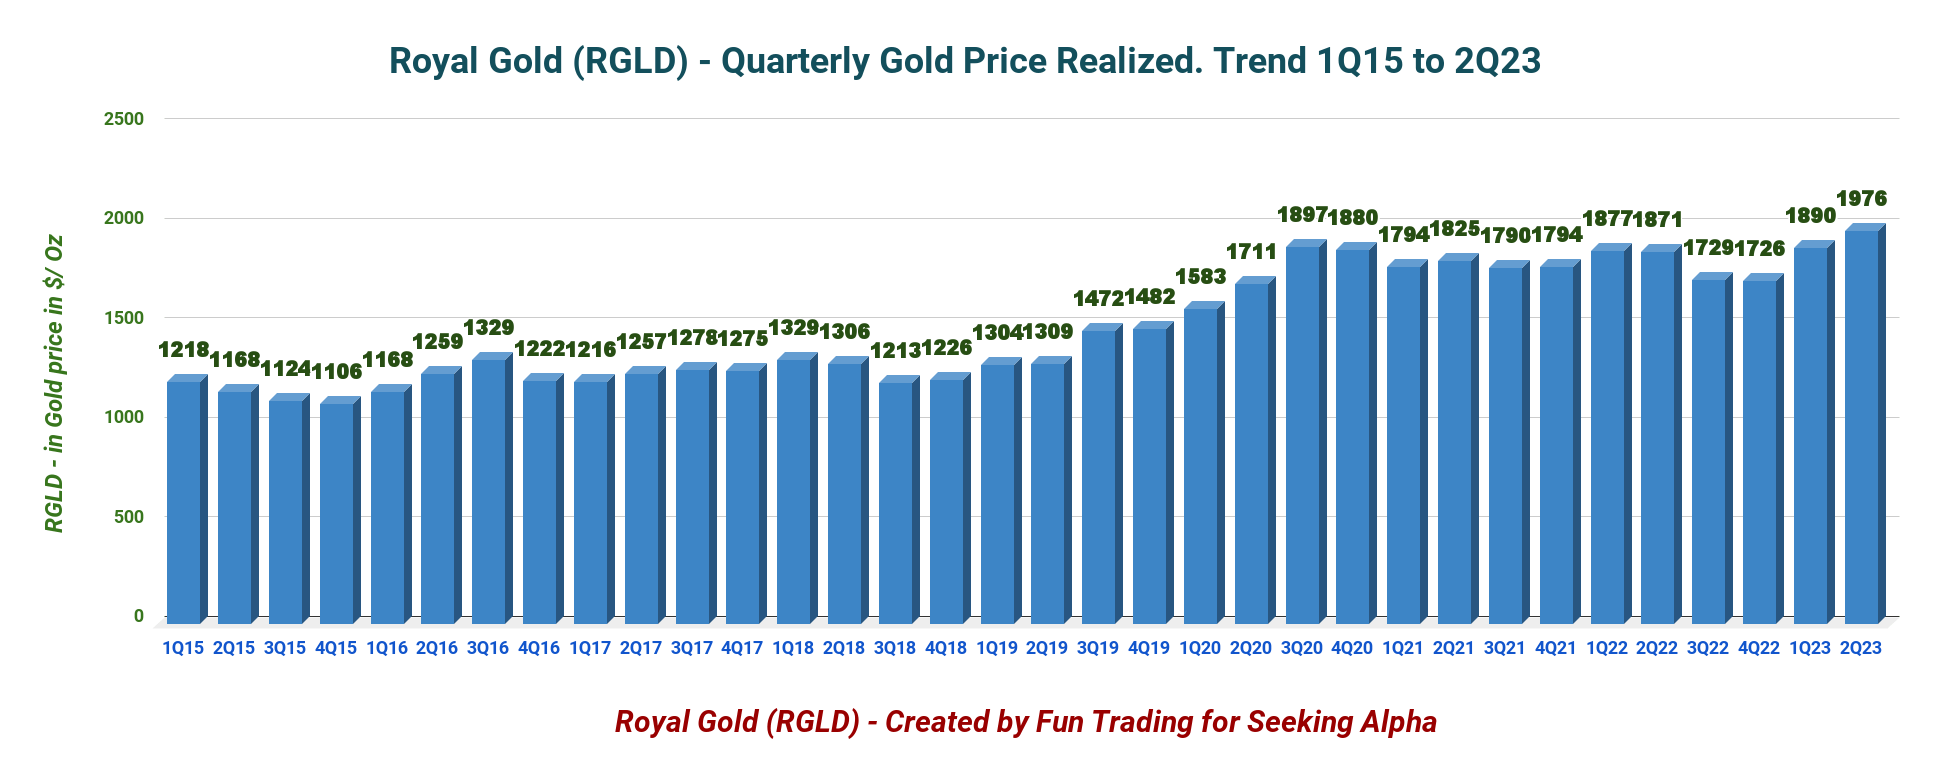
RGLD Quarterly Gold Price History (Fun Trading)
Note: Royal Gold expects stream segment sales of 54K-59K GEOs for the first quarter of 2023. Complete 2023 guidance will be available in the second quarter of 2023.
Technical Analysis (Short-Term) And Commentary
RGLD TA Chart short-term (Fun Trading StockCharts)
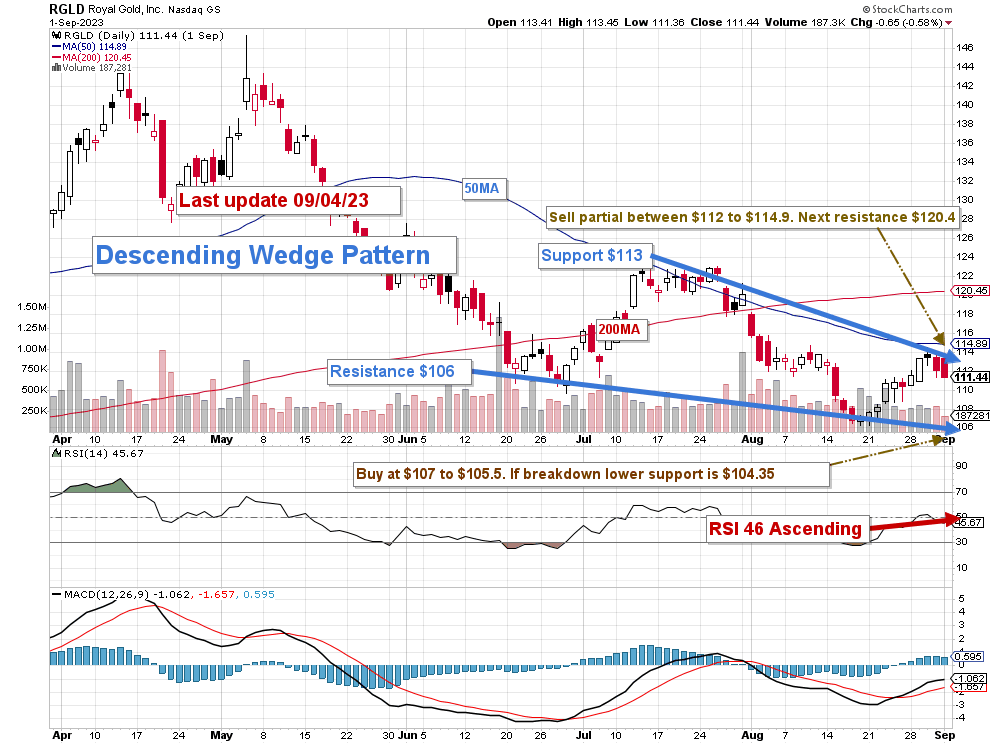
Note: The chart is adjusted for the dividend.
RGLD forms a descending wedge pattern with resistance at $113 and support at $106.
The falling wedge is a bullish price pattern that represents a story about the market in which bulls are preparing for another push.
The short-term trading strategy remains the same as in my preceding article. I suggest trading LIFO for about 40%-50% of your position.
I recommend selling between $112 and $114.9 with potential higher resistance at $120.4 and waiting for a retracement to buy back RGLD between $107 and $105.5 with possible lower support at $104.35.
Trading LIFO allows you to sell your most recent purchases, assuming a profit while keeping your long-term position, often underwater, until the stock has appreciated enough to consider selling your core position with a maximized gain. It is about taking small profits using the chart pattern and Fundamentals by repeating the process regularly. The goal is to de-risk your long position.
Watch Gold like a hawk.
Warning: The TA chart must be updated frequently to be relevant. It is what I am doing in my stock tracker. The chart above has a possible validity of about a week. Remember, the TA chart is a tool only to help you adopt the right strategy. It is not a way to foresee the future. No one and nothing can.
For further details see:
Royal Gold: A Streamer For The Long Term