RQI - RQI: Go Overweight
2023-11-30 21:32:30 ET
Summary
- The Cohen & Steers Quality Income Realty Fund is an actively managed, leveraged, closed-end fund with high Beta.
- The fund combines REITs and corporate debt securities, making it an aggressive rate play.
- I estimate a 20% total return potential for the fund by the end of 2024.
Summary
The Cohen & Steers Quality Income Realty Fund ( RQI ) has a toxic combination of assets when rates jump and outsized returns when rates fall. This is not an investment for those averse to volatility. With inflation continuing to trend down and an apparent end to the rate hike cycle that may convert to an easing scenario, this fund can be a good option.
Fund Description
This investment is not just a REIT fund or a corporate debt fund, but rather a combination of both with leverage added to augment distribution yields. The REIT portion of the investment offers a dividend yield of 4%, while the corporate debt side has a yield of about 8%. The fund has US$57 million in rate swap derivatives and US$710 million in debt with a cost of 2.6% and a maturity of 2.8 years. The use of leverage is what allows for higher distribution rates.
Over the last two years, as interest rates increased, the value of bonds and bond proxies such as REITs decreased. At the same time, the fund's leverage increased the risk of rising costs and lowered returns. As a result, the market sold off the underlying assets and the fund's value dropped by 37% since Jan 2022.
Performance
Since its inception, RQI has shown a consistently strong performance when compared to pure REITs and pure corporate bond funds (adjusted for dividends). It has managed to keep up with SP500 (SPX) up until a year ago. However, when looking at its performance over a two-year period, it is in line with REITs and Bonds, having dropped about 20% when adjusted for dividends.
RQI performance vs benchmarks (Created by author with data from Capital IQ)
Capital Return
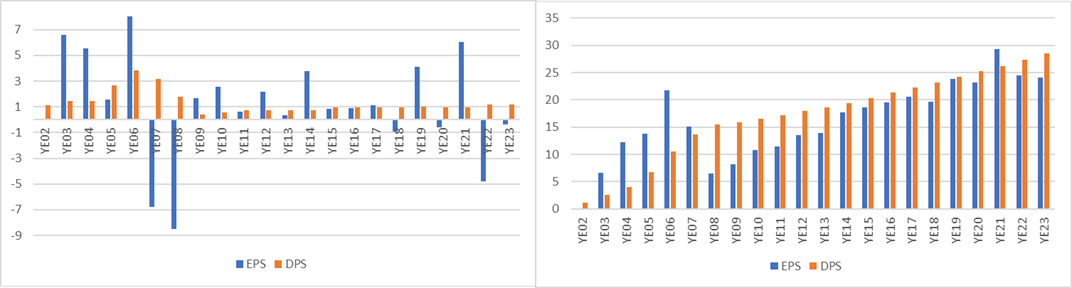
Despite the turmoil in asset prices, RQIs investments continued to pay out dividends and make interest payments but not enough to meet management distribution policy, and a portion was return of capital. In the two charts, one can see EPS vs DPS per year and accumulated since inception. When the accumulated DPS is greater than EPS it generally means the fund distributed more than it had earned from dividends, interest, and capital gains. This return of capital is under 1% per year.
RQI EPS and DPS (Created by author with data from Capital IQ)
Portfolio Overview
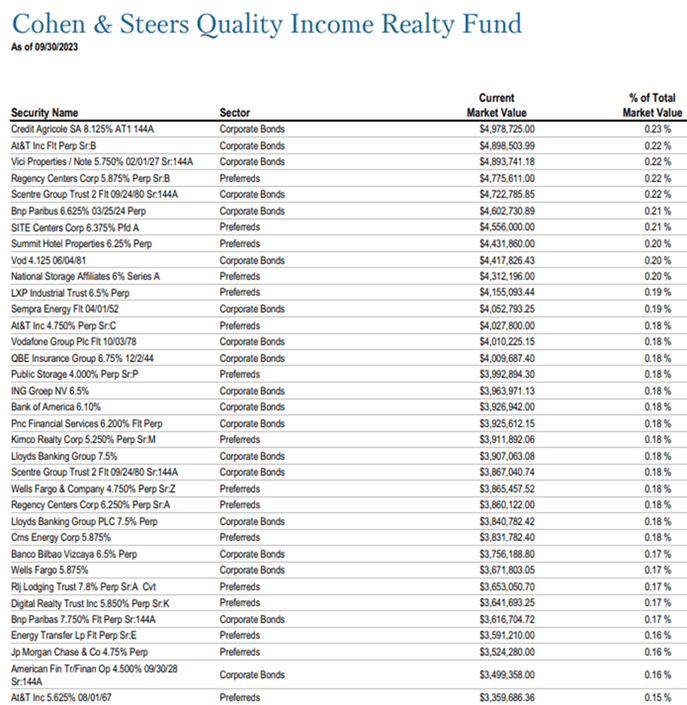
As an actively managed fund, the portfolio is subject to change. Currently, the assets under management [AUM] are divided between 32 real estate investment trusts (REITs) and a few hundred corporate debt instruments, which have varying yields and maturities but are mostly issued from investment-grade companies. I have listed the REITs along with their consensus price targets and dividend yield for year-end 2024, which indicates a potential upside of 11%. Additionally, I have included part of the corporate debt securities that the fund holds to provide investors with an idea of the diversification and yields. In many ways, this aspect of the fund is similar to a corporate bond fund.
RQI Consensus Data for REIT Portfolio (Created by author with data from Capital IQ)
RQI Corp Debt Sample (Image from Cohen & Steers)
The Leverage Structure
Leverage is a key to increased performance potential. The fund borrowed capital that is invested in REITs and Corp debt. As per the latest Factsheet , the debt of the fund was equal to 32% of the managed assets, or US$710 million. Out of this, 81% is at a fixed rate of 1.8% annually, and the remaining is at a floating rate of 6.2%. For a cost of 2.6% or US$18m per year or 1.1% of AUM.
In the last financial statement of the fund (Dec 2022), it stated that there is one revolving credit line for US$710 million with a rate of 5.2% plus an unspecified Benchmark floating rate. To reduce this debt cost for the next 2.8 years, the fund is using derivatives, interest rate swaps. However, this comes at a cost, with US$57 million allocated to the swaps, which could have been used to invest in REITs or corporate debt.
RQI Leverage Structure (Created by author with data from Cohen & Steers)
Total Return Potential
About 29% of NAV is invested in corporate debt instruments (Bonds and Preferred) that should perform in line with a corporate bond fund such as iShares iBoxx $ Investment Grade Corporate Bond ETF ( LQD ) which is down 20% since the Fed began its rate hike cycle. I doubt the Fed cuts rates back to zero so the full retracement may be unlikely, but perhaps back to US$112 is feasible with Fed Funds at 3%. This would provide about a 5% capital gain. The REIT portfolio has more upside according to consensus and could gain 10.5%. Thus, price or capital upside is about 13% plus the distribution or dividend payout of 7% provides a total return of 20%. This can be augmented if an investor purchases more shares with the monthly payout.
RQI Total Return Estimate (Created by author with data from Capital IQ)
Conclusion
I rate RQI a Buy. The combination of fixed income, REITs, and leverage makes this an ideal fund at this juncture in the rate cycle for aggressive investors. I calculate 20% total return as rate-sensitive assets reprice in an eventual decline in risk-free rates.
For further details see:
RQI: Go Overweight