VNQ - RQI: Quality REIT Exposure With An 8.6%+ Distribution Yield
2023-09-19 03:59:31 ET
Summary
- Real estate investment trusts (REITs) are facing pressure due to rising interest rates causing higher financing costs and risk-free yields rising, making them less appealing.
- The Cohen & Steers Quality Income Realty Fund offers access to a pool of beaten-down and attractively priced REIT and real estate investments.
- RQI is at a solid discount and offers a safe distribution; lower rates in the future are the potential catalyst to turn headwinds into tailwinds.
Written by Nick Ackerman, co-produced by Stanford Chemist.
Real estate investment trusts ("REITs") are continuing to face pressure in this current interest rate environment. Yields had risen substantially through August, and that put further pressure on this sector of the market. As yields grow on risk-free investments, income-oriented REITs become less attractive. Additionally, rising rates mean higher costs when it comes to financing new growth.
That being said, REITs are also now attractively priced and have been beaten down plenty for these reasons already. One fund to gain access to a pool of REIT and real estate investments would be the Cohen & Steers Quality Income Realty Fund ( RQI ). In my opinion, Cohen & Steers is the top-tier REIT manager in the closed-end fund space. This fund currently sports a solid discount, which means you are getting a pool of REITs at a bit cheaper even.
The Basics
- 1-Year Z-score: -0.95
- Discount: -7.08%
- Distribution Yield: 8.61%
- Expense Ratio: 1.39%
- Leverage: 29.24%
- Managed Assets: $2.43 billion
- Structure: Perpetual
RQI's investment objective is to provide a "high current income." They also have a secondary investment objective of "capital appreciation." They will invest in "real estate securities including common stocks, preferred stocks and other equity securities of any market capitalization issued by real estate companies, including real estate investment trusts (REITs) and similar REIT-like entities."
The fund's total expense ratio comes to 3.79%. We've seen this rise substantially due to the leverage expenses rising on their underlying debt. Last fiscal year, the total expense ratio was at 2.33%. However, while the expense ratio is rising due to increased borrowing costs, they have also been experiencing gains in their interest rate swaps to offset this negative.
Cohen & Steers is one of the management groups that hedged the majority of their leverage through interest rate swaps. This locked in the majority of their borrowings at a rate of 1.7%, while the variable rate comes in at 6%. That 6% is what other peers would have to eat across their entire pool of borrowings if they didn't hedge.
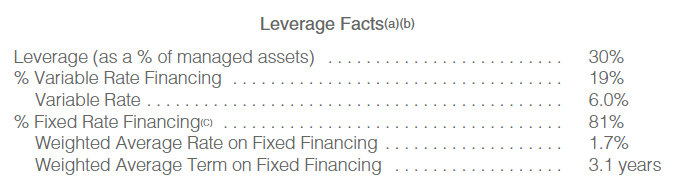
This hedging will fall off over the next few years, but that might be just enough time. The Fed is expecting that they'll have to cut rates in 2024 and 2025, which would be perfect timing for RQI management to lock in lower rates once again. Of course, this is only an estimate, and things could change quickly in either direction depending on how the economy moves going forward.
FOMC Rate Projections (FOMC)
Performance - Attractive Discount
In the CEF space, RQI is a rather large fund coming in at total managed assets of over $2.4 billion. However, this does come from the significant leverage that we discussed above. The fund utilizes this leverage in an attempt to generate further gains for its shareholders. The downside in this case, of course, is that it can also go against shareholders during tough times for REITs, such as we are in now.
That being said, if we look at the period from the beginning of 2022 to today, RQI's leverage seemed to have no negative impact further than investing in the straightforward Vanguard Real Estate ETF ( VNQ ).
In fact, if we wanted to get picky, we can see that on a total NAV return basis, RQI has slightly beaten out VNQ during this period. It was on a total share price return that the fund lagged behind VNQ, and that's as the fund was trading near parity with its NAV, and now a discount has opened up.
Ycharts
Over the longer term, RQI has crushed VNQ as well. That was at a time when interest rates were near 0%, so I'd have to assume that certainly helped. Despite higher interest rates now, as we touched on above, the Fed actually expects to cut rates next year and the following from the current levels. Anything can certainly happen, but that bodes well for RQI.
Ycharts
Then again, it should be noted that RQI isn't solely focused on equity REITs. They also incorporate some preferred and fixed-income exposure that makes it a bit more of a hybrid approach.
The fund's discount has narrowed from the discount lows we saw earlier this year. However, we believe that any discount wider than 5% represents a buying opportunity. This represents a discount close to its five-year average.
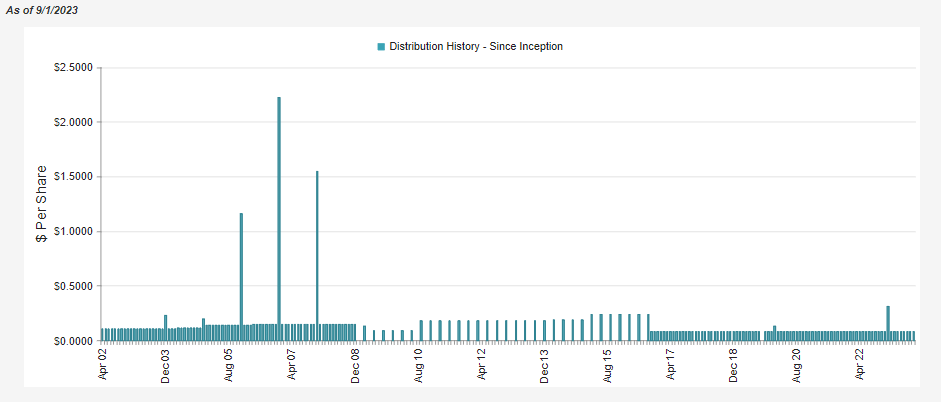
Distribution - Looking Safe
Given the current environment of incredibly poor performance in 2022 and pressures in 2023, though not nearly as bad, I think a main question would be if the fund's distribution is safe. Well, given what we know for now, I believe that it is safe even in this pressure where REITs are facing pressure. The NAV distribution rate comes to 8%, and I don't believe that is at an unreasonable level. So I suspect that the current $0.08 monthly distribution that they've paid for years now isn't going anywhere.
That isn't to say that if we get into a deep recession or another black swan event occurs, they won't cut; in that case, anything could happen.
Going back to the leverage discussion increasing the expenses of the fund, we see that play out with the fund's net investment income ("NII"). If we annualized the per-share figure, it would come to $0.20 compared to last year's $0.30.
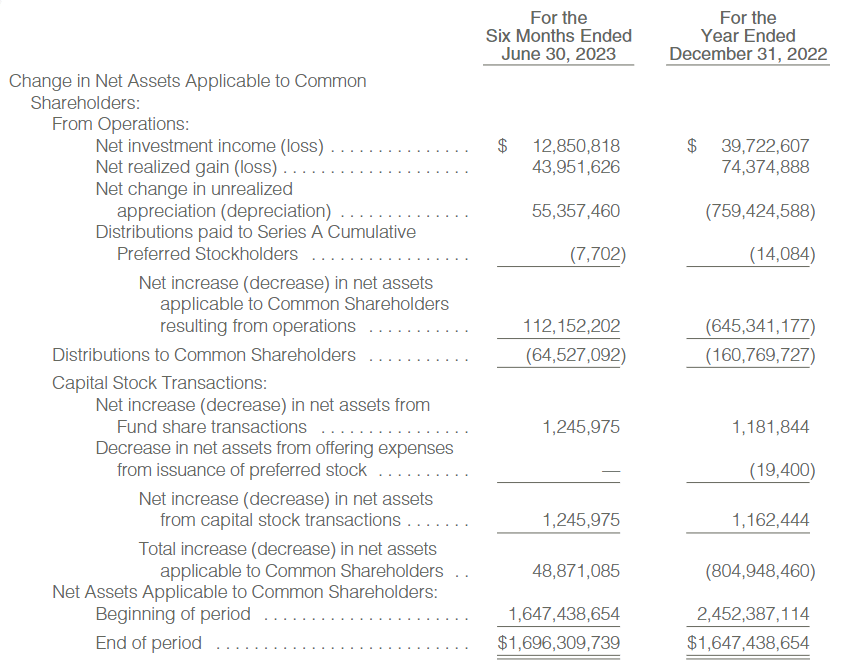
Changes can occur all the time with active management buying and selling the underlying portfolio. However, another significant impact is expenses increasing. As expenses rise, that is subtracted from the total investment income ("TII") of the fund.
NII, for those who may be newer to investing, is simply the TII minus expenses. To get TII, it is the sum of all the dividends and interest payments from RQI's underlying portfolio.
In this latest report for the last six months, they had a TII of $44.541 million. From the same period a year ago , the fund's TII was actually only $35.193 million. So TII increased 26.56%, but NII decreased 14.45%.
Total expenses last year for the first six months of the year came to $20.172 million, and those ballooned to $31.69 million in the same period this year. The primary driver was the interest expenses, increasing to $20.082 from $12.044 million.
That's certainly substantial, but that increase was actually entirely offset by a capital gain resulting from the fund's interest rate swap contracts. Which is where these offsets come from. The expenses still increase, and that will show a NII decrease; however, it is coming from capital gains from the interest rate swaps that offset that as its hedge.
This means that NII can decrease, but they can still be left in a position where coverage of the fund's distribution doesn't actually get negatively impacted. The bucket of where coverage comes from just shifts.
RQI Realized/Unrealized Gains/Losses (Cohen & Steers (highlights from author))
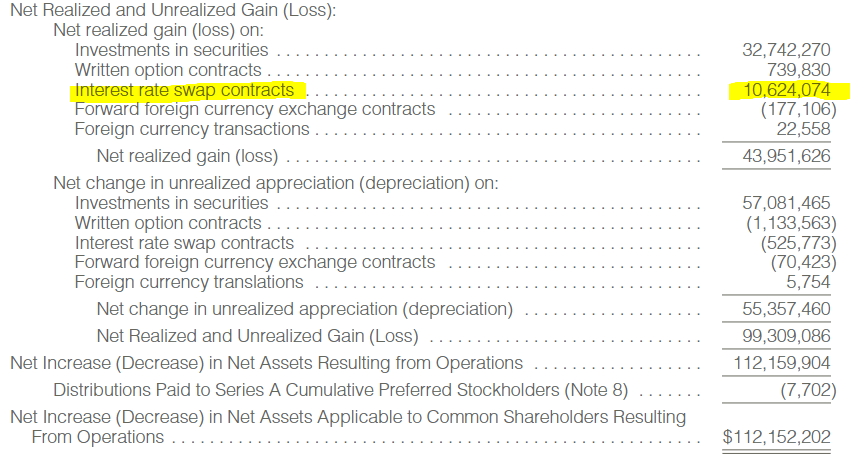
The fund has also successfully produced gains from writing options as well. They aren't necessarily the most meaningful gains in this period, but they are there. Unfortunately, these gains were more than offset by the unrealized losses from options writing for this period.
For taxes, we discussed those earlier this year :
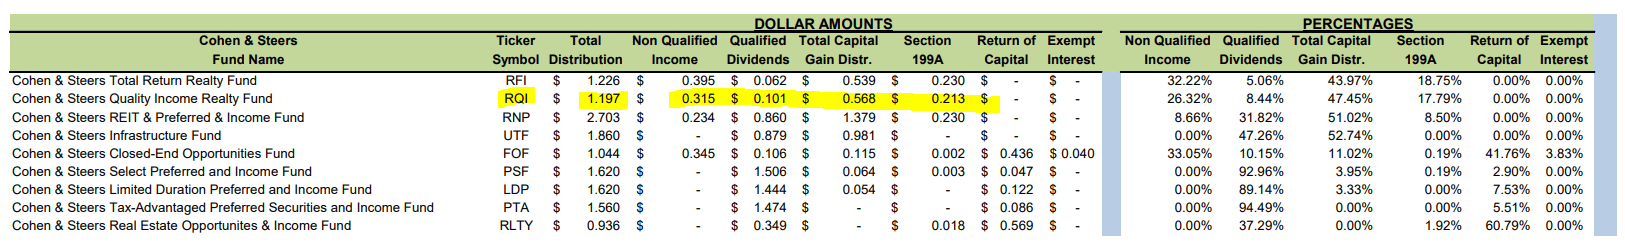
For the tax classification for 2022 , RQI's distribution was mostly capital gains. That can be beneficial as it is generally tax-friendlier than ordinary income. Although, non-qualified income for RQI remained substantial, as is often the case with REITs.
RQI Distribution Tax Classifications (Cohen & Steers (highlights from author))
RQI's Portfolio
In the first half of the year, the management has been pretty quiet in terms of making moves; the turnover of the portfolio only comes to 9%. That puts it on trend to have the lowest turnover in the last five years if it continues.
An additional worthwhile note for this fund is that it carries 79% to equity REITS, and the other 21% is preferred and fixed income exposure. That's consistent with what we usually see for this fund. However, they actually place much larger bets on their equity holdings relative to their fixed-income sleeve.
They list a total of 227 holdings as of the end of June 30, 2023. The equity names easily counted in their last semi-annual report at 31 of these positions, meaning all the rest of the 196 holdings are divided amongst the preferred and bonds.
This translates out into a high concentration of top holdings, with the top ten actually making up just over 50% of the entire portfolio. The last update also came in with a nearly identical 50.4% weight. That certainly hadn't hurt their performance, though, when comparing it to VNQ, as we saw above in the higher interest rate environment.
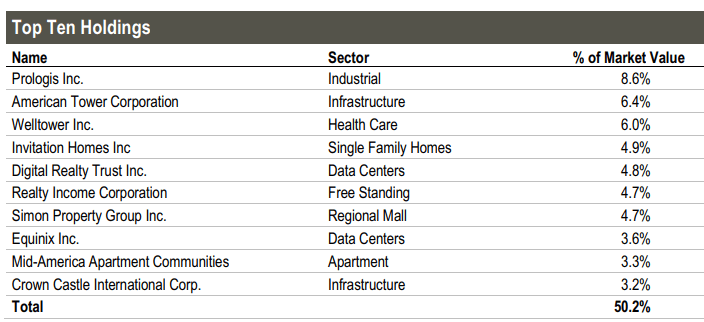
Higher concentration can result in an easier chance to outperform peers, but it also means a higher chance to underperform as well. It comes down to each individual position being more impactful, for better or worse.
In looking at the latest top ten, it isn't overly different from what we saw in our previous update. The only change we see here is that Crown Castle Inc. ( CCI ) is now in the top ten, which pushed Public Storage ( PSA ) lower. However, PSA remains a position in the fund.
As we would expect, with the largest holdings remaining largely unchanged and the fund reporting low turnover, the sector allocations have remained fairly static too.
RQI Sector Allocation (Cohen & Steers)
Conclusion
RQI is a solid REIT-focused fund that invests heavily in equity REITs but also sports some fixed-income exposure. The fund is leveraged. However, the fund wasn't adversely impacted when we compare it to VNQ during the rising interest rate environment starting at the beginning of 2022. That was even as its borrowing costs had increased substantially; this would be thanks to the fund's hedging through interest rate swaps that they implemented. That meant that the rising borrowing costs were more than offset by gains in these contracts.
That also means that despite NII slipping with this latest report, the distribution coverage hasn't really changed. Only the bucket from which it is being covered has shifted. Of course, this still means that the distribution will require significant capital gains moving forward. Any sort of black swan event or deep recession could cause some stresses where we could see a cut, but for now, it seems quite safe.
The fund is also trading at an attractive discount, making it a fine time to consider this fund for a long-term investor to gain some real estate exposure. The biggest headwinds for this fund stem from rising interest rates. The latest estimate is the expected lower rates in the next couple of years; those headwinds could turn to tailwinds.
For further details see:
RQI: Quality REIT Exposure With An 8.6%+ Distribution Yield