KMLM - RSBT: Why I Own This Potentially Life-Changing 12.4%-Yielding ETF
2023-03-17 07:45:00 ET
Summary
- Diversification can help boost yield, long-term returns, maximize income growth, and reduce volatility in even the most extreme market crashes.
- Bonds and managed futures are the best hedging strategy in history, never failing since 1980.
- Return Stacked Bonds & Managed Futures ETF is a new exchange-traded fund that combines 50% bonds, 50% cash, and 100% trend-following managed futures into an ETF with historical strategy returns (and yield) of 12.4%.
- That's 3X better than bonds, and 2X better than its industry. In 2022, it would have been up 22%, and the strategy averaged 33% gains during historical bear markets (mirror image of the S&P), better than DBMF or KMLM.
- For anyone comfortable with its risk profile and return stacking strategy, I recommend considering a modest (1% or less) trial allocation until the ETF proves itself long-term. RSBT replacing all other hedging assets in our ZEUS Income Growth Portfolio would have reduced 2022's peak decline from 9% to 5% and resulted in average peak declines of 8% in the last five recessions, compared to 33% for the S&P 500, while delivering 6% yield and over 14% historical returns.
The video version of this article was published on Dividend Kings on March 1st, 2023. I've updated it with data up to date on March 14th.
----------------------------------------------------------------------------------------
I'm constantly researching and looking for ways to improve my family's $2 million hedge fund, which is the Dividend Kings ZEUS Income Growth Portfolio.
The goal is to find the best blue-chip assets, including stocks, exchange-traded funds ("ETFs"), and hedging ETFs, that can help my family achieve our financial and philanthropic dreams.
I recently found a brand new ETF, which while still speculative, is worthy of a 1% allocation to my family fund. This is a potentially life-changing hedging ETF that long-term is expected to generate 12.4% returns and pay those out as annual dividends.
Let me share why the Return Stacked Bonds & Managed Futures ETF ( RSBT ) is one of the most intriguing ETFs you've never heard of but might want to consider adding to your diversified and prudently risk-managed portfolio.
A Potentially Game-Changing ETF I'm Adding To My Portfolio
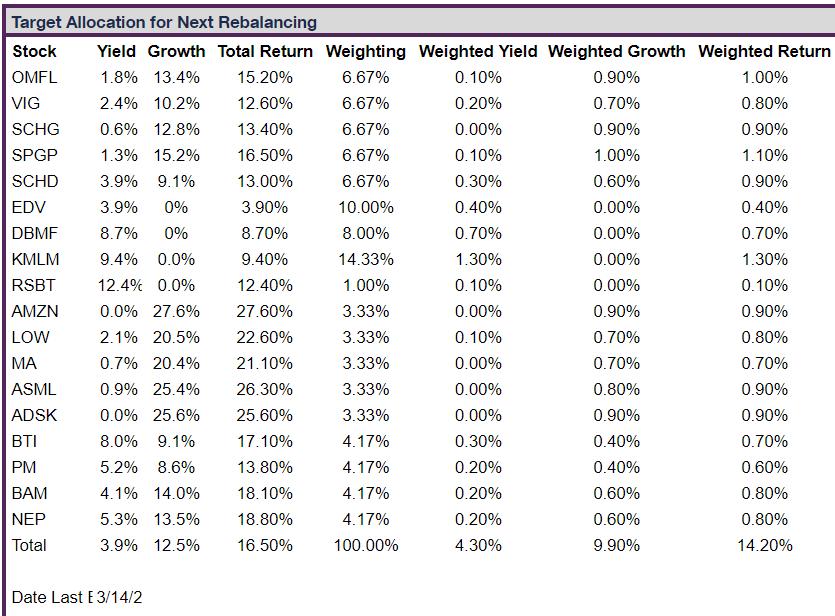
In our ZEUS Income Growth Portfolio Tracker, you can see my family hedge fund's target allocation.
DK ZEUS Income Growth Portfolio: My Family Hedge Fund's Target Allocation
I would own this portfolio if I were starting over and had to invest a large amount of money right now.
- Literally, if I won the lottery, I'd invest hundreds of millions of dollars into this portfolio immediately.
The newest addition is a 1% allocation to the Return Stacked Bonds & Managed Futures ETF, which I spent dozens of hours researching for DK members.
Why is this a potential game-changer hedging ETF?
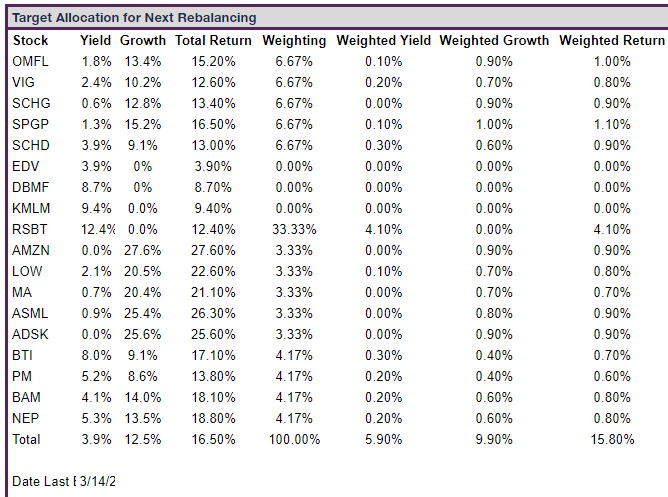
Because if it performs as expected, the portfolio might eventually look like this.
POTENTIAL Future ZEUS Income Growth Portfolio
I'm always looking for ways to improve ZIG since my family's future charity empire and dreams ride on the wings of this Ultra SWAN portfolio.
ZIG began:
- Five stocks/ETFs (SCHD, EDV, ENB, BTI, and MO)
- a 4% yield
- 12% long-term return potential
- 10% to 14% long-term income growth.
And by carefully tweaking its holdings and allocations, I MIGHT be able to boost that to:
- 18 stocks/ETF
- a 5.9% yield
- 15.8% long-term returns
- 14% to 18% long-term income growth.
The key is to use the best world-beater blue-chip assets possible.
And RSBT has the POTENTIAL to be the ideal hedging ETF.
| Year |
| S&P |
| Bonds |
| CTA Trend Following |
| RSBT |
| DBMF |
| KMLM |
| 2022 |
| -18.1% |
| -13.1% |
| 27.3% |
| 21.8% |
| 21.5% |
| 30.4% |
| 2008 |
| -37.0% |
| 5.9% |
| 20.9% |
| 24.5% |
| 13.1% |
| 40.4% |
| 2002 |
| -22.1% |
| 9.9% |
| 26.1% |
| 31.9% |
| 12.9% |
| -9.2% |
| Average |
| -25.7% |
| 0.9% |
| 24.8% |
| 26.1% |
| 15.8% |
| 20.5% |
(Sources: Charlie Bilello, Ycharts, KraneShares, DBMF, Soc Gen, Yahoo Finance, NYU.)
Here are how these various hedge strategies would have performed in three of the worst years for stocks in history.
| Crisis Period |
| US Stocks |
| Bonds |
| Long Bonds |
| SG Trend Index |
| RSBT |
| DBMF |
| KMLM |
| December 2021 to September 2022 |
| -25% |
| -14.4% |
| -37.3% |
| 35.6% |
| 28.7% |
| 31.6% |
| 44.8% |
| January 2020 to March 2020 |
| -20% |
| -2.6% |
| 16.9% |
| 1.4% |
| 0.3% |
| -0.8% |
| 13.9% |
| October 2007 to February 2009 |
| -50% |
| 6.1% |
| 20.0% |
| 21.6% |
| 25.9% |
| 13.5% |
| 37.4% |
| August 2000 to December 2002 |
| -41% |
| 33.4% |
| 124.7% |
| 56.3% |
| 78.6% |
| 28.8% |
| 30.4% |
| Average |
| -34% |
| 5.6% |
| 31.1% |
| 28.7% |
| 33.4% |
| 18.3% |
| 31.6% |
(Sources: Charlie Bilello, Ycharts, KraneShares, DBMF, Soc Gen, Yahoo Finance, NYU.)
RSBT's strategy has historically delivered a mirror image of the stock market during bear markets.
- The market falls 34%, and RSBT goes up 34%
- slightly better than KMLM.
But here's why I'm excited about the POTENTIAL for RSBT to be the single best hedging solution for Ultra SWAN portfolios.
12.4% POTENTIAL Long-Term Returns Net Of Fees = 3X Better Than Bonds
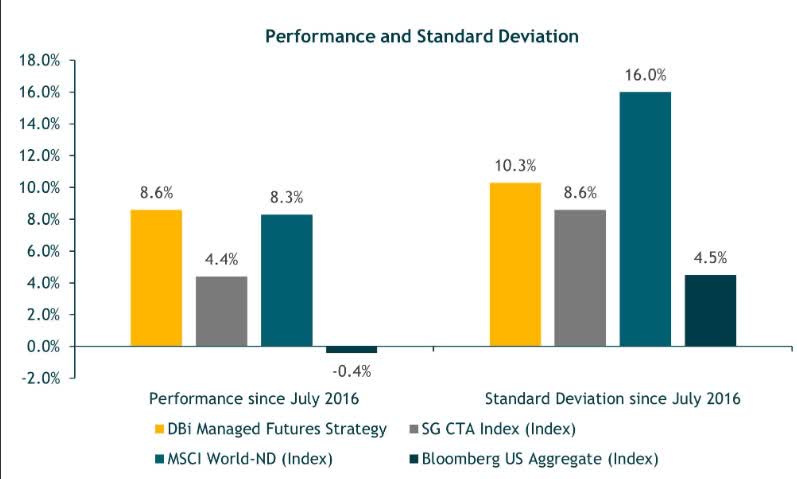
DBMF is the "vanguard of hedge funds" and tracks the Soc Gen CTA (managed futures) index.
- the 20 largest managed futures funds in the world.
RSBT tracks the Soc Gen CTA Trend Following index, which historically delivers about 1.3% better long-term returns.
Note that these are post-fee returns.
All these managed futures ETFs have about 1% expense ratios compared to 5% for the industry, which is why they are designed to deliver about 4% better returns than you see in the chart.
- 8.7% for DBMF ( DBMF )
- 9.4% for KMLM ( KMLM ) (MLM index returns since 1988)
- 12.4% potentially for RSBT
- 4.0% for long-bonds
- 4% for U.S. bonds.
Over the long term, the yield for managed futures ETFs equals their returns.
- DBMF, KMLM, and RSBT pay out gains as an annual dividend
- I confirmed this with management
- like bonds, yield = long-term returns for these hedging assets.
What if you could boost yield, improve returns, and reduce volatility using the most successful hedging strategy of the last 43 years?
- since 1980 bonds + managed futures have never failed to be flat or go up during bear markets
- 97% probability they will always work in the future.
How is this possible? How can RSBT be a much better hedging option than bonds, DBMF, and KMLM? That's where the power of return stacking comes in.
Return Stacking- A Smarter And Safer Way To Harness Leverage
We find that stocks with the characteristics favored by Buffett have done well in general, that Buffett applies about 1.6-to-1 leverage financed partly using insurance float with a low financing rate , and that leveraging safe stocks can largely explain Buffett's performance." - AQR Buffett's Alpha (emphasis added).
Warren Buffett is the greatest long-term term investor in history, achieving 20% annual returns for 56 years, and he's not even that good of a stock picker.
In 58 years of Berkshire management, most of my capital-allocation decisions have been no better than so-so . In some cases, also, bad moves by me have been rescued by very large doses of luck . (Remember our escapes from near-disasters at USAir and Salomon? I certainly do." - Warren Buffett 2022 annual letter (emphasis added).
Buffett's long-term unlevered returns are 12.8% annually.
Over the 50 years, dividend growth blue-chips have beaten Buffett's unlevered returns.
Or, to put it another way, Buffett became a legend because of 3 things and three things alone:
- he bought world-beater dividend blue-chips at reasonable to attractive prices
- he held for decades
- he used 1.6X leverage SAFELY AND RESPONSIBLY
- Buffett is a master hedge fund manager - and by his own admission not a master stock picker.
Without leverage, Buffett wouldn't be a billionaire, or the Greatest Of All Time, or GOAT. Only investing nerds like me would even know who he is today.
- like Anne Schieber
- or Ronald Read.
Buffett's genius wasn't in stock picking but in creating an insurance empire that allowed him to create negative cost non-recourse (safer) leverage.
- and applying it to the best-performing kinds of stocks in history.
And guess who else has been safely using smart leverage for decades? Hedge funds and asset management giants like PIMCO.
Historical Returns Since 2007
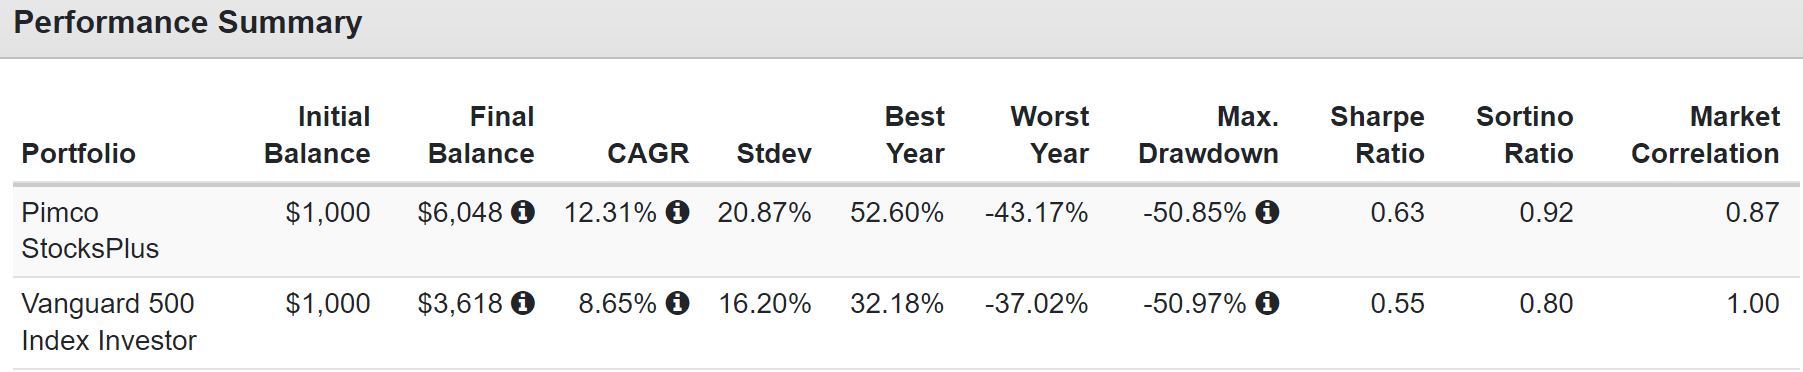
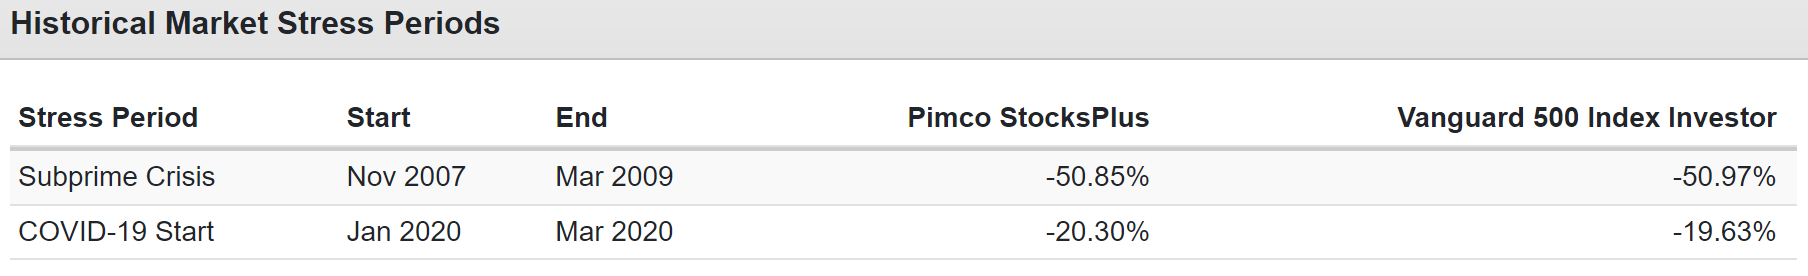
How has PIMCO's StocksPlus strategy beaten the market by 50% over the last 18 years? By doing what Buffett and other hedge fund managers have done for decades, return stacking with safe and responsible leverage.
PIMCO's strategy is to take the S&P 500 and leverage it 100% with bonds.
- no worse declines in even the most extreme bear markets
How RSBT Can Help A 60/40 Beat The Market And With Lower Volatility
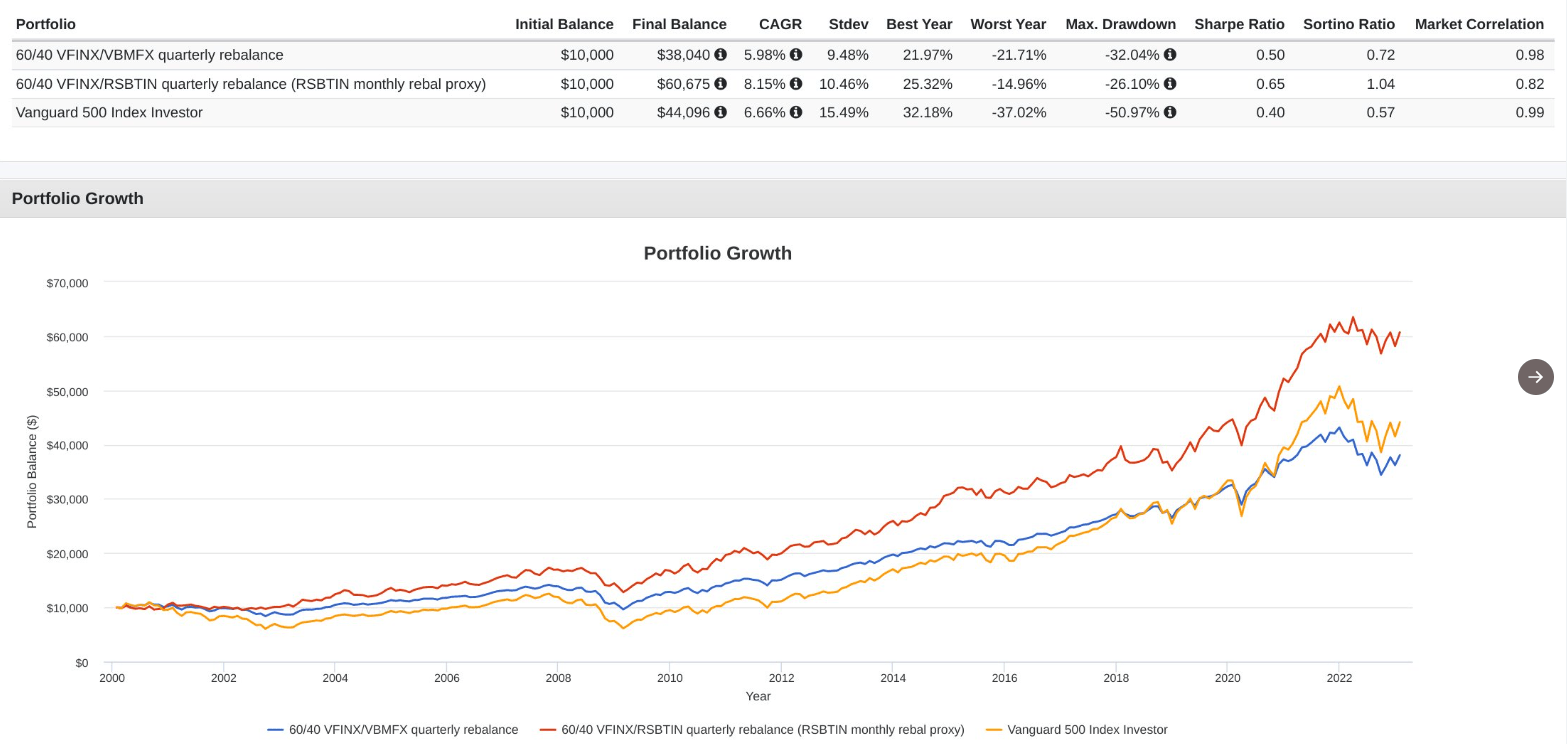
And return stacking using bonds and managed futures is even better.
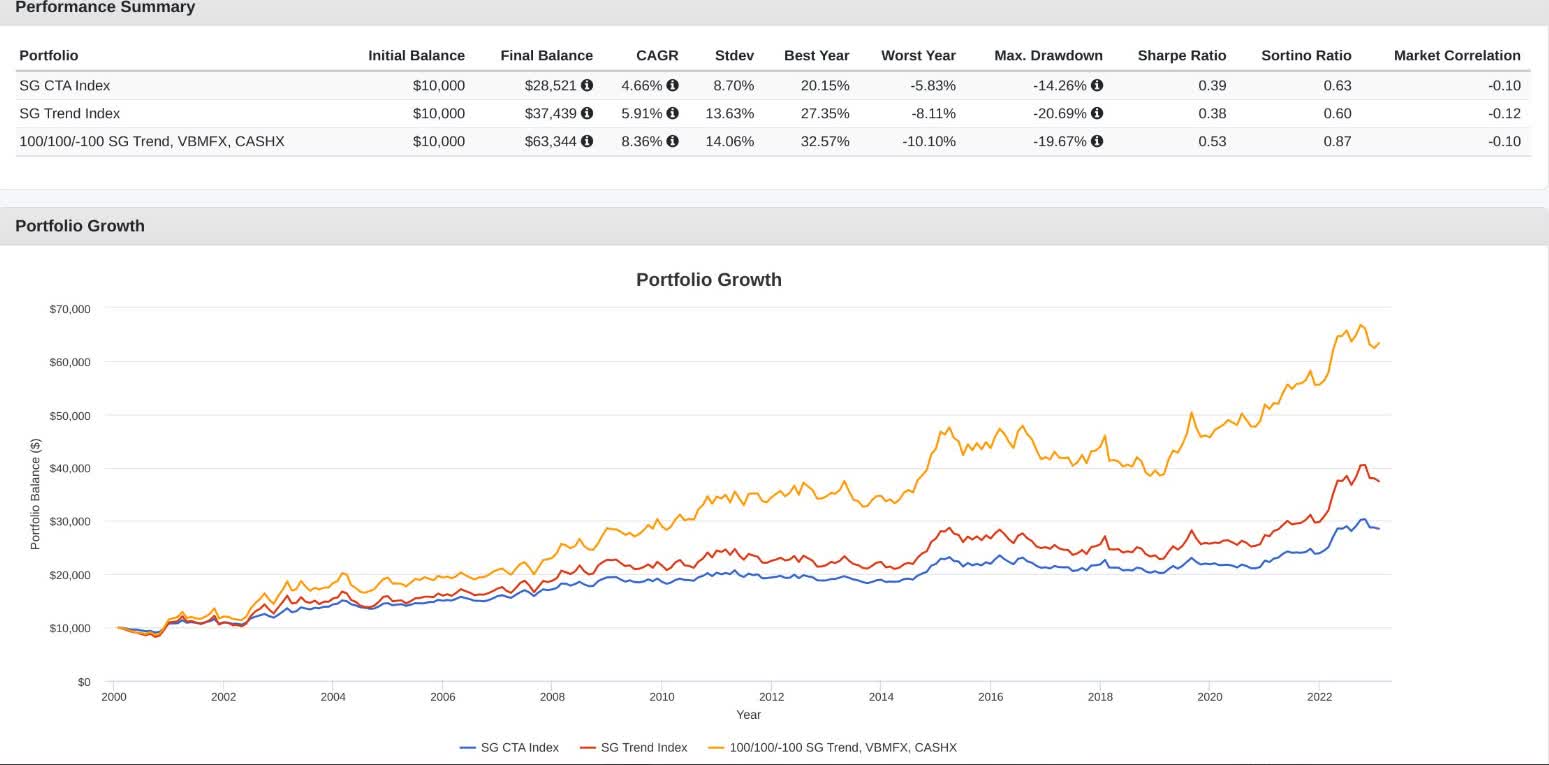
Adding RSBT (had it existed) replacing the 40% bond allocation since 2000 would have created a:
- 60% stock/20% bond/20% managed futures portfolio
- that beat the S&P by 33% annually with 33% lower volatility and 50% lower peak declines during the Great Recession
- a lower-yielding version of the DK ZEUS Strategy.
The Extraordinary Power Of True Diversification And Return Stacking
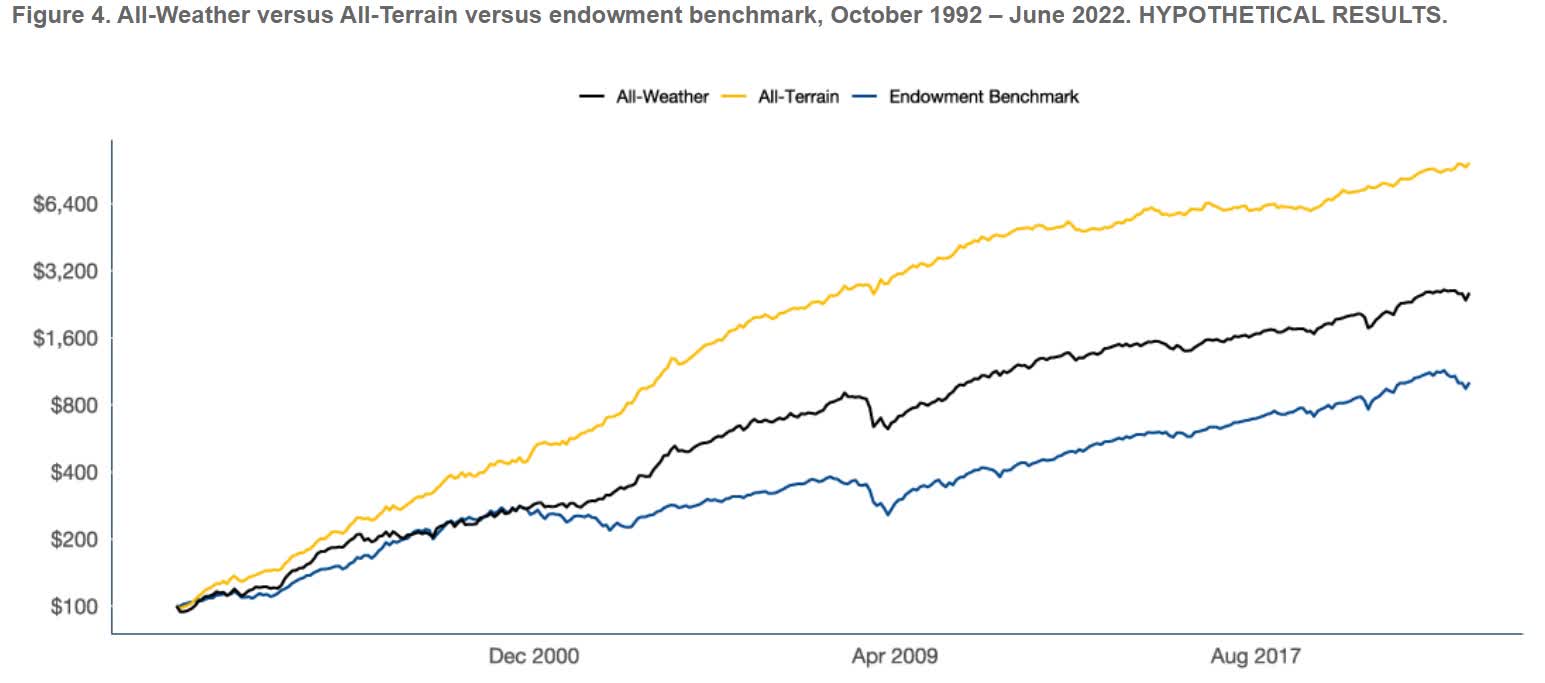
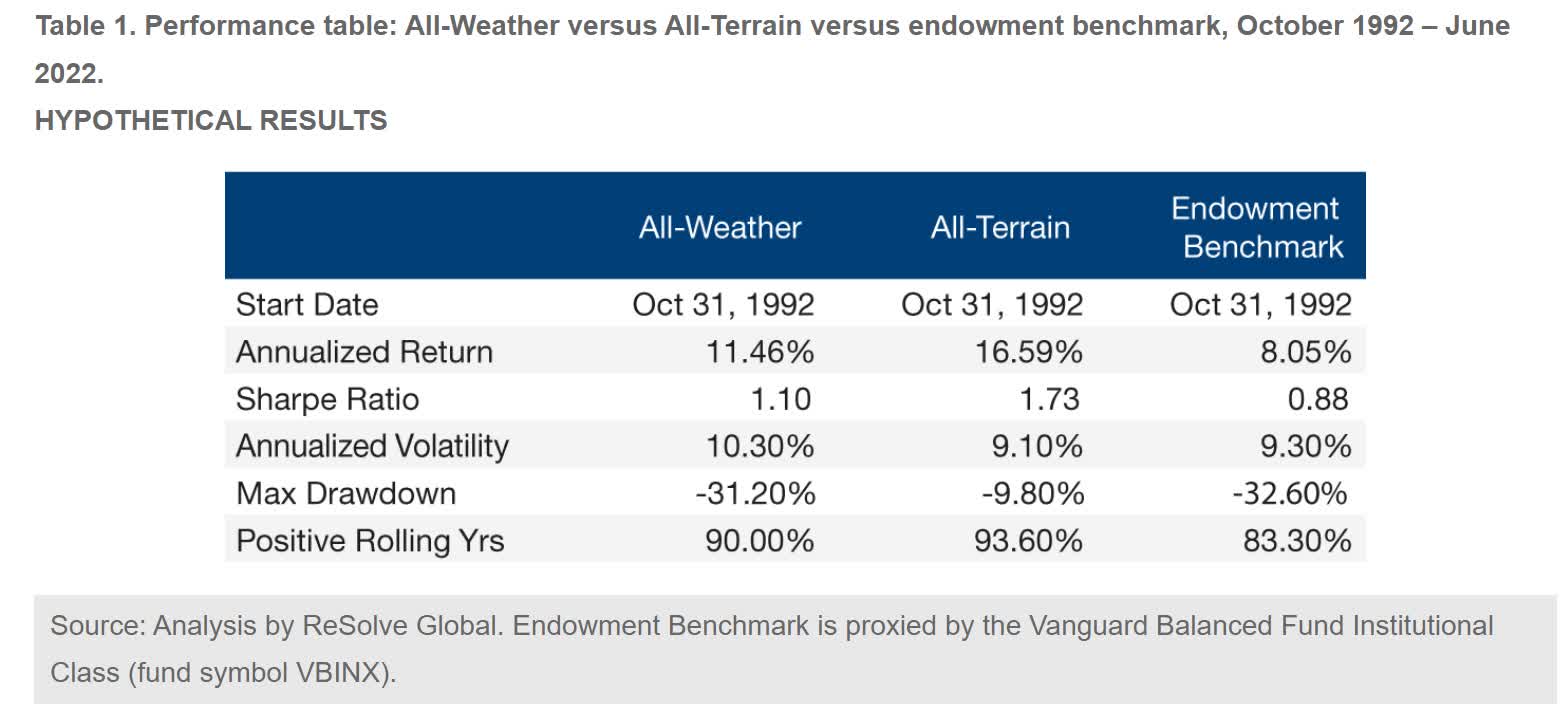
The "All Weather Portfolio" is 33% stocks, 33% bonds, and 33% commodities.
The "All Terrain Portfolio" is 33% stocks, 33% bonds, 33% commodities + 60% managed futures (60% leverage, just as Buffett uses).
The endowment portfolio is 60/40.
By using responsible leverage to buy non-correlated assets that go up and down at different times, a 60% leveraged portfolio of stocks, bonds, and managed futures delivered 2X the annual returns of a 60/40 since 1992 and with the same annual volatility.
- If used responsibly, leverage can decrease risk while boosting returns and reducing volatility.
But 2/3rd lower peak declines in the 2nd worst market crash in U.S. history.
It generated 2X the volatility-adjusted returns (Sharpe ratio) and has been one of the best investment strategies of the last 31 years.
- The average hedge fund delivered 7% annual returns (pre-5% fees) during this time.
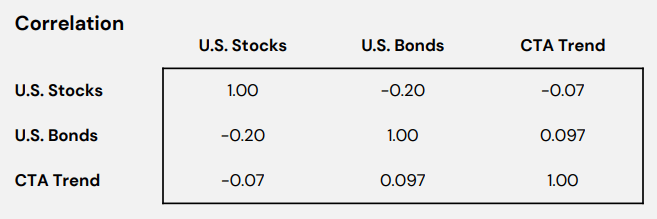
Correlations Between Stocks, Bonds, and Managed Futures Since 1999
It's said that diversification is the "only free lunch on Wall Street" and "true diversification always means having to say you're sorry."
For ten years, stocks and bonds were unstoppable. If you diversified your portfolio with anything else, you trailed a 60/40.
- for ten years, advisors had to apologize for diversifying their clients
- many lost clients as a result.
This is what return stacking is meant to solve.
It lets professional managers safely keep clients in their traditional portfolios, adding profitable diversification.
- responsible leverage means you can be 60% stocks/40% bonds and 60% managed futures, for example.
Using futures to use leverage responsibly is also more tax efficient.
- futures gains are taxed 60% long-term capital gains and 40% short-term
- bonds are 100% regular income = top marginal tax rate.
Institutions like NewFound Research and Resolve Asset Management (who run RSBT) can use futures to achieve leverage for 0.05% to 0.15%.
- The cheapest leverage for retail investors is IBKR which charges Fed Funds Rate + 0.25% to 2.5% (depending on account type and amount of margin used)
- 5% to 7.5%.
What about the risk of margin calls? Couldn't PIMCO or RSBT blow up in the future? Highly unlikely, and here's why.
Institutions like Resolve Asset Management can use portfolio margin requirements that require just 15% margin maintenance instead of 25% for regular investors.
- their portfolios would have to fall 40% to get a margin call.
Probability Of Future RSBT Bear Markets
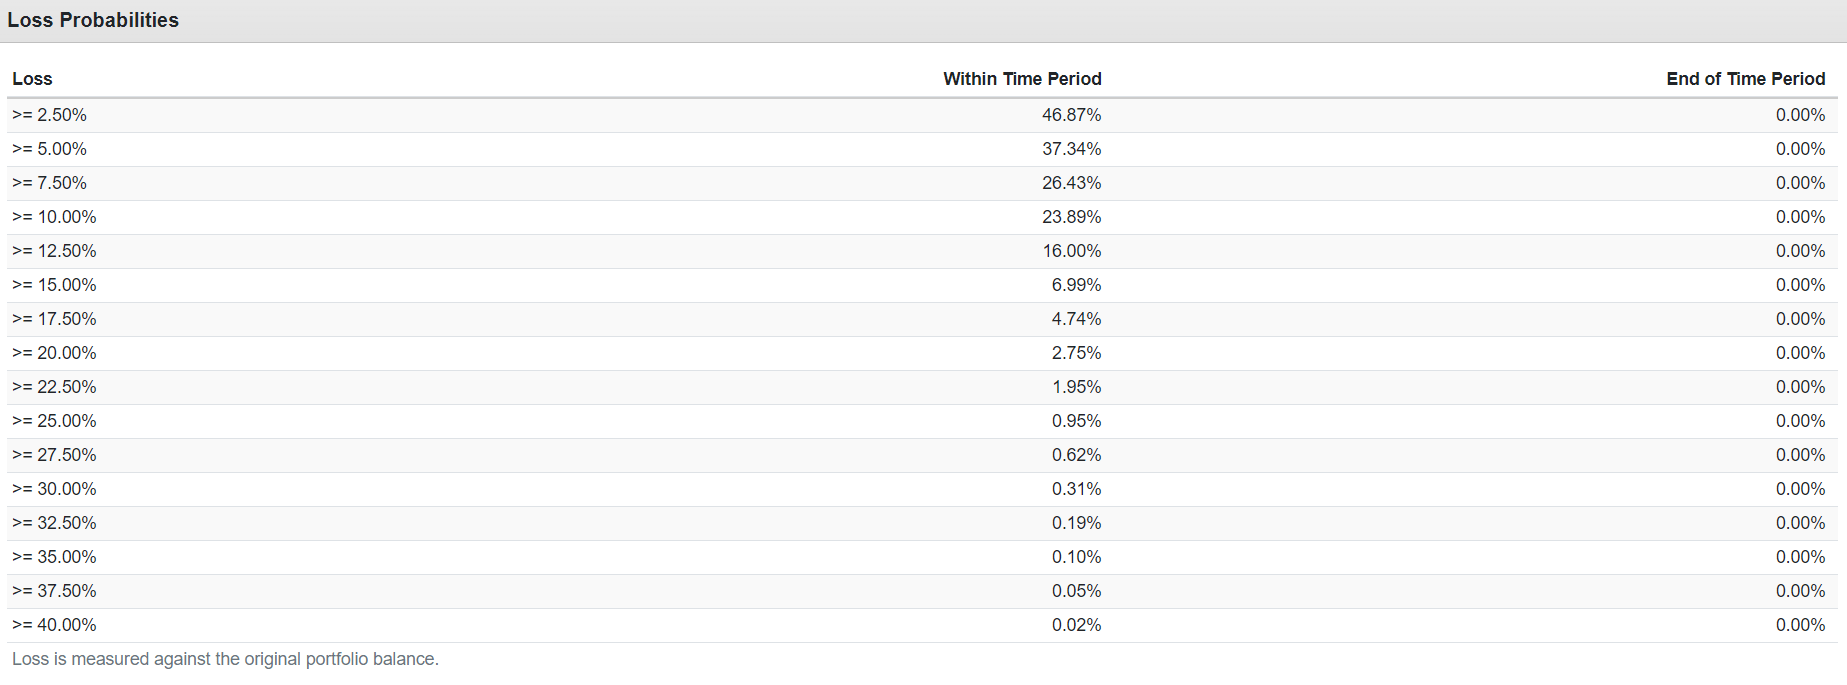
Using a 75-year 10,000 Monte Carlo simulator, we can see that RSBT's strategy, which suffered a peak decline of 20% during the Great Recession, has a 0.02% chance of falling 40% in the next 75 years.
Think about it like this. What could cause stocks, bonds, and managed futures to all fall at the same time? 15% inflation?
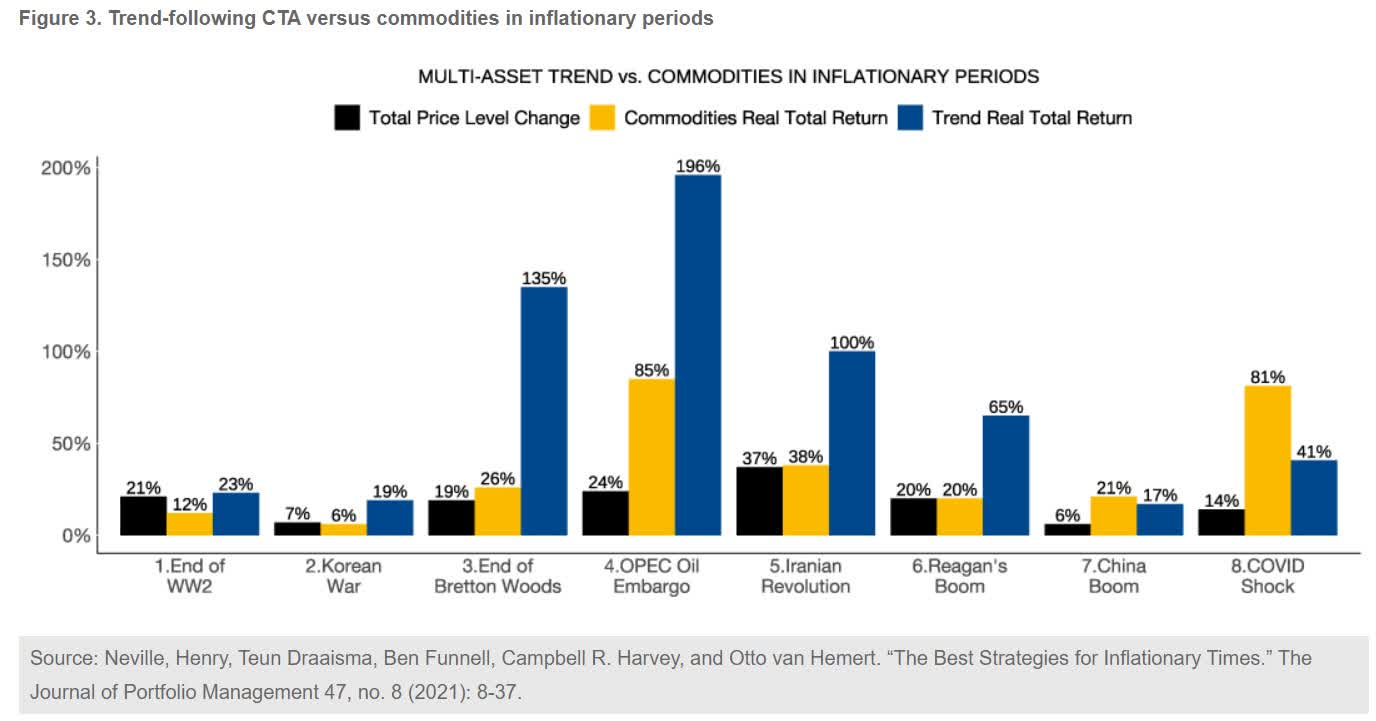
Nope, trend-following managed futures perform best during periods of high inflation.
A prolonged market crash? Like 2000 or 2008?
| Year |
| MLM (KMLM Index) Return |
| 10-Year Treasury Bonds |
| 60/40 |
| S&P |
| 1998 |
| 42.8% |
| 14.9% |
| 23.1% |
| 28.6% |
| 1989 |
| 40.4% |
| 17.7% |
| 26.1% |
| 31.7% |
| 2008 |
| 40.4% |
| 20.1% |
| -14.2% |
| -37.0% |
| 2000 |
| 38.4% |
| 16.7% |
| 1.2% |
| -9.1% |
| 2022 |
| 36.7% |
| -17.8% |
| -18.0% |
| -18.1% |
| 1990 |
| 33.3% |
| 6.2% |
| 0.6% |
| -3.1% |
| 1994 |
| 26.9% |
| -8.0% |
| -2.4% |
| 1.3% |
| 1993 |
| 23.0% |
| 14.2% |
| 11.7% |
| 10.1% |
| 2014 |
| 22.5% |
| 10.7% |
| 12.5% |
| 13.7% |
| 1996 |
| 22.5% |
| 1.4% |
| 14.3% |
| 23.0% |
| 1995 |
| 22.5% |
| 23.5% |
| 31.9% |
| 37.6% |
| 1988 |
| 15.4% |
| 8.2% |
| 13.3% |
| 16.6% |
| 2015 |
| 13.5% |
| 1.3% |
| 1.3% |
| 1.4% |
| 2005 |
| 12.6% |
| 2.9% |
| 4.1% |
| 4.9% |
| 1997 |
| 11.6% |
| 9.9% |
| 24.0% |
| 33.4% |
| 2007 |
| 10.8% |
| 10.2% |
| 7.4% |
| 5.5% |
| 2021 |
| 9.0% |
| -4.4% |
| 15.5% |
| 28.7% |
| 2003 |
| 8.2% |
| 0.4% |
| 17.4% |
| 28.7% |
| 2011 |
| 6.2% |
| 16.0% |
| 7.7% |
| 2.1% |
| 2020 |
| 6.1% |
| 11.3% |
| 15.6% |
| 18.4% |
| 2004 |
| 5.5% |
| 4.5% |
| 8.3% |
| 10.9% |
| 2010 |
| 5.0% |
| 8.5% |
| 12.4% |
| 15.1% |
| 2001 |
| 2.6% |
| 5.6% |
| -4.9% |
| -11.9% |
| 2006 |
| 0.1% |
| 2.0% |
| 10.3% |
| 15.8% |
| 2013 |
| -0.1% |
| -9.1% |
| 15.8% |
| 32.4% |
| 2018 |
| -0.4% |
| 0.0% |
| -2.6% |
| -4.4% |
| 2019 |
| -5.7% |
| 9.6% |
| 22.7% |
| 31.5% |
| 2016 |
| -6.8% |
| 0.7% |
| 7.5% |
| 12.0% |
| 1991 |
| -8.7% |
| 15.0% |
| 24.3% |
| 30.5% |
| 1992 |
| -9.0% |
| 9.4% |
| 8.3% |
| 7.6% |
| 2002 |
| -9.2% |
| 15.1% |
| -7.2% |
| -22.1% |
| 1999 |
| -9.6% |
| -8.3% |
| 9.3% |
| 21.0% |
| 2009 |
| -10.5% |
| -11.1% |
| 11.4% |
| 26.5% |
| 2017 |
| -11.1% |
| 2.8% |
| 14.2% |
| 21.8% |
| 2012 |
| -11.9% |
| 3.0% |
| 10.8% |
| 16.0% |
(Sources: KraneShares, Charlie Bilello.)
Managed futures tend to do best when stocks are crashing.
And 92% of the time since WWII, bonds are flat or rising when stocks are falling.
- During the Great Recession, long bonds were up 75% at the peak of the panic.
Trends following managed futures funds (which DBMF, KMLM, and RSBT all track) are long bonds during crisis periods (other than during stagflation) and short stocks.
- other than short periods of "liquidity cascades" or global margin calls, all three asset classes never fall at the same time
- during the Great Recession, the worst global margin call since the Great Depression RSBT's strategy suffered a peak decline of 20%
- Cory Hoffstein, the CEO of NewFound Research (who runs RSBT), is an expert on liquidity cascades, having authored several research papers on the topic .
- Rodrigo Gordillo, the co-founder of Resolve Asset Management (who runs the managed futures for RSBT), is also a financial research scientist specializing in safe hedging strategies during crisis events.
How is that possible? Because of what it owns and how it's designed and managed.
RSBT - Potentially The Ideal Single ETF Hedging Solution
After researching RSBT for dozens of hours and talking with the CIO of the company running it, here are the fundamental basics of how this ETF is designed and run.
This ETF is 50% bonds (US Barclays's agg index), 50% cash (used as collateral for its leverage), and 100% managed futures.
- Effectively a conservative bond/T-bill portfolio leveraged 100% with managed futures.
It tracks the Soc Gen CTA Trend Following Index.
- Trend following is the most time-tested and successful hedge fund strategy in history.
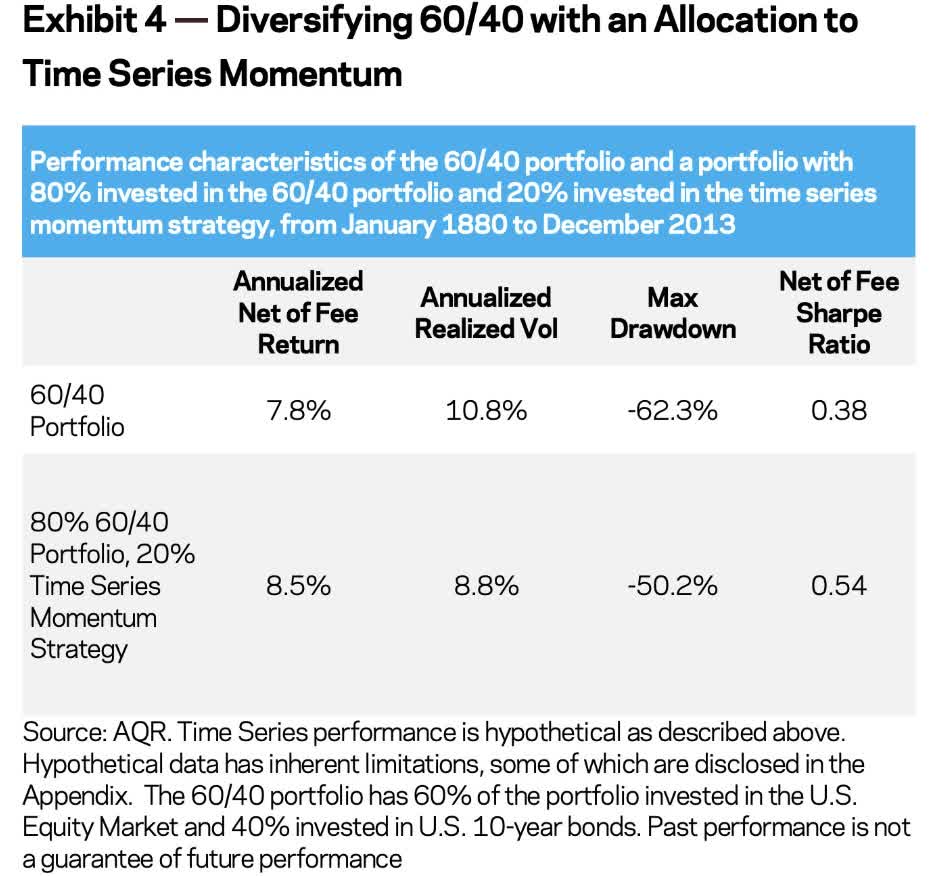
It's a strategy that, since 1880, boosted 60/40's returns by 200% while reducing annual volatility by 2% per year and resulting in a 50% decline during the Great Depression.
- stocks fell 86%
- 60/40 fell 62%.
In other words, trend-following managed futures are NOT speculative but the ultimate battle-tested hedging strategy.
What is the Soc Gen CTA Index that RSBT tracks for its managed futures exposure?
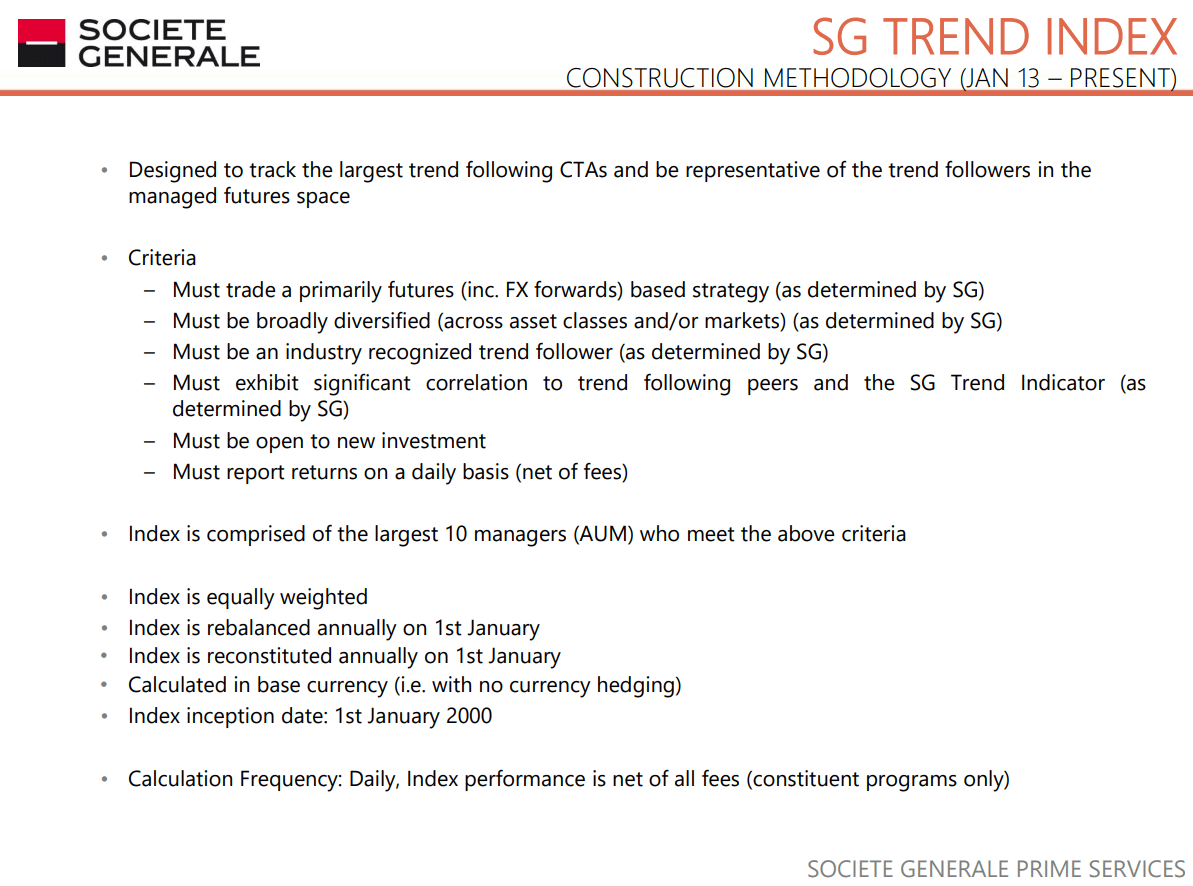
Soc Gen's CTA Trend Following Index is an equally weighted annually rebalanced index of the ten largest trend-following managed futures funds that meet its daily reporting requirements.
- At the start of each year, the index rebalances and always uses the ten largest (and most successful) funds to track.
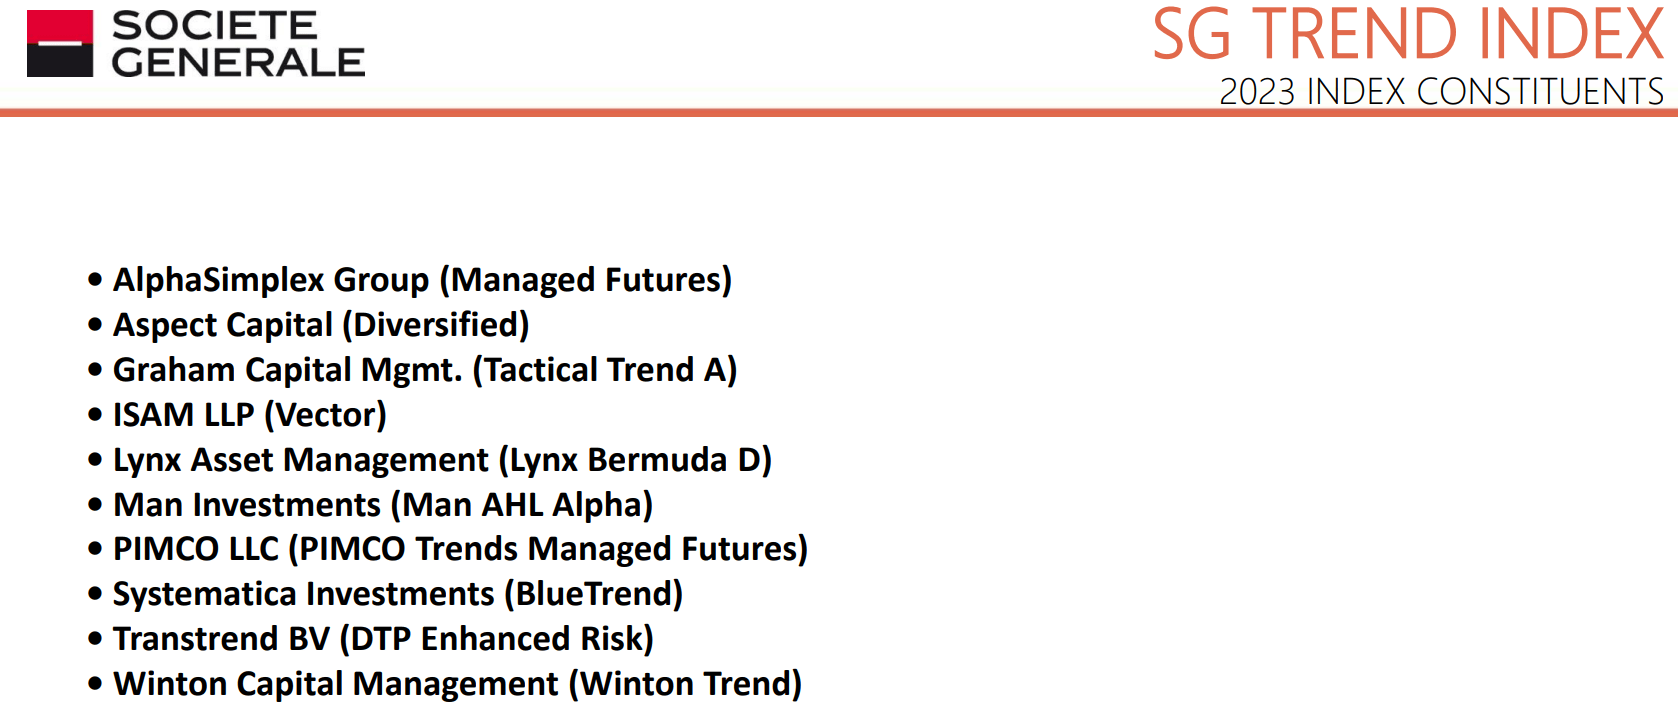
AlphaSimplex and PIMCO are Morningstar's 5-star rated managed futures legends.
Together these ten funds employ hundreds of quantitative analysts and supercomputers running the most advanced trend-following algorithms.
- Wall Street's highest-paid and most skilled commodity, currency, bond, and stock traders.
Those world-class traders determine which of up to 27 types of stocks, commodities, bonds, and currencies RSBT will own, in what qualities, and in which direction (long or short).
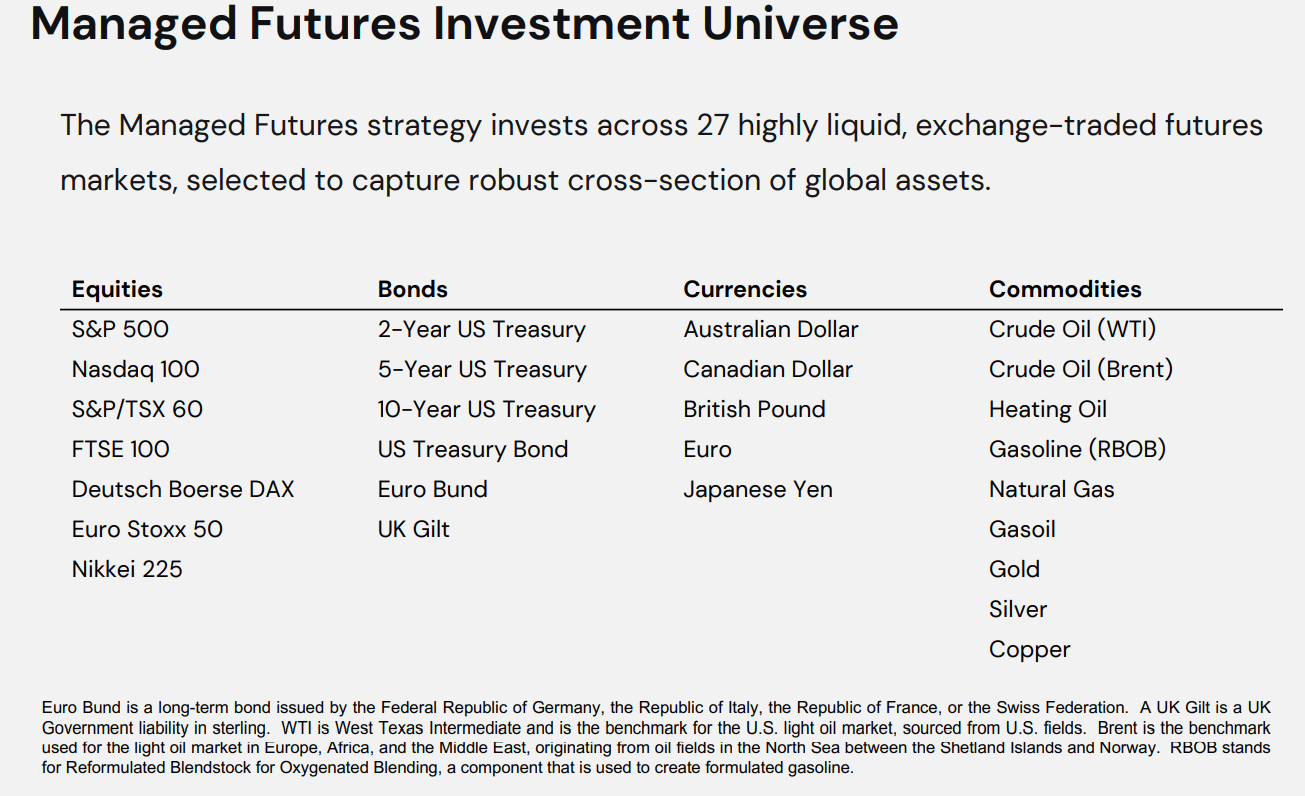
DBMF uses 10 to 15 futures contracts to recreate the pre-fee returns of the Soc Gen CTA index (top 20 funds).
- US and global stocks
- currencies (Euro, Yen)
- US bonds.
KMLM uses 22 futures contracts on currencies, commodities, and bonds.
RSBT uses up to 27 futures contracts, including U.S. stocks, U.S. growth stocks, and UK, German, European, and Japanese stocks.
Basically, RSBT offers the best diversification of the three managed futures ETFs and the best historical returns (based on strategy).
How RSBT Manages Your Money
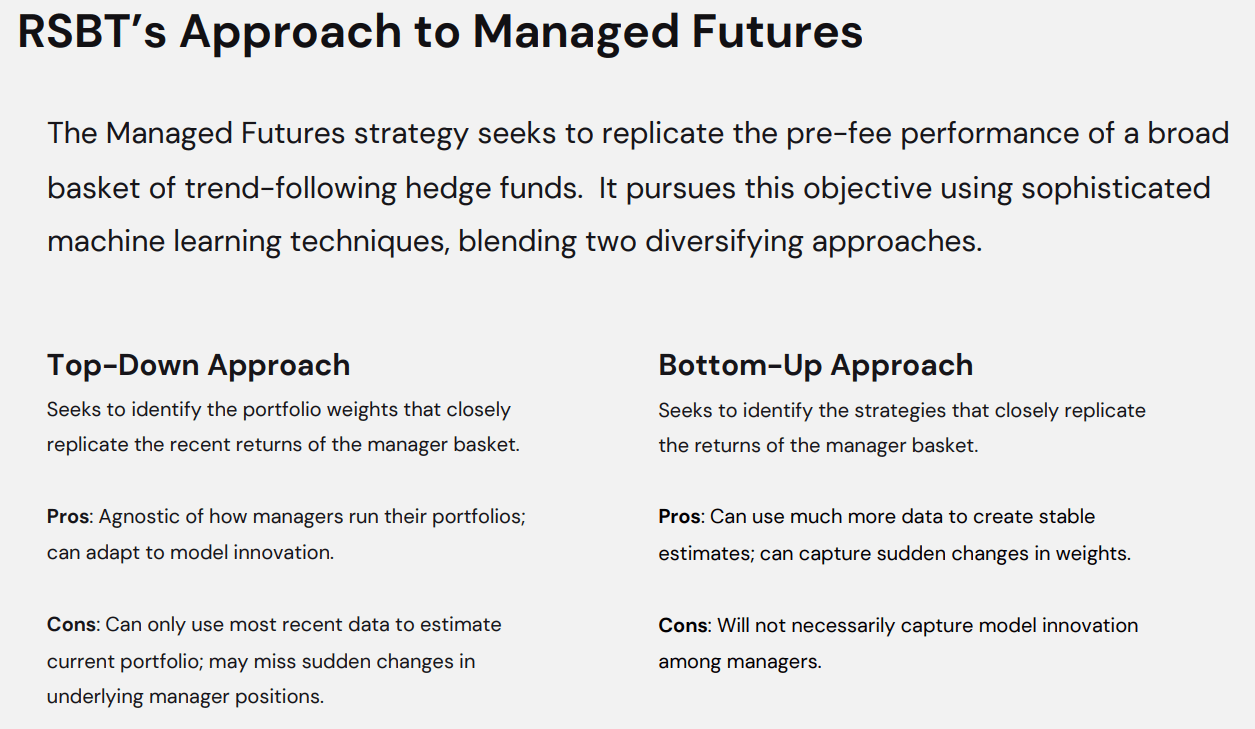
DBMF uses a top-down approach, and so does KMLM.
They use their algorithms to use a two and one-month lookback period to determine what futures contracts to own, in what amounts, and in what direction (long or short) to match the returns of their respective indexes.
RSBT also uses a bottom-up approach meaning its algos also estimate what specific strategy (such as global macro, carry trade, or short, medium, or long trend) the top 10 trend followers are using.
It then uses a 50/50 weighting for top-down and bottom-up, and rebalances daily.
It updates its holdings each day on its website .
RSBT Portfolio As Of March 14th, 2023
RSBT
The ten biggest trend-following funds are very long European stocks, modestly short sovereign bonds, and very short Fed funds rate.
- Because the Fed might not be done hiking
- note 2 weeks ago RSBT was 130% short 2-year treasuries.
RSBT's blended top-down and bottom-up strategy, combined with daily rebalancing, is designed to catch the start of new trends more quickly than DBMF or KMLM.
- DBMF rebalances weekly using two month look back periods
- KMLM rebalances monthly using daily trends over the last two months.
Risk Profile- Why RSBT Isn't Right For Everyone (And Is Speculative For Now)
Tax Implications
Managed futures funds, just like bond ETFs and REITs, are best owned in tax-deferred accounts.
- they generally deliver 40% to 60% of their income at short-term rates (top marginal tax rates)
- 40% for DBMF and KMLM and 60% for RSBT (due to being 50% in AGG, which is U.S. treasury bonds).
For people in the top marginal tax bracket, up to 36% of the returns can be eaten in taxes if held in taxable accounts. That equates to post-tax returns of
- 5.6% for DBMF
- 6.0% for KMLM
- 7.9% for RSBT.
There is also the issue of tracking error.
- Which tends to be higher than for stock ETFs like SCHD and VIG.
No ETF will track its index exactly, and because these managed futures ETFs use replication algorithms, they don't own the exact same positions as the top managed futures funds.
- they seek to replicate the pre-fee returns of their indexes.
For example, here is how these ETFs performed in 2022:
- KMLM +30% vs. 36% for its index
- DBMF +23% vs. 20% for its index
- RSBT -2% tracking error vs. its strategy since the February 6th inception.
This brings us to why RSBT is speculative, and I'm recommending a 1% allocation to anyone interested in it.
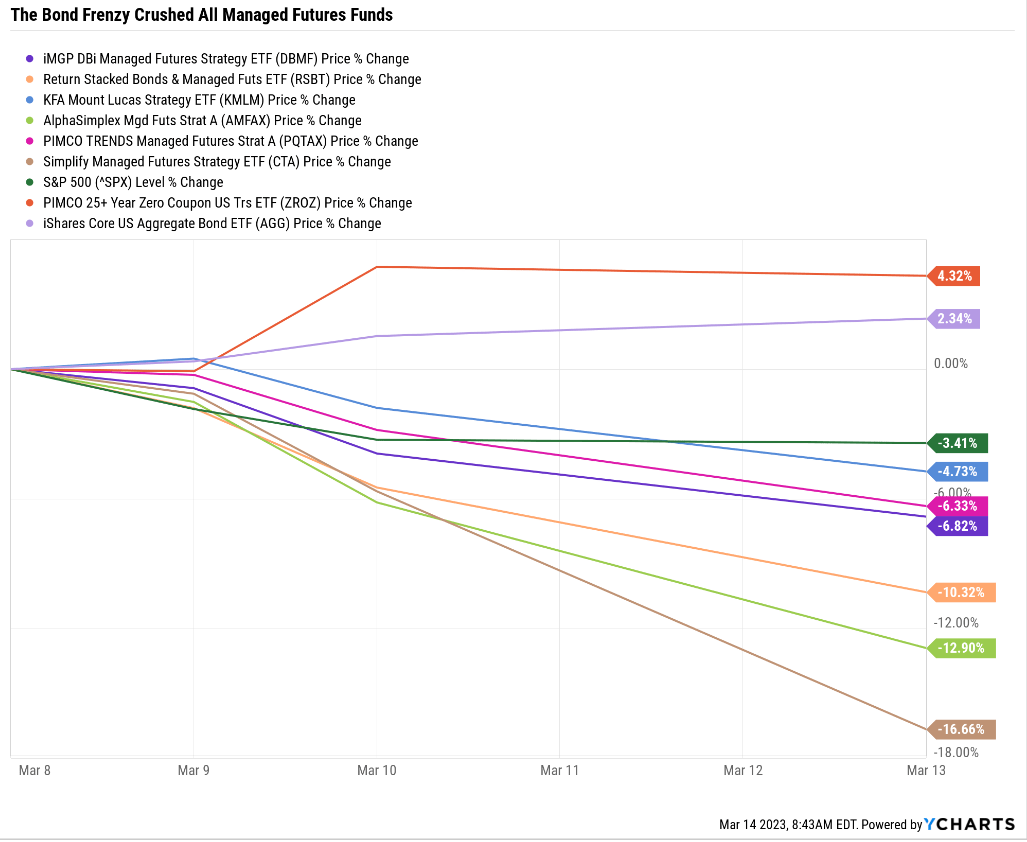
Short-Term Volatility Can Be Extreme When Markets Go Crazy
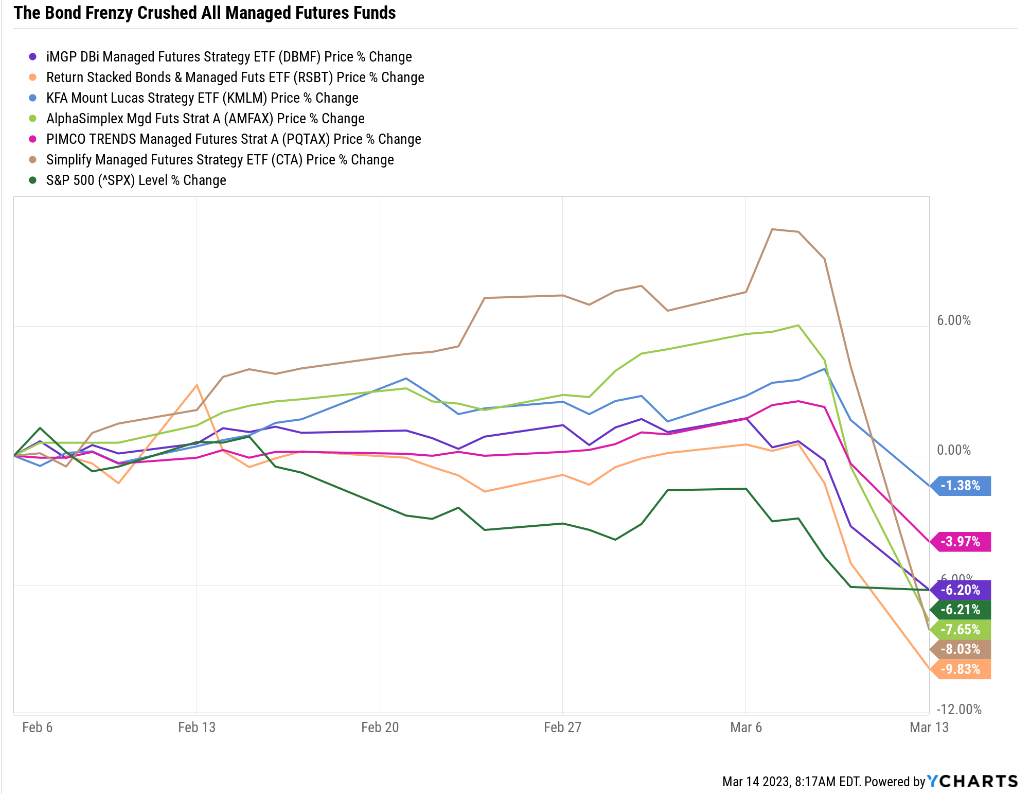
Through March 7th, managed futures were doing a good job hedging a falling market.
And then, the SVB crisis struck, and the bond market went crazy.
- Profit From The SVB Crisis With 3 High-Yield Blue-Chip Bank Bargains
- an introduction to the SVB crisis and what the government is doing about it.
Bloomberg
On Monday, March 13th, 2-year yields, the thing all managed futures were betting would keep going up, fell 0.61%.
- the biggest single-day yield decline since 1981.
For three days 2 year yields crashed by over 1%. That's the biggest 3-day rally in 2-year treasuries since Black Monday, 1987.
- S&P fell 20% in a single day
- Dow fell 22%
- the single largest market decline in US history
- almost 2X bigger than any single-day decline in the Great Depression.
How extreme was March 13th's bond market rally? It was a five-standard deviation (sigma) event.
- 1 in 1 million day event
- if we lived in a normal probability curve world
- which we do not.
In the real world, extreme things can happen far more frequently than normal probability curves indicate.
For example, what is the probability of the stock market falling 20% in a single day? That's a 25 standard deviation event.
- a once in 25 million, million, million, million, million-day event.
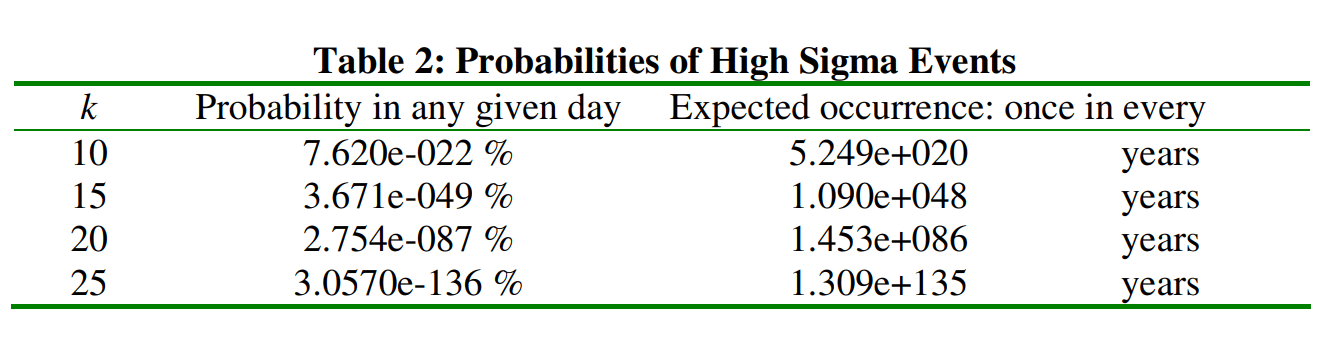
The universe is 14 billion years old, and scientists think it will survive approximately 100 trillion years before all the stars burn out.
That's 100 X 10^12 years for the lifetime of the universe.
If we lived in a normal distribution world, a 20% stock market crash in a single day should never happen, not in 1X 10^123 lifetimes of the universe.
But we live in a complex interconnected world where bad things in financial markets beget other bad things.
According to Xavier Gabaix, a professor of economics and finance at Harvard, one certainly will-someday. According to a complex model he has devised, the stock market will suffer a 22.6% one-day decline every 150 years, on average. A one-day decline as deep as 1929's-12.8%-should occur every 27 years, on average." - WSJ (emphasis added).
Today circuit breakers limit stock market declines to 20% in a single day. But on average, that could happen once every 150 years.
And a Great Depression, like a 13% daily decline? That's something individual investors might experience twice in their lifetime.
This is what happens when a five sigma event catches an entire industry offside.
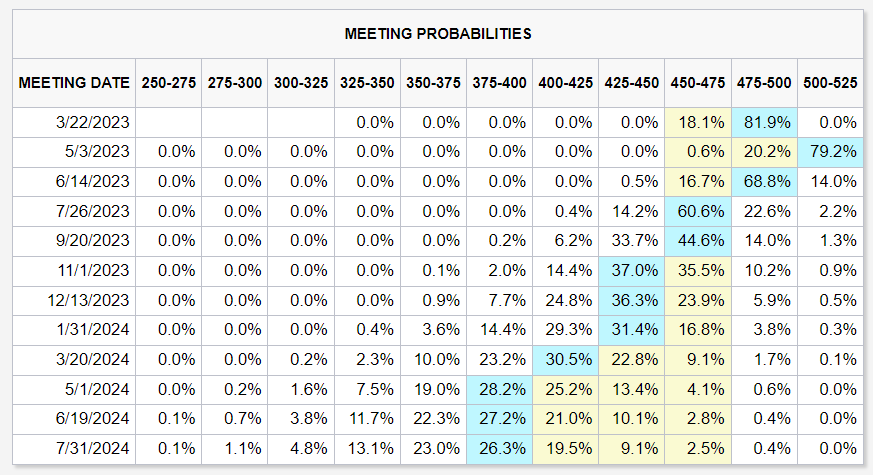
The bond market is now reversing and bond yields are soaring again, with 2-year yields up 28 basis points or 7% as I write this.
The bond market thinks the fed will hike to 5%, which is reasonable given inflation and economic data.
What about all those rate cuts starting in June? Unless we're facing a financial crisis those aren't likely.
However, bond yields have likely peaked and in the coming 2 to 3 months, managed futures funds will likely go neutral bonds. If bonds resume their rally due to recession fears, then they will go long bonds.
Why did DBMF and RSBT do particularly poorly while KMLM did so well? Because of European stocks.
Starting in October European stocks, which were trading near 10X earnings, ripped higher and have been red hot. So naturally trend followers started going long EU stocks.
In the last few days, EU stocks, overexposed to financials, fell off a cliff, including a more than 3% decline on March 13th.
What happens if your fund is super short 2-year yields when they fall the most in 41 years and you're 30% to 50% long EU stocks that fall over 3%? A very bad day, and what's likely an end to a horrific 3 days.
But that doesn't mean that managed futures don't work. Remember these are trend following funds that can't pivot on a dime. They follow trends that usually take 2 to 3 months to establish themselves.
If something huge happens overnight that roils financial markets, they can be caught flat-footed.
For example, RSBT's strategy since 2000 suffered a peak decline of 20% during the managed futures bear market of 2016 to 2019.
- DBMF would have fallen 15% during this time
- KMLM would have fallen 23%.
No strategy works every time; if it did, everyone would buy it and it would stop working.
What if you were 67% stocks and 33% managed futures during the worst industry bear market in history? Thanks to stocks soaring 72% during this time, your portfolio would have made 42% or 9% per year.
And we can't forget that back-testing gives us a good idea of how well a strategy works, but it can hide the pain and fear created by wild daily, weekly, and even monthly returns.
Consider AMFAX and PQTAX, two five-star rated managed futures funds, and KMLM, whose MLM index is the best-performing managed futures index since 1988.
Total Returns Since Jan 2021
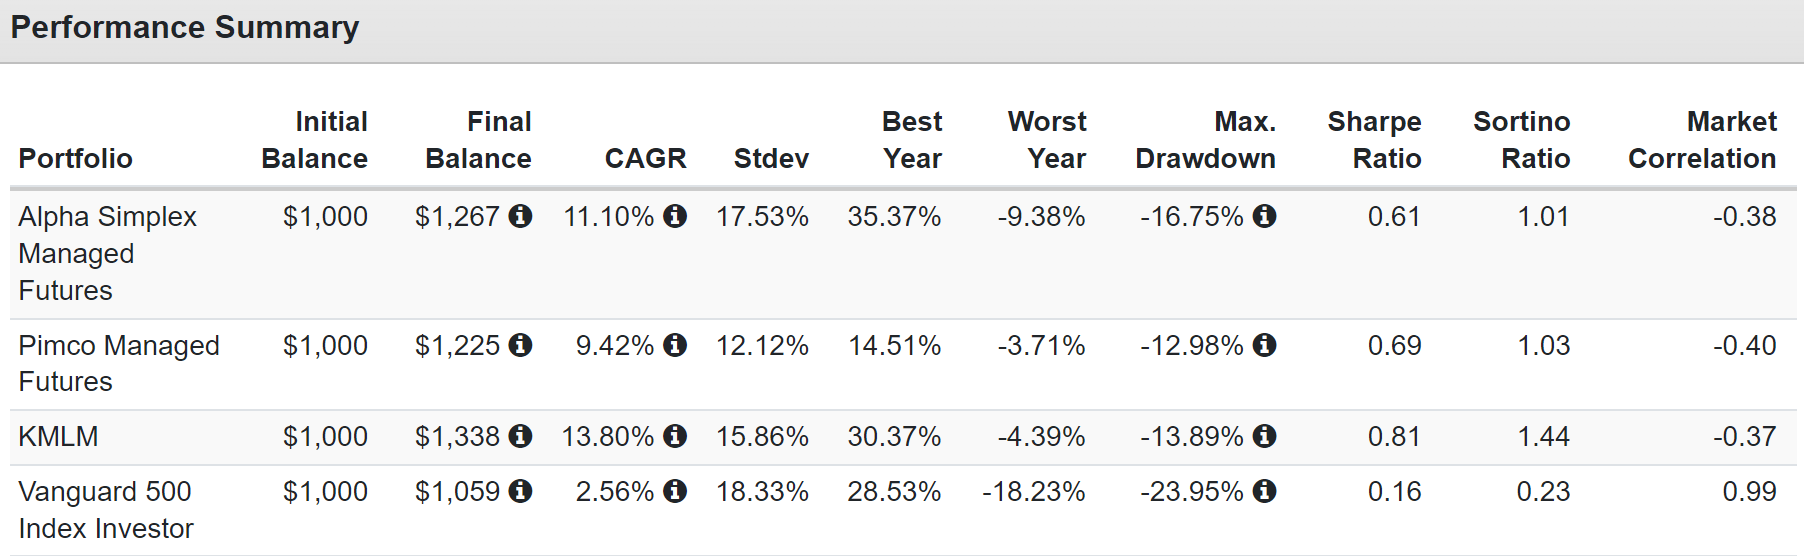
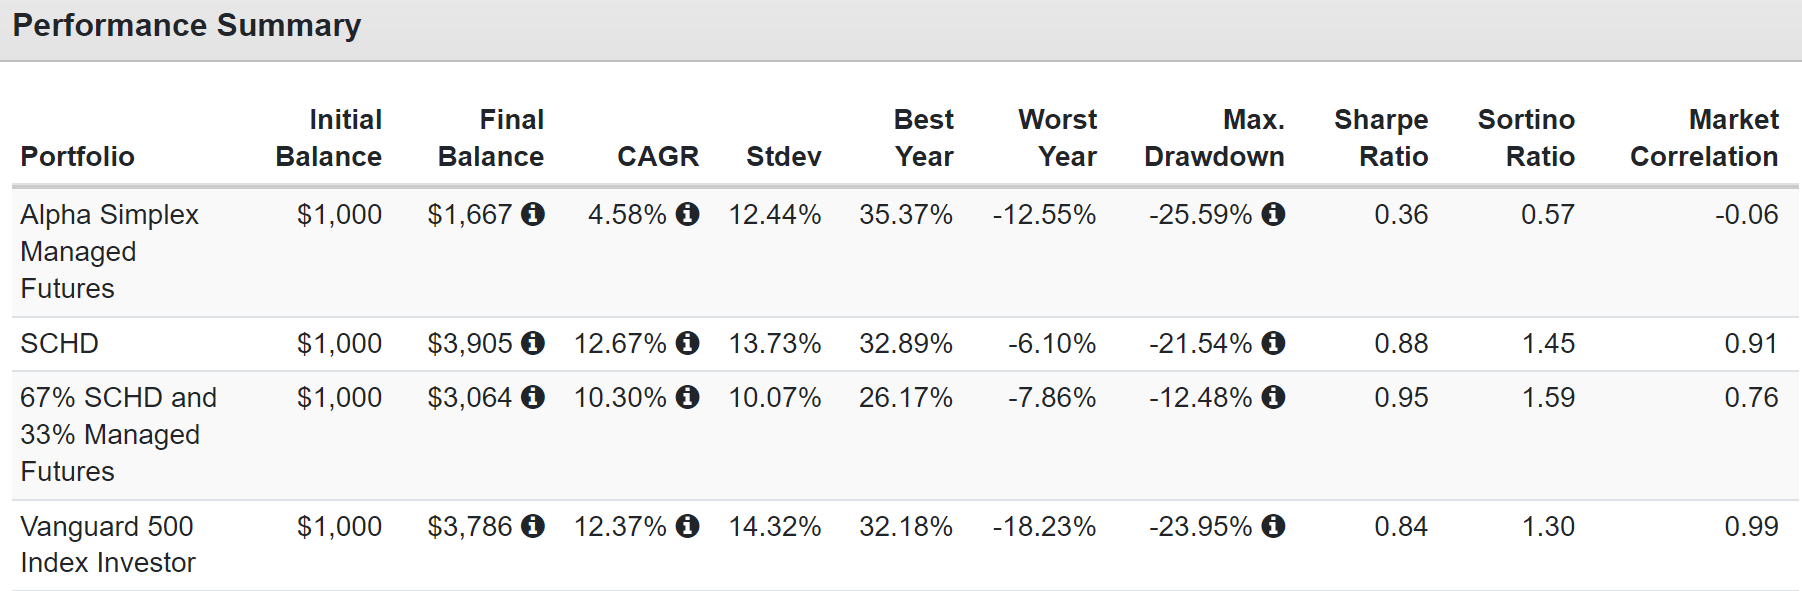
Seems great, doesn't it? Better returns, smaller peak declines, and far superior negative volatility-adjusted returns (Sortino ratio).
But summary statistics hide the wild swings that all managed futures, and all stocks in general, will eventually have.
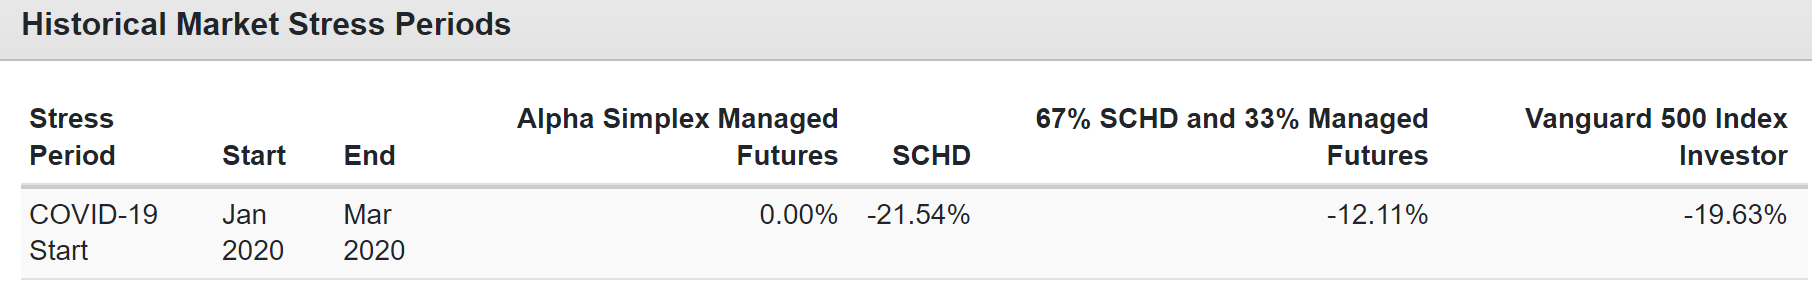
What happens when there is no time for trends to form? In the Pandemic, there wasn't, and managed futures were flat.
KMLM was lucky that it was short commodities and neutral bonds and thus went up 13%.
Long bonds were up 16% during the four-week crash.
But look at some of these monthly returns, both good and bad.
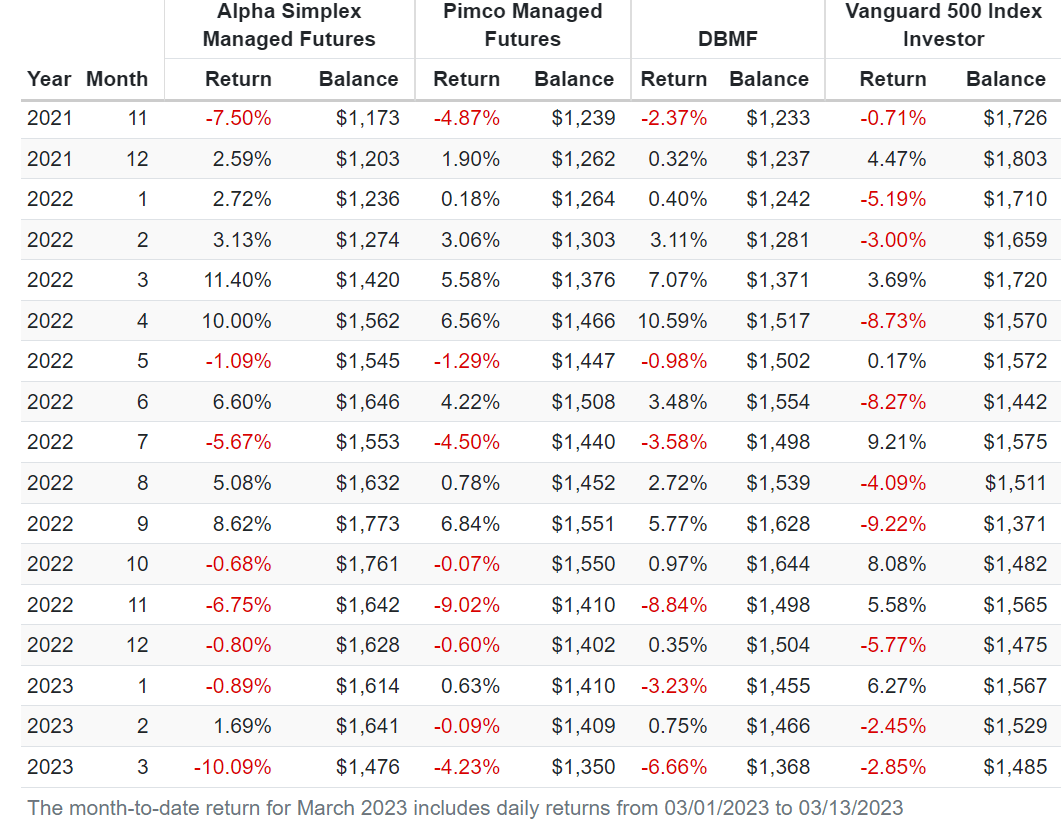
Great long-term returns with excellent diversification benefits, but at times trend following managed futures will be on the wrong side of the trend.
They eventually adapt. But sometimes, if the financial markets trade choppy and no sustainable trend forms, they can deliver disappointing returns for years.
This Is Why You Should Never Own Just Managed Futures
In 2022 everyone wanted to own AMFAX for its 35% gain while the market fell 18%.
But what about 2012, when the market was up 16%, and AMFAX fell 11%?
Or how about in 2013, when AMFAX was up 13%, but the S&P soared 32%?
The role of managed futures isn't as a timing tool; it's a permanent diversifying asset, something you can hold forever and know that your portfolio will do well over time.
Total Returns Since 2011
Managed futures are not an asset class that doesn't suffer bear markets. It's a diversifying asset that zigs when the market zags, and that's what saved you in bear markets.
Bottom Line: RSBT Is A Potentially Game-Changing 12.4% Yielding ETF For Your Ultra SWAN Retirement Portfolio
Not everyone needs to be hedged. If you have a true iron stomach, a Buffett-like mindset, Vulcan-like discipline, and devotion to pure logic, then owning 100% pure stocks is likely the best long-term strategy.
For example, we just saw how owning SCHD since 2011 would have outperformed the S&P by a bit and with lower volatility.
But what if you couldn't handle SCHD's 21% peak decline during the Pandemic crash? You might have panic-sold right near the bottom before SCHD ripped higher by 68% over the next year!
But had you owned SCHD and managed futures, you could have earned 83% of the returns of pure SCHD, with half the peak decline.
The 60/40 is designed to provide 70% of the S&P's returns with 70% of the peak declines.
Blue-chip ETFs + managed futures can get you 80% of the market's returns with 50% smaller peak declines.
And if you combine blue-chip ETS with individual blue-chips and managed futures? Then you can beat the market with lower declines and ride over the most extreme market potholes in a limousine.
A personal hedge fund optimized for your goals and risk profile is the best solution for everyone else, including my family.
- 4.2% yield and 14.2% return potential and 12% to 16% income growth (24% in 2022) is better than any ETF or fund on Wall Street.
Why?
| Bear Market |
| ZEUS Income Growth |
| 60/40 |
| S&P |
| Nasdaq |
| 2022 Stagflation |
| -9% |
| -21% |
| -28% |
| -35% |
| Pandemic Crash |
| -9% |
| -13% |
| -34% |
| -13% |
| 2018 |
| -10% |
| -9% |
| -21% |
| -17% |
| 2011 |
| 4% |
| -16% |
| -22% |
| -11% |
| Great Recession |
| -20% |
| -44% |
| -58% |
| -59% |
| Average |
| -9% |
| -21% |
| -33% |
| -27% |
| Average Decline vs. Benchmark |
| NA |
| 43% |
| 27% |
| 33% |
| Median Decline |
| -9% |
| -16% |
| -28% |
| -17% |
| Median Decline Vs. Benchmark |
| NA |
| 56% |
| 32% |
| 53% |
(Sources: Portfolio Visualizer Premium, Charlie Bilello, Ycharts.)
This is how ZEUS Income Growth performed in the last five bear markets, with an average and median peak decline of 9%.
What if ZEUS were 33% RSBT, replacing all other hedges? Then in 2022, the peak decline would have been just 5%.
On October 13th, 2022, the S&P is down 28%, 60/40 down 21%, Nasdaq is down 35%, and ZEUS Income Growth is down just 5%.
- 82% lower peak decline in a stagflationary bear market
- the worst year for a 60/40 in U.S. history.
That standout performance would have reduced ZIG's average bear market decline to 8% in the last five recessions.
My family trusts this portfolio with our life savings, hopes, dreams, and charitable trust. I've studied stocks, asset allocation, and portfolio construction theories for eight years. My family's hedge fund is the culmination of that life-long journey that will continue forever or until I die, whichever comes first.
And guess what? ZEUS Income Growth Runs circles around other famous hedge funds that cost about 15X more in fees.
Total Returns Since December 2007 (Star Of The Great Recession)
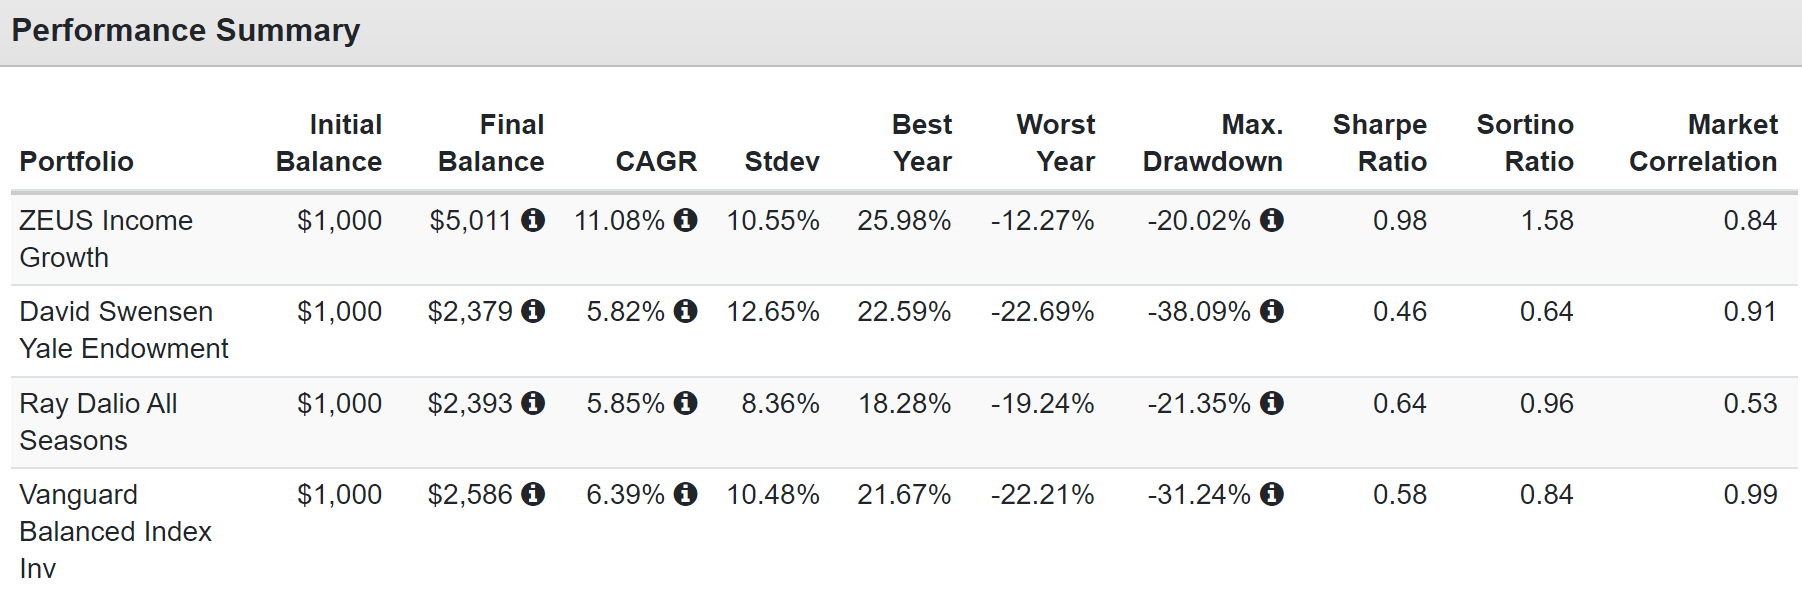
These are PRE-FEE returns that average 5% for hedge funds. Why pay 5% when you can earn superior returns with less volatility and smaller peak declines? How about 2X the yield of a 60/40 with twice the negative volatility-adjusted returns (Sortino ratio).
That's the power of the DK Zen Extraordinary Ultra Sleep-Well-At-Night ((ZEUS)) Income Growth Portfolio. And RSBT offers the potential to make it even better.
Not in every single scenario; nothing can work all the time. On March 13th being 33%, RSBT would have resulted in a terrible single-day decline of -2% when the market was down 0.2%.
But this is the nature of successful long-term SWAN income investing. You can't obsess over daily, weekly, or even monthly returns. You have to go with what's most likely to meet your goals over years and decades.
97.68% likely to beat the S&P 500 Over The Next 50 Years
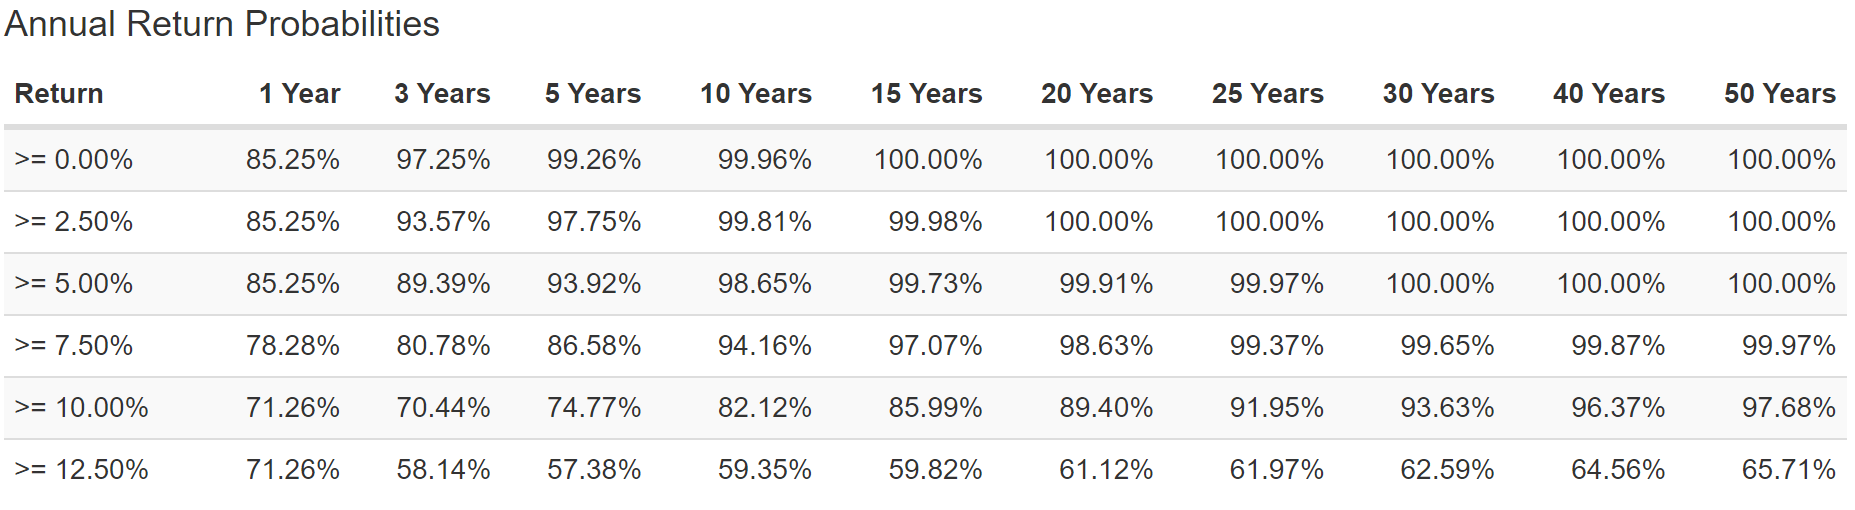
Based on historical returns similar to what analysts expect from each of these assets, and 10,000 Monte Carlo simulations, this portfolio is 99.97% likely to beat a 60/40 and 97.68% likely to beat the S&P over the next 50 years.
And that's without RSBT potentially doubling the returns of the 33% hedging bucket.
Remember Buffett's own words.
In 58 years of Berkshire management, most of my capital-allocation decisions have been no better than so-so ." Warren Buffett 2022 shareholder letter (emphasis added).
Stock picking isn't why Buffett is the greatest of all time; patience, discipline, and responsible use of 60% leverage made his 12.8% unlevered returns 20% for 58 years.
In his own words, Buffett is a "so-so" stock picker but a heck of an asset allocator. That's what my eight years of research also conclude. Asset allocation, not stock picking, is the key to getting rich and staying rich.
90% of returns are driven by asset allocation. Stock picking is the least important of the five fundamentals determining 97% of long-term success.
To become a great long-term investor and achieve your financial dreams, you only have to remember and practice the only fundamentals that matter.
How To Retire Rich And Stay Rich In Retirement
- What are your financial goals? How much money/income do you REALLY need?
- What asset allocation (90% of long-term returns) is best for your needs and risk profile?
- What ETFs (if any) should be the core of your portfolio to meet your goals?
- What individual blue chips (if any) can enhance your core portfolio's yield, growth, income growth, and total return potential?
- What is the best rebalancing schedule for your needs (annual works best for most people).
This is how you achieve true financial independence and sleep well at night, no matter what the stock market, economy, inflation, interest rates, the Fed, or geopolitics are doing.
Not on any given day but over years and decades. Because fortunes aren't made in a day, they are built over time.
And that's why I own a bit of RSBT and hope to own a lot more in the future once its proven strategy proves itself in ETF form.
For further details see:
RSBT: Why I Own This Potentially Life-Changing 12.4%-Yielding ETF