BALL - RTM: Materials Dashboard For February
Summary
- Mining/metals and construction materials show attractive value and quality scores.
- We look at Invesco S&P 500 Equal Weight Materials ETF, an equal-weight ETF beating capital-weighted funds in valuation and past return.
- 4 stocks cheaper than their peers in February.
This monthly article series shows a dashboard with aggregate industry metrics in materials. It is also a review of sector ETFs like the Materials Select Sector SPDR ETF ( XLB ) and the Invesco S&P 500 Equal Weight Materials ETF ( RTM ), whose holdings are used to calculate these metrics.
Shortcut
The next two paragraphs in italic describe the dashboard methodology. They are necessary for new readers to understand the metrics. If you are used to this series or if you are short of time, you can skip them and go to the charts.
Base Metrics
I calculate the median value of five fundamental ratios for each industry: Earnings Yield ("EY"), Sales Yield ("SY"), Free Cash Flow Yield ("FY"), Return on Equity ("ROE"), Gross Margin ("GM"). The reference universe includes large companies in the U.S. stock market. The five base metrics are calculated on trailing 12 months. For all of them, higher is better. EY, SY and FY are medians of the inverse of Price/Earnings, Price/Sales and Price/Free Cash Flow. They are better for statistical studies than price-to-something ratios, which are unusable or non available when the "something" is close to zero or negative (for example, companies with negative earnings). I also look at two momentum metrics for each group: the median monthly return (RetM) and the median annual return (RetY).
I prefer medians to averages because a median splits a set in a good half and a bad half. A capital-weighted average is skewed by extreme values and the largest companies. My metrics are designed for stock-picking rather than index investing.
Value and Quality Scores
I calculate historical baselines for all metrics. They are noted respectively EYh, SYh, FYh, ROEh, GMh, and they are calculated as the averages on a look-back period of 11 years. For example, the value of EYh for packaging in the table below is the 11-year average of the median Earnings Yield in packaging companies.
The Value Score ("VS") is defined as the average difference in % between the three valuation ratios (EY, SY, FY) and their baselines (EYh, SYh, FYh). The same way, the Quality Score ("QS") is the average difference between the two quality ratios (ROE, GM) and their baselines (ROEh, GMh).
The scores are in percentage points. VS may be interpreted as the percentage of undervaluation or overvaluation relative to the baseline (positive is good, negative is bad). This interpretation must be taken with caution: the baseline is an arbitrary reference, not a supposed fair value. The formula assumes that the three valuation metrics are of equal importance.
Current data
The next table shows the metrics and scores as of last week's closing. Columns stand for all the data named and defined above.
| VS |
| QS |
| EY |
| SY |
| FY |
| ROE |
| GM |
| EYh |
| SYh |
| FYh |
| ROEh |
| GMh |
| RetM |
| RetY |
| Chemicals |
| -17.04 |
| 7.96 |
| 0.0467 |
| 0.4992 |
| 0.0068 |
| 21.89 |
| 40.17 |
| 0.0436 |
| 0.4545 |
| 0.0213 |
| 18.01 |
| 42.59 |
| 1.10% |
| 0.18% |
| Constr. Materials |
| 40.57 |
| 52.23 |
| 0.0673 |
| 0.9077 |
| 0.0401 |
| 22.81 |
| 29.88 |
| 0.0336 |
| 0.8803 |
| 0.0339 |
| 11.33 |
| 28.97 |
| 7.57% |
| -3.76% |
| Packaging |
| 14.30 |
| 15.27 |
| 0.0710 |
| 1.1539 |
| 0.0322 |
| 23.39 |
| 24.59 |
| 0.0485 |
| 1.0585 |
| 0.0368 |
| 17.68 |
| 25.02 |
| 1.45% |
| 2.05% |
| Mining/Metals |
| 54.76 |
| 78.84 |
| 0.0729 |
| 1.3566 |
| 0.0418 |
| 23.16 |
| 22.76 |
| 0.0431 |
| 1.1882 |
| 0.0231 |
| 9.32 |
| 20.85 |
| 0.68% |
| 9.55% |
Value and Quality chart
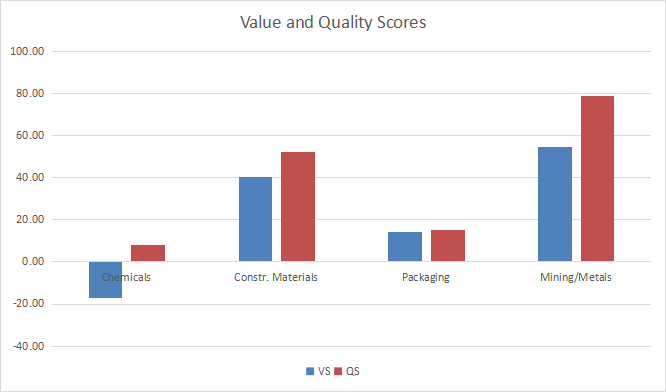
The next chart plots the Value and Quality Scores by industry (higher is better).
Value and quality in materials (Chart: author; data: Portfolio123)
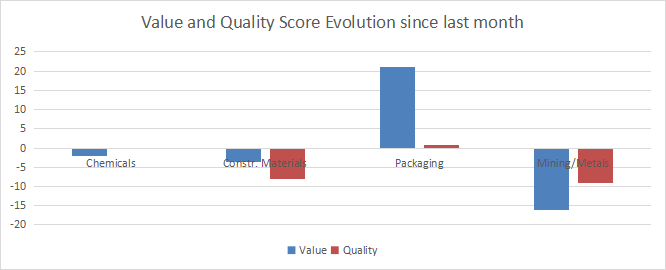
Evolution since last month
The value score has improved in packaging and deteriorated in mining/metals.
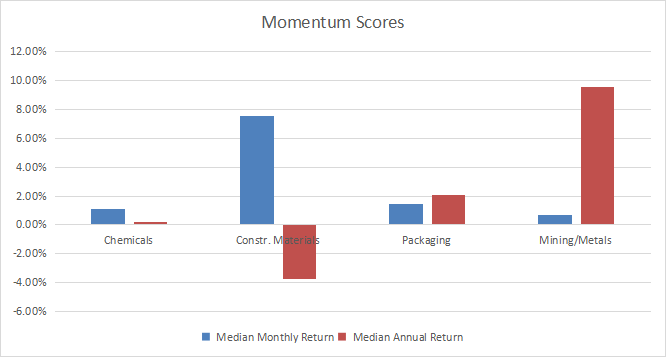
Momentum
The next chart plots momentum data.
Interpretation
Regarding value and quality scores, the most attractive subsector is mining/metals, followed by construction materials and packaging. These 3 subsectors are above their 11-year averages in both valuation and quality. Chemicals are overvalued by about 17% relative to the historical baseline. Its quality score is good, but not high enough to justify such overvaluation.
Fast facts on RTM
The Invesco S&P 500 Equal Weight Materials ETF ( RTM ) has been tracking the S&P 500 Equal Weight Materials Index since 11/01/2006. It holds 29 stocks and has a total expense ratio of 0.40%, whereas the capital-weighted ETF XLB charges only 0.10%.
All constituents have the same weight after every rebalancing, but they may drift with price action. The next table lists the top 10 holdings, with an aggregate weight of 37.7%. These are the stocks with the highest momentum since the last rebalancing. Risks related to individual companies are lower than in XLB. The top name, Linde PLC ( LIN ), represents about 17% of asset value in the capital-weighted fund.
| Ticker |
| Name |
| Weight% |
| EPS growth %TTM |
| P/E TTM |
| P/E fwd |
| Yield% |
| LyondellBasell Industries NV |
| 4.05 |
| -29.58 |
| 8.49 |
| 10.83 |
| 4.75 |
| Celanese Corp. |
| 3.96 |
| -38.62 |
| 8.12 |
| 7.64 |
| 2.28 |
| Steel Dynamics, Inc. |
| 3.96 |
| 32.56 |
| 6.04 |
| 10.80 |
| 1.08 |
| Dow, Inc. |
| 3.92 |
| -25.48 |
| 9.57 |
| 17.86 |
| 4.69 |
| Nucor Corp. |
| 3.81 |
| 22.87 |
| 5.92 |
| 13.56 |
| 1.20 |
| DuPont de Nemours, Inc. |
| 3.65 |
| 9.05 |
| 6.40 |
| 20.21 |
| 1.89 |
| Ball Corp. |
| 3.63 |
| -16.00 |
| 26.50 |
| 19.13 |
| 1.36 |
| Freeport-McMoRan, Inc. |
| 3.61 |
| -18.16 |
| 17.84 |
| 21.94 |
| 0.89 |
| Ecolab, Inc. |
| 3.59 |
| -2.52 |
| 43.03 |
| 33.07 |
| 1.29 |
| Albemarle Corp. |
| 3.55 |
| 597.64 |
| 20.68 |
| 9.52 |
| 0.58 |
Ratios: Portfolio123.
RTM is cheaper than XLB regarding the usual valuation ratios:
| RTM |
| XLB |
| Price / Earnings TTM |
| 13.06 |
| 16.91 |
| Price / Book |
| 2.69 |
| 3.06 |
| Price / Sales |
| 1.43 |
| 1.92 |
| Price / Cash Flow |
| 9.93 |
| 11.99 |
Data: Fidelity.
The next table shows that RTM has outperformed XLB since inception in total return and Sharpe ratio (risk-adjusted performance). The difference in annualized return is about 1.9 percentage point.
| Total return |
| Annualized return |
| Max Drawdown |
| Sharpe ratio |
| Volatility |
| RTM |
| 369.67% |
| 9.96% |
| -61.18% |
| 0.5 |
| 22.11% |
| XLB |
| 258.12% |
| 8.14% |
| -59.83% |
| 0.43 |
| 21.17% |
Data calculated with Portfolio123.
In summary, RTM is a good fund for investors seeking exposure to basic materials without the concentration in the largest companies (especially Linde). Moreover, valuation and past performance are compelling. However, XLB is a better instrument for trading and tactical allocation strategies, thanks to much higher trading volumes.
Dashboard List
I use the first table to calculate value and quality scores. It may also be used in a stock-picking process to check how companies stand among their peers. For example, the EY column tells us that a chemical company with an Earnings Yield above 0.0467 (or price/earnings below 21.41) is in the better half of the industry regarding this metric. A Dashboard List is sent every month to Quantitative Risk & Value subscribers with the most profitable companies standing in the better half among their peers regarding the three valuation metrics at the same time. The list below was sent to subscribers several weeks ago based on data available at this time.
It is a dynamic monthly list with a statistical bias toward excess returns on the long-term, not the result of an analysis of each stock.
For further details see:
RTM: Materials Dashboard For February