RVT - RVT Vs. RMT: In Pursuit Of Stable Income
Summary
- RVT and RMT are both income-paying CEFs with a broad focus on companies with a market cap lower than $2 billion.
- RMT has had to lean on more ROC distributions than its sister fund, but this has still been relatively rare.
- RVT has underperformed versus RMT over the last 5 years but has a lower annual management expense and a larger portfolio.
My pursuit of stable sources of forever income has led to two relatively unknown closed-end funds managed by Royce Investment Partners, a New York-based small-cap specialist. Royce Value Trust ( RVT ) and Royce Micro-Cap Trust ( RMT ) are both income-orientated CEFs with a tilt towards micro-cap and small-cap companies. Investors often fail to gain exposure to this part of the market, providing great opportunities for active portfolio management to identify undervalued stocks with healthy long-term potential. Royce's strategy is broadly the same across both CEFs with portfolio managers looking primarily at a strong cash flow profile, balance sheet strength, and returns on invested capital when choosing stocks.
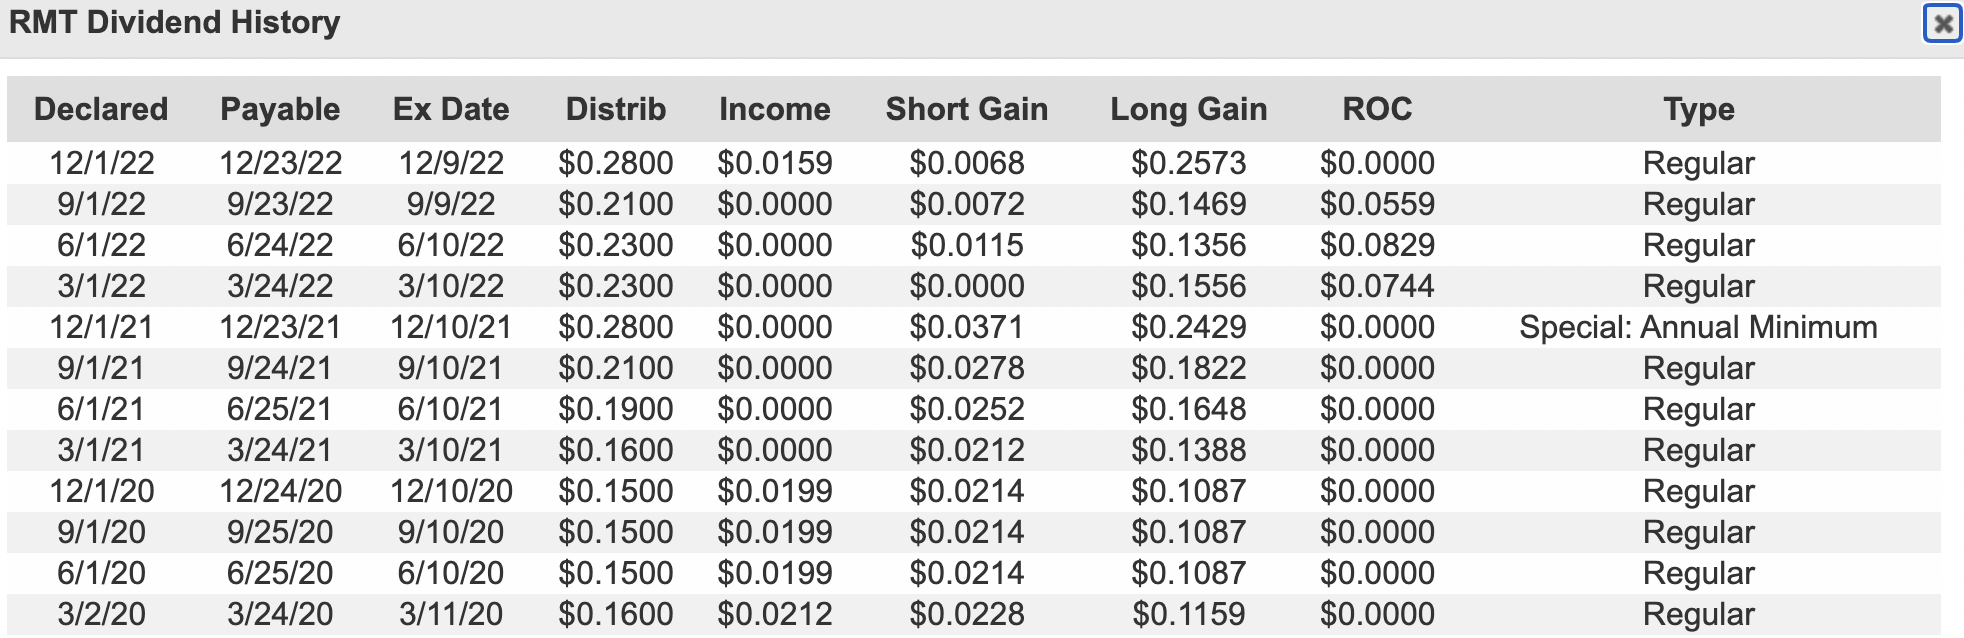
RVT is the larger of both CEFs with a $2.19 billion market cap versus $590 million for RMT. Both have similar mandates, with RMT, as the name implies, primarily focused on microcap stocks. These make up less than 2% of the US equity market and consist of the smallest 1,000 stocks in the small-cap Russell 2000 Index plus the next 1,000 smallest eligible stocks by market cap. A quarterly per share cash payout of $0.28 was last declared by RMT, a 33% increase from the prior payout and for a yield of 12.7% on the current price. Important to note that RMT's distributions have been quite variable with the prior payout of $0.21 itself an 8.7% decline.
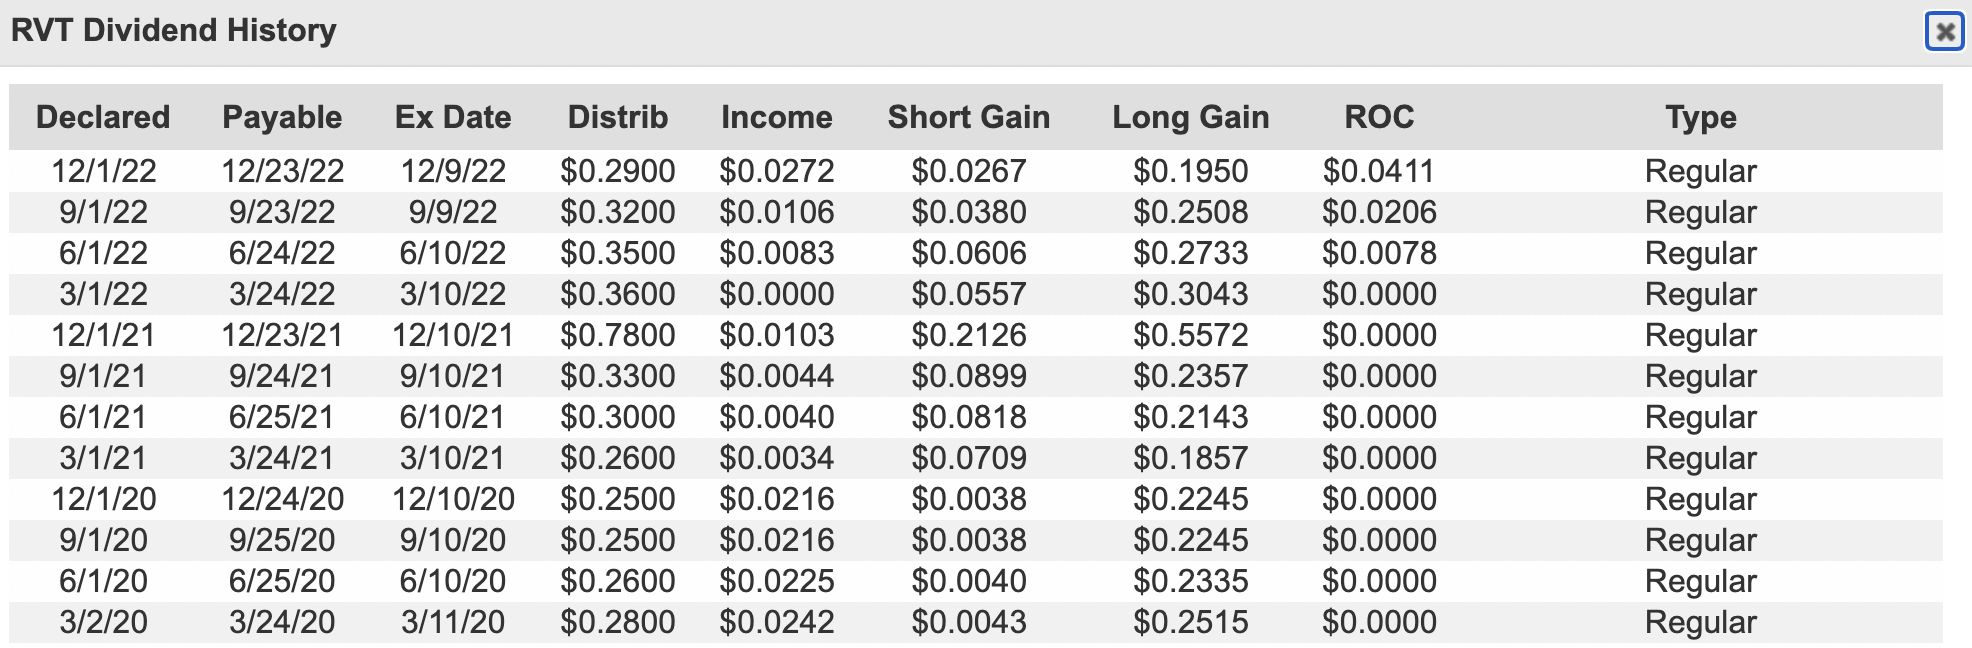
RVT last declared a quarterly per share cash payout of $0.29 , a decline of 9.4% from the prior declaration which at $0.32 , was itself an 8.6% decline. Both CEFs use a managed distribution policy, which is meant to spread any capital gain distributions throughout the year.
Under the policy, RVT and RMP pay distributions at an annual rate of 7% of the average of the prior four quarter-end NAVs. Hence, owners of both CEFs will be paid a base dividend yield of 7% on any given year. This distribution is constituted of long-term capital gains and dividends from portfolio holdings. Fundamentally, NAV volatility will drive distribution volatility.
Distributions, Dividends And Return Of Capital
RMT has very rarely had to lean on ROC for the majority of its dividend payout as long-term capital has constituted the bulk of the fund's returns. The total ROC for the last 12 quarters is $0.2132, around 8.9% of the total $2.40 of quarterly distributions over the same period. That said, ROC isn't inherently worrying when used by an equity fund, the key issues with ROC primarily come up with fixed income funds.
RVT is in the same boat with having to rarely lean on ROC for its quarterly distributions. The CEF's total distribution for the last 12 quarters stands at $4.03 versus the total ROC over the same period of $0.0695, around 1.7% of the total.
However, with some investors opposed to any form of returns through ROC, RVT might be the better choice with its materially lower ROC as a per cent of total distribution over the last 12 months compared to RMT. Both face the same risk of their dividends trending down over the next year as NAV continues to be disrupted by the worst stock market crash since the 2008 financial crisis. 2023 might bring some respite for stock market values, but the global economy is widely tipped to fall into a recession later this year with further interest rate hikes still on the Fed's roadmap for fighting inflation.
Holdings, Sector Allocation And Discount To NAV
With both trading at a discount to their NAV, prospective buyers should receive a partial margin of safety on a new position. RMT has a larger discount to NAV of 11.8%, versus 9.45% for RVT. They've also both historically always traded at a discount, with the current trendline looking like a return to a five-year average and a convergence of the gap that opened between RVT and RMT from the middle of 2021 to late 2022.
RMT has outperformed RVT over the last five years on a total return basis. The 39.33% return of RMT also compares favourably to the Russell 2000 Index which is up 21.62% over the same time period. However, RVT has a lower annual fund management expense at 0.63% versus 1.35% for RMT. This is more than a 2x difference and comes against a 2021 portfolio turnover of 44% for RVT versus 15% for RMT.
RVT held 476 positions as of the end of its last reported third quarter with RMT holding 296 positions, both led by industrials, information technology, and financial stocks. I think the choice of which CEFs to choose will come down to which is expected to me more vulnerable in a recession and whether you'd prefer micro or small cap exposure for the long-term. I'm leaning towards RMT as this is a part of the market that's incredibly niche and where very little investors have exposure to, but will hold off on starting a position until the global economic situation is clearer.
For further details see:
RVT Vs. RMT: In Pursuit Of Stable Income