RWJ - RWJ: Buy This Revenue-Weighted ETF Offering A 45% Downside Capture Without Sacrificing Upside Potential
2023-08-23 01:41:59 ET
Summary
- Equities are not positioned for a decline despite negative trends like consumers running out of savings, high mortgage rates, and increasing financing costs.
- I have focused on income and capital preservation but am now looking for conservative equity selections with downside protection and upside opportunities.
- RWJ offers low downside capture ratios without sacrificing upside potential.
Call me skeptical, but I just can't seem to appreciate how equities are not positioned for a decline considering the multitude of negative trends. These include consumers running out of government-funded savings used to fuel the past 3 years spending spree, mortgage rates over 7.4%, and ballooning finance costs crimping corporate earnings. With a bearish outlook, sitting on my hands while the equity markets play bulls vs bear tug of war has been an acceptable strategy. However, this approach is not without risk, as demonstrated by the ~25% market rally from last Oct lows. While my focus has been on income and capital preservation, I recently began looking for conservative equity selections offering higher than average downside protection along with offering upside opportunities when the market bull returns. Surprisingly, Invesco S&P SmallCap 600 Revenue ETF ( RWJ ) fits the bill.
I maintain a five-category portfolio analysis, based mostly on each asset's underlying investment strategy. As of mid-July, the categories are - Cash and cash alternatives including CDs and bond funds with less than 1-yr maturity (22.9% of portfolio assets), Bonds (8.1%), Equities bought primarily for long-term capital gains (23.7%), Equities bought primarily for income (28.9%), and broad-based Sector ETFs (16.3%). For the past many months, I have focused on investments with strong income attributes, some of which might be considered as "off-beat" selections but with acceptably high and secure yields. These include the electric-cooperative-owned financing firm National Rural Utilities Cooperative Finance Corp bond maturing in 2063 ( NRUC ) and ComEd Financing III 6.35% bond maturing 2033 (CUSP 20035AAA2). ComEd is a subsidiary of Exelon ( EXC ). Currently, my bond portfolio comprises 65% individual bonds including 3rd-party preferred trust securities and 35% floating rate bond funds, offers a current cash yield of 7.5%, generates 15% of total portfolio's income, and equals 8.2% of total portfolio assets. Equities bought primarily for income generate 47% of the portfolio's income and include both common and preferred stock issues.
In Dec 2019, I sold my portfolio of laddered date-specific corporate bond BulletShares in favor of higher yielding preferred stocks, anchored by the security of utility sector preferreds. With interest rates peaking or plateauing over the next few quarters, followed by the usual interest rate decline with the onset of a recession, I have taken a pause in adding to income-oriented assets and am starting to turn my attention to finding equity investments which are purchased with long-term capital gains as the primary objective. I continue to believe the biggest current risk for equities is from a recession-induced decline in profitability and a corresponding reduction in P/E multiples. To counter this risk, investors should analyze their mutual funds and ETFs based on their Downside Capture Ratios and Upside Capture Ratios.
Downside Capture Ratio compares the performance of a mutual fund or ETF against the market movements to the downside. If the market declines by 10% and an ETF declines by 5%, the ETF is calculated to have captured 50% of the market's negative movements and has a Downside Capture Ratio of 50. The opposite calculation is also available, comparing an ETF's upside gain to a positive market movement. If an ETF moves up only 90% of a market's positive movement, it will carry an Upside Capture Ratio of 90.
A noteworthy due diligence exercise is to find ETFs which historically decline less than the market while also maximizing the impact of market rallies. As the saying goes, there is no free lunch and most defensive investments chosen to limit downside market exposure are also poor choices for market rallies. For example, S&P Utility ETF ( XLU ) is often selected as a core defensive holding. According to Morningstar Risk analysis, XLU offers a Downside Capture of 68% and an Upside capture of 71%. XLU has historically declined only 68% of market declines, but also rallied only 71% of market advances. I went looking for ETFs with both a low Downside Ratio and a high Upside Ratio and found a few interesting candidates. Portfoliovisualizer.com offers a sortable screening tool for ETFs, including their calculated Upside/Downside Ratios.
Listed below, as of July 25, are their best US Equity ETFs by Investment Style for Downside Capture Ratio and which offer investors higher Upside than Downside Capture numbers, over the previous 10 years. Of the original 27 selections (top three ETFs from 9 style categories) with the most downside protection, 10 offered less upside opportunity than downside protection and were removed.
ETFs 10-yr Downside Capture Ratio and Upside Capture Ratio (portfoliovisualizer.com, Guiding Mast Investments)
Invesco S&P SmallCap 600 Revenue ETF offers an intriguing profile as having one of the lowest Downside Capture Ratios without sacrificing upside potential. Confirming these numbers, Morningstar risk analysis calculates RWJ ratios as 45% Downside Capture and 103% Upside Capture. The ETF follows the S&P Small-Cap 600 Revenue-Weighted Index . According to RWJ website , the fund and index are described as:
The Index is constructed using a rules-based approach that re-weights securities of the S&P SmallCap 600® Index according to the trailing 12-months revenue earned by the companies, with a maximum 5% per company weighting. The Fund and Index are rebalanced quarterly.
RWJ weighs its portfolio based on TTM revenues and this process translates into an ETF holding many of the larger small cap stocks. According to S&P, the sponsor of the S&P Small-Cap 600 Revenue-Weighted Index, revenue-weighting strategies have outperformed float-adjusted market-capitalization, FMC, across all capitalization grouping: large-caps, mid-caps, and small-caps. As reported in a S&P article titled Revenue-Weighted Indices: An Alternative to Core Equities :
Weighted by constituents' revenues over the previous four quarters, the S&P 500 Revenue-Weighted Index (REVWL) ( RWL ), S&P Mid-Cap 400 Revenue-Weighted Index (REVWM) ( RWK ) and S&P Small-Cap 600 Revenue-Weighted Index (REVWS) ( RWJ ) have historically provided consistent total returns and risk-adjusted outperformance over both short- and long-term periods. Furthermore, all three revenue-weighted indices showed comparable or slightly higher profitability, lower momentum, and smaller size tilt than their corresponding FMC-weighted indices.
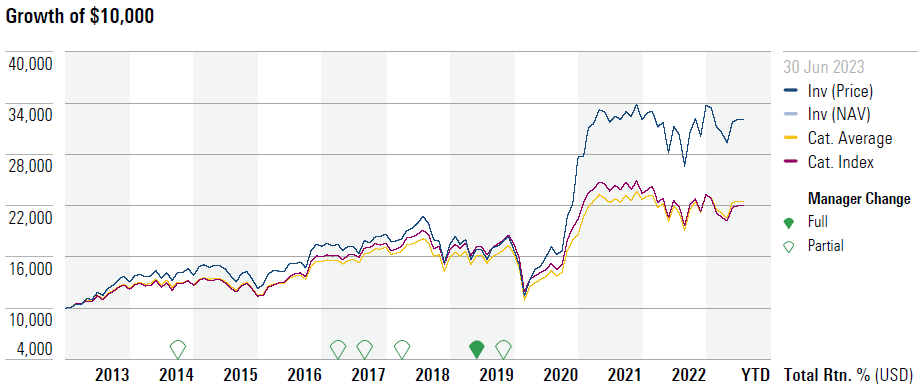
RWJ outperformance over the past 10 years can be seen in the M* chart below. The category index and category average comparisons are the M* Small Value Index. It is noteworthy that outperformance dramatically increased immediately after the 2020 market collapse and about a year after a fund manager change in 2019.
According to the fund information found on the Invesco RWJ website (linked above), listed below are the top portfolio holdings, symbol, percent of assets, industrial sector, and year added. RWJ has a high portfolio turnover of 41% annually, making the overall investment strategy of owning a revenue-weighted portfolio equally important to the individual holdings. The portfolio contains a very diversified 568 positions. The top 10 positions are listed below, as of 8/20/23, and comprise 17.2% of assets.
Sector allocation is also noteworthy. According to the Invesco website, Consumer Discretionary, Industrials, and Energy are the top three sectors and equal 50% of portfolio assets. As shown below, 51% of assets are allocated to these three sectors. The more volatile Technology sector comprises only 7.6% of assets.
Sector Allocation RWJ as of 8/20 (Invesco RWJ website)
Investors looking for an ETF with historic downside protection should review RWJ. To me, the leading uncertainty is whether the next bear market performance will look like the period of 2019 to 2023 or 2013 to 2019? With the extreme overvaluation of most technology stocks and the low exposure to the sector, I am willing to add Invesco S&P Small-Cap, Revenue-Weighted ETF to my ETF portfolio. I have a "good until canceled order" for a starter-sized position of RWJ priced at $36.01, or 5% below its current price. It should be interesting to see when the GTC order is actually triggered.
For further details see:
RWJ: Buy This Revenue-Weighted ETF Offering A 45% Downside Capture Without Sacrificing Upside Potential