RWM - RWM And The Next Market Decline
2023-05-31 00:08:16 ET
Summary
- The Russell 2000 is currently underperforming but is expected to advance in the next few months, with RWM potentially being a better ETF to use in the next market downturn.
- While we expect another decline in a few months, Money managers and dealers' activity in the Russell 2000 futures market suggest it is too early.
- Low buying activity in RWM indicates the possibility of another wave down in the fund, with the price forecast to rise during the second wave of the bear market later this summer.
We covered RWM in this article last October, recommending that investors stay out of the fund and not go short the Russell 2000. We specifically said:
On October 7th there were over 23.8 million shares outstanding, which is a new record. We believe this is a strong indication that both the S&P 500 and Russell 2000 will move higher, and RWM will move lower.
That forecast was correct. We now want to review some of the RWM indicators that led to this forecast and see where they stand today.
Summary and Forecast
Even though it's currently underperforming, the Russell 2000 should continue to advance and RWM decline for another few months. This is not good for current owners of RWM near term.
However, the under-performance of the Russell 2000 during this advancing phase indicates that RWM might be one of the better ETFs to use in the next down wave of the market. And our forecast is for another major decline once the S&P 500 and QQQ get back near their previous, as this April 13th article explained.
In our opinion the wide divergence in the performance of the major market indices during the seven month rally is a sign of general market weakness and added confirmation of our forecast.
However, activity by money managers and dealers in the Russell 2000 futures market suggests it's too soon to expect another major declining wave to start now. We think the earliest another decline wave can begin is about three months.
We’ll now present the evidence that led to these forecasts and conclusions.
What happens to RWM depends on what happens to IWM
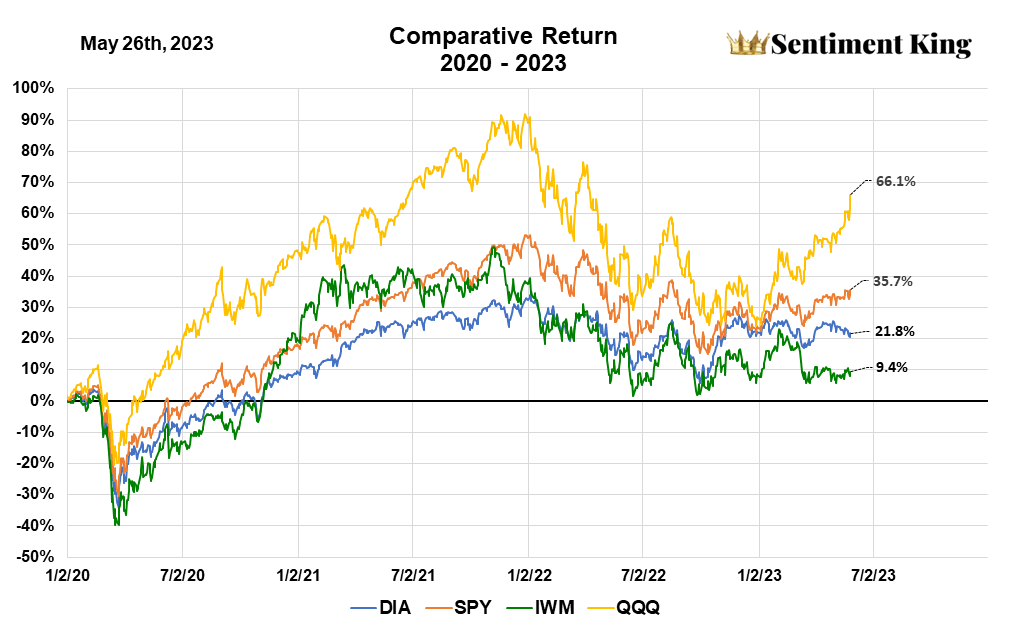
In our work we use index ETFs as proxies for an index. Since RWM is short the Russell 2000, we use IWM as a proxy for the Russell 2000. The following chart compares the performance of the four basic indices – the Dow Jones Industrials, the S&P 500, the NASDAQ 100, and the Russell 2000 - since January 2020.
Comparative Return of the Major Market Indices (Sentiment King)
As you can see IWM has the worst performance of the four major indices. It’s the green line and it's up only 9.4% after 3½ years. The top performing index, shown by the yellow line, is the QQQ, which has a gain of 66.1% over the same time period.
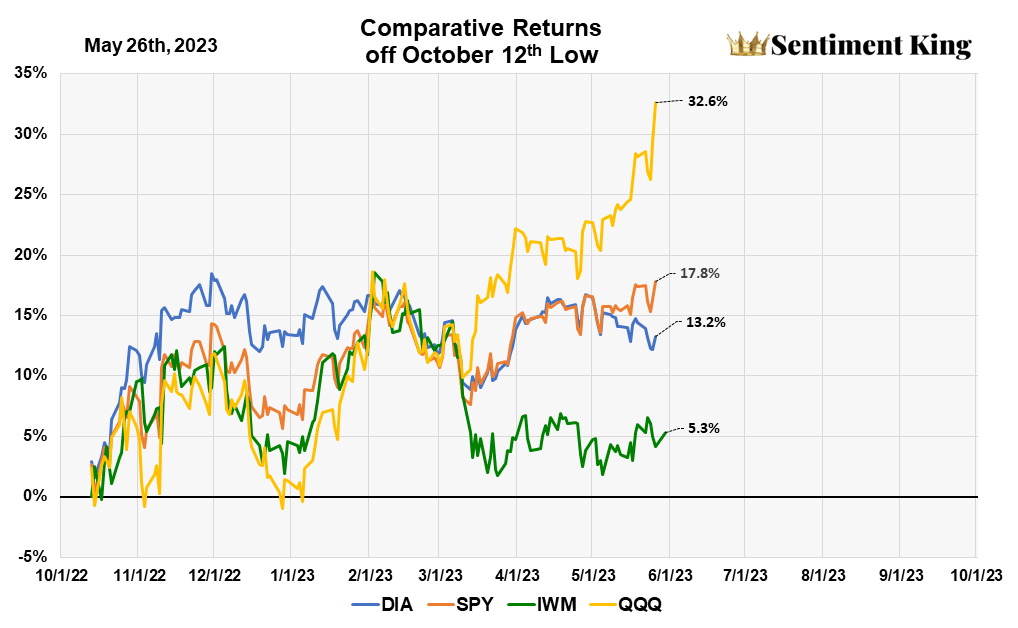
We find the same relative underperformance of IWM over last seven months, i.e. since the start of the October rally. This is seen in the next chart.
Shorter Term Comparison of the Major Market Indices (Sentiment King)
The IWM is up 5.3%, while DIA is up 13.2%, the SPY up 17.8% and QQQ up 32.6%.
These two charts tell us that the Russell 2000 ( IWM ) has been the weakest of the major indices, especially during the seven month rally. This means the inverse Russell 2000 ( RWM ) has been the strongest of the corresponding inverse ETFs.
We expect this to continue and for RWM to outperform the inverse ETFs of the other major indices if the market has another major decline.
Activity by money managers and dealers suggest it’s too early for another decline in Russell 2000
The next two graphs show the short and long positions of money managers and dealers in the Russell 2000 futures.
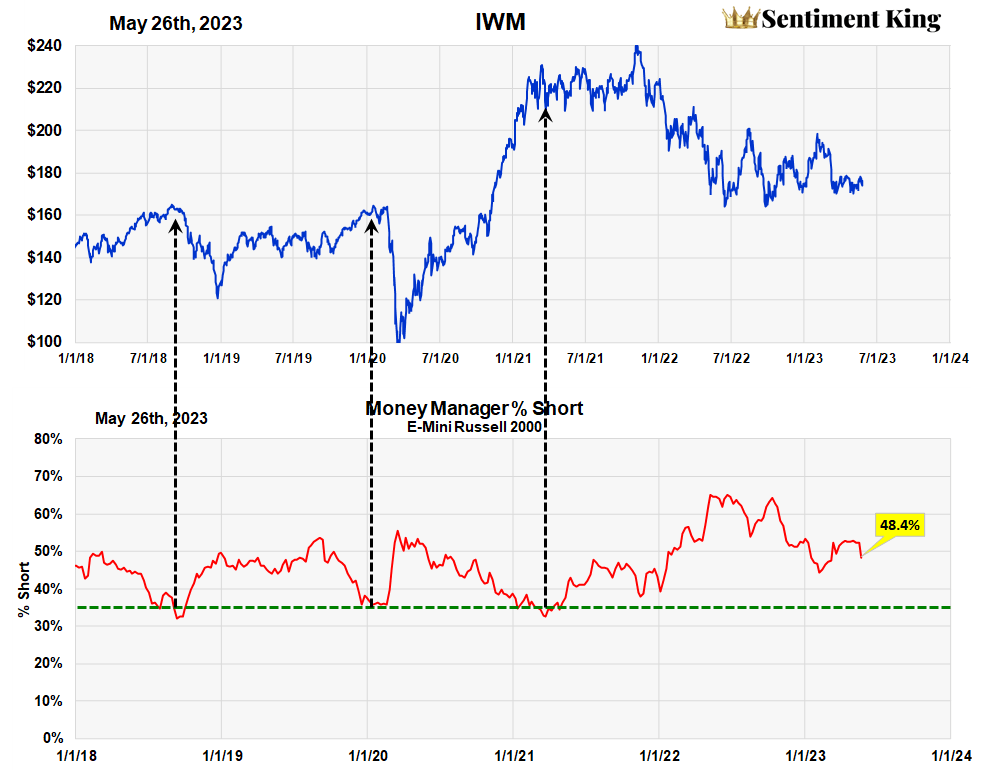
Money Manager Short Position of E-mini Russell 2000 (Sentiment King)
This chart shows the short positions of money managers. It's a contrary opinion indicator. They usually have a high short percentage at market lows and a low percent at market highs. One should not expect a market decline in the Russell 2000 if money managers have a high short position, and a ratio of 48.4% is relatively high.
We don’t expect another major decline until the money manager short ratio at least gets to 35%, which is indicated by the dashed green line. We’ve pointed to past moments when this occurred with black dashed arrows.
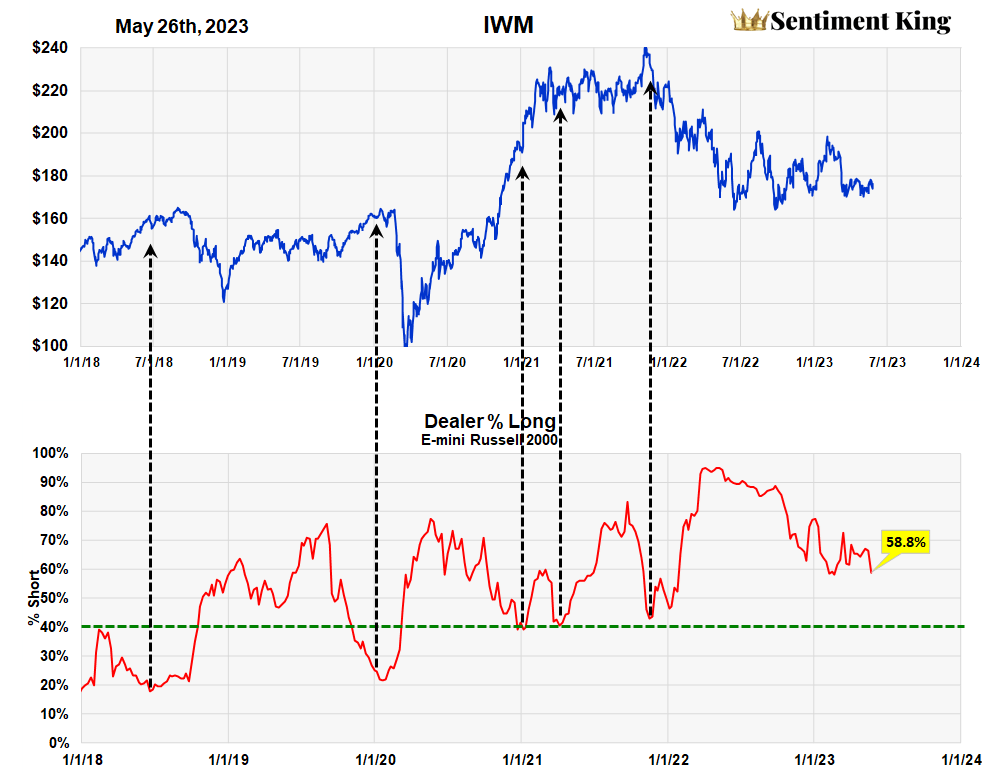
Dealer Long Position of the E-mini Russell 2000 (Sentiment King)
This chart shows the percent that dealers are long the Russell 2000. This is not a contrary opinion indicator as history shows dealer positions are normally right. They're heavily long the market at the bottom and less so at the top.
Right now dealers are 58.8% long the market. This is relatively high and we don't expect a decline in IWM to occur until dealer long positions drop below 40%, which is indicated by the dashed green line.
These two indicators suggest that if another decline in IWM is coming, it’s currently too early for it to start.
What's happening inside RWM?
Low buying activity in RWM is opening the door for another wave down in the fund
The following two charts show that investor buying in RWM is extremely low. Low buying in a short fund usually occurs before you get a decline in the index and a rise in the fund.
Avg. Daily Buying of RWM (Sentiment King)
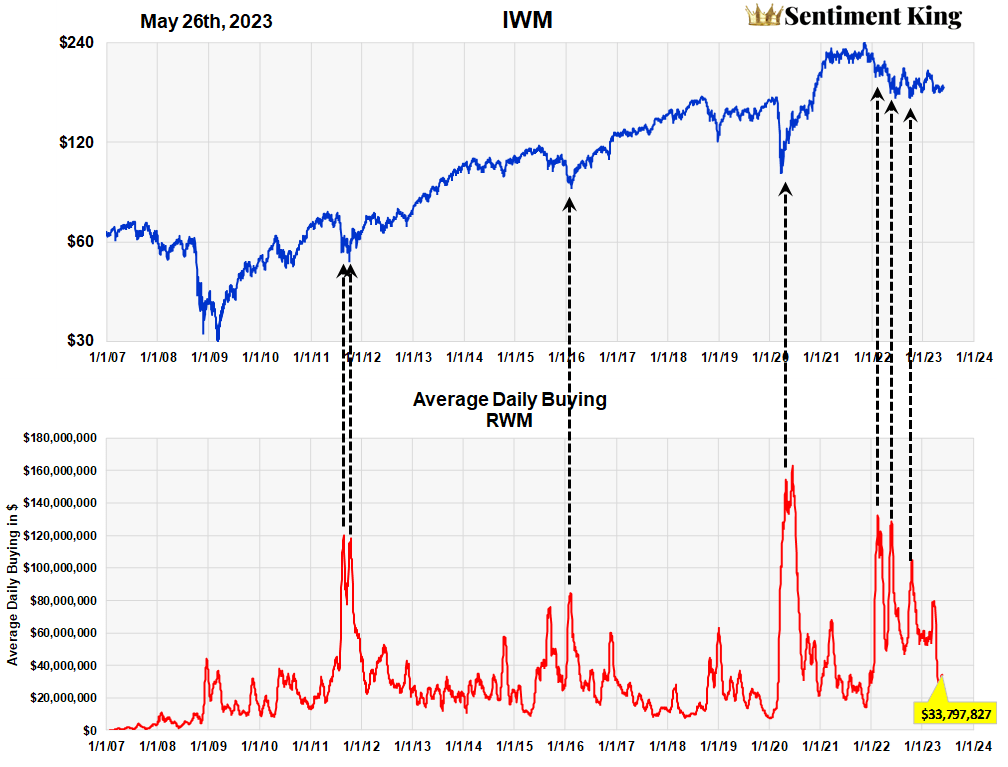
The chart above shows the amount of daily buying in RWM since inception. We've indicated with arrows that heavy buying interest almost always occurs at the very low of the Russell 2000. Contrarily, low levels of buying occur at tops before a decline.
Currently, about $33 million a day is going into RWM, which you can see is approaching the levels saying before prior declines. This buying situation is easier to see in the next chart, which compares buying against AUM.
Avg. Daily Buying of RWM as Percent of AUM (Sentiment King)
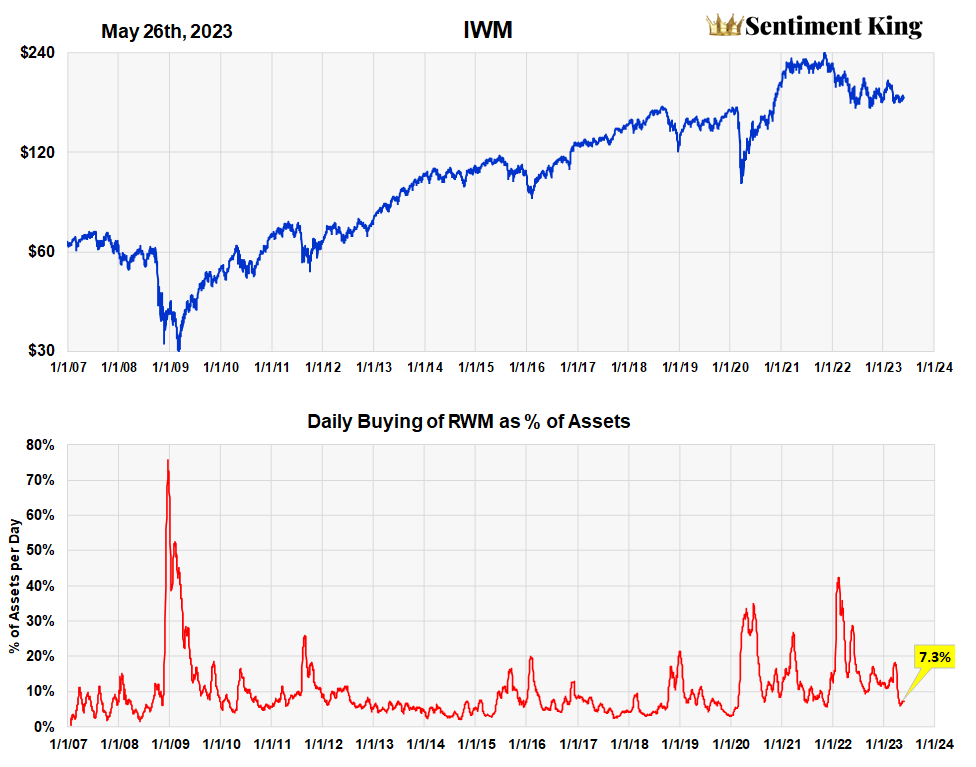
The chart above shows the amount of daily buying as a percent of AUM. Lows in the Russell 2000 usually occur when buying reaches over 20% of assets. The current ratio is 7.3. and is low enough to open the door for the start of another decline.
This is important because we want to be consistent in our beliefs about investor sentiment. What we are saying is that investor activity in RWM is not high enough to preclude another decline in the market according to our beliefs. However, this doesn’t indicate the timing of a decline, which we are leaving to other indicators.
RWM price forecast
NAV of RWM Since Inception (Sentiment King)
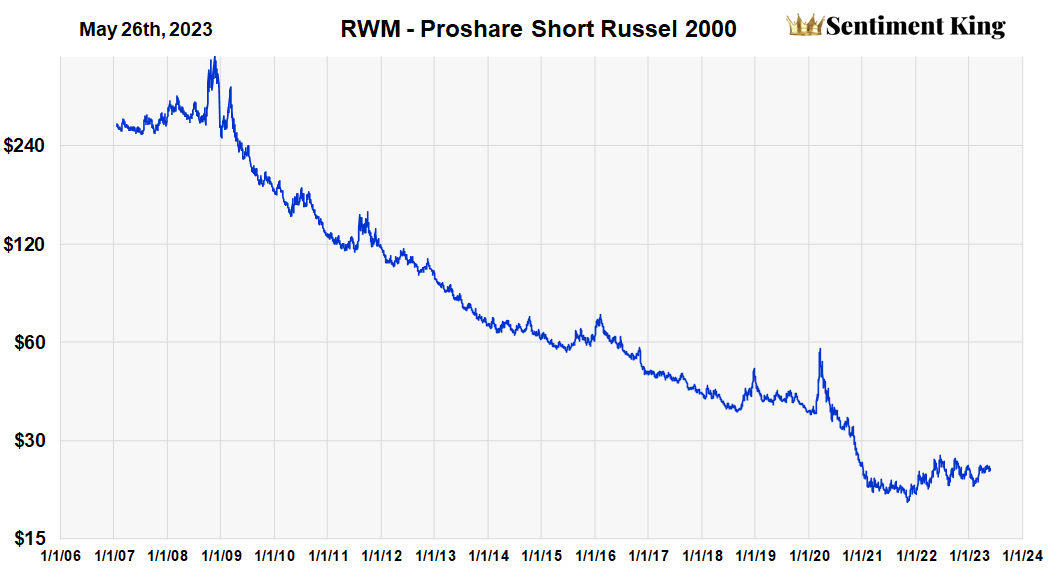
This chart shows the long, downward price history of RWM since inception. It highlights the difficulties of trying to make money by shorting the market. One can only make meaningful profits shorting the market over relatively short time periods and with good market timing. The difficulties of shorting stem from the established fact that the market rises 2/3 of the time and only declines 1/3.
The chart below graphs the price of RWM from 2020 to present. It shows the big price decline in RWM that occurred during the massive COVID rally that started in April of 2020. It also shows the price increase that occurred during the first wave down of the 2022 bear market.
Yearly Price Forecast of RWM In Graphic Form (Sentiment King)
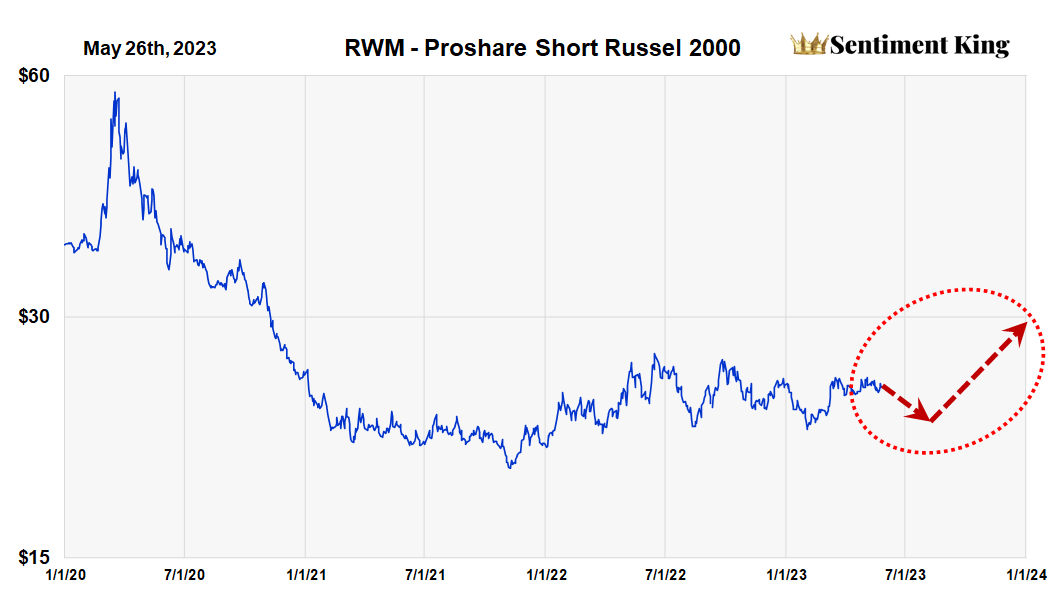
We've highlighted in red what we think will happen price wise for the rest of the year.
We expect the price of RWM to decline slightly over the next few months as the current market rally continues. Then we expect RWM to begin to rise sometime later this summer starting with a second wave down to the bear market.
This projection fits with our general market forecast in the April article. We think the relative weakness of the Russell 2000 suggests it will be a good vehicle to participate in another declining wave of the market. It will require patience by current holders, however.
For further details see:
RWM And The Next Market Decline