IWM - RYLD: Imaginary Yield Falls Short Again Updating Our Trade
2023-07-18 07:52:06 ET
Summary
- Russell 2000 index has been a good place to harvest volatility over the last 3 years.
- RYLD has tried to capitalize on that, but blind option selling is always problematic.
- We review the performance since the last article and update our trade.
On our last coverage of Global X Russell 2000 Covered Call ETF (RYLD) we dropped some hard truths on the yield chasing exercise. We concluded with our suggestion that the covered call we recommended on iShares Russell 2000 ETF (IWM) would handily beat RYLD.
We also stand by our earlier prediction that RYLD will struggle to make more than 5% in total returns. So locking in that yield one year out looks like a good bet. We will check back on this in due course and see which yield did better.
Source: Ignore The Imaginary 12% Yield And Consider This 12% Instead
We review the ETF's performance and update our relative outlook for our trade vs the ETF.
The Fund
RYLD runs on a "covered call" or "buy-write" strategy. The underlying index is the Russell 2000 Index. RYLD seeks to mimic returns that correspond to the CBOE Russell 2000 Buy Write Index. The fund has been a favorite among yield seeking investors as many have equated the income produced as "free-money". Unfortunately, the truth is far different.
Returns Since Our Last Article
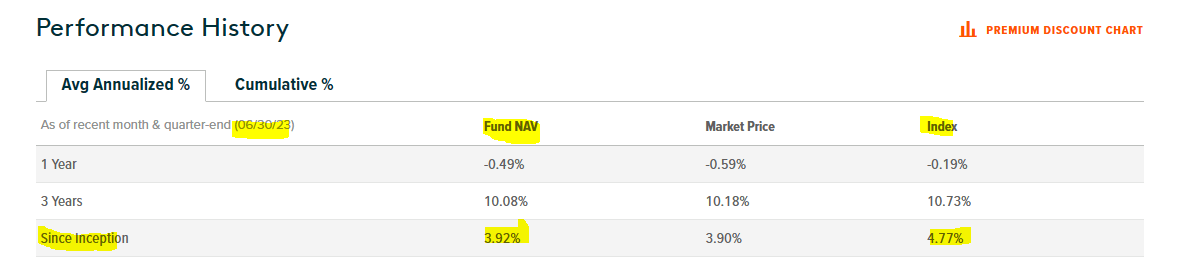
It has been about 6 months since we wrote on RYLD and it managed to underperform our extremely modest expectations by a mile. Total returns barely made it over the flatline. So you got income, but lost almost the same amount in principle.
Seeking Alpha
Since inception the fund has delivered less than 4% annually. Note the data is till June 30, 2023.
The fund started in April 2019 so the data covers about 4.25 years. How were the returns produced? By generating a large "income" offset by a 26.69% price drop.
How This Impacts You
If RYLD NAV was $0.00 it would not be able to generate a single cent of option premium. If RYLD NAV doubled today, it would generate twice as much option income, all other things remaining equal. This would hold true on a per share basis even if RYLD suddenly did a 1:2 reverse split. No one would find anything wrong with those three statements. Those are facts. But somehow investors tend to miss that a gently falling NAV will erode their income over time.
One reason this happens is that when the markets decline suddenly, volatility tends to rise. That means that temporarily, RYLD can generate more option premium per dollar of NAV. That fools the crowd into thinking, "hey, this is a very predictable income stream."
Outlook
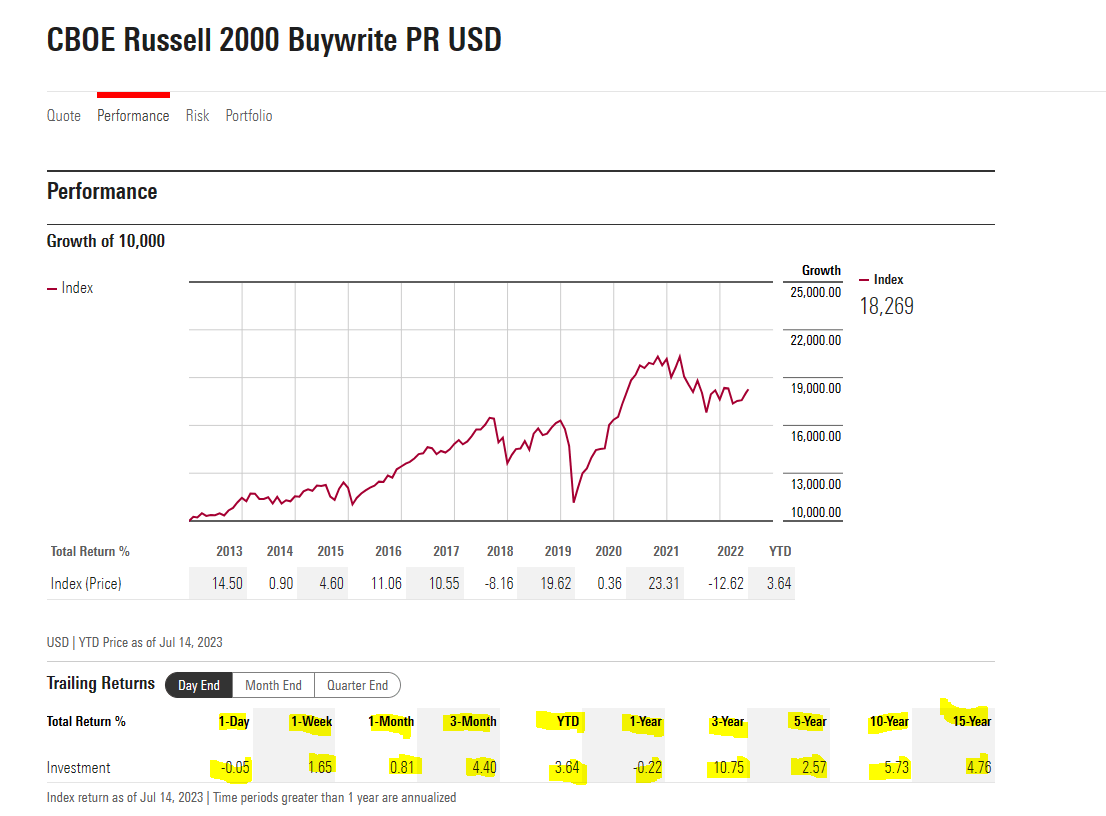
CBOE Buy-Write Russell Index data is a lovely splash of cold water on the face. Over the 10 different data periods shown , only one comes close to a double digit return profile.
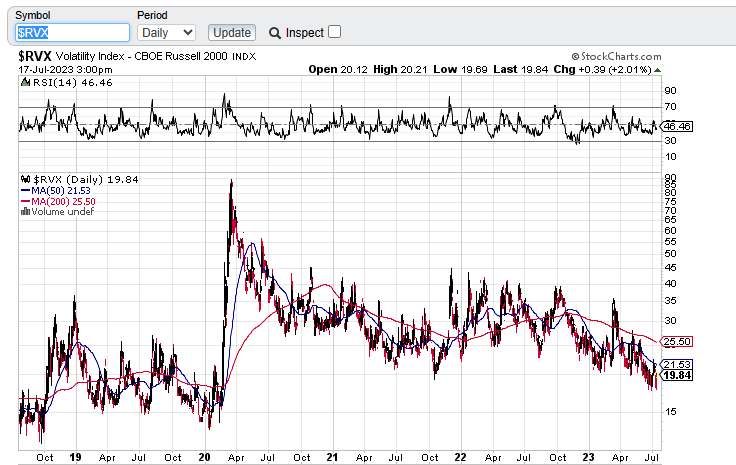
That was because that 3-year period coincided with residual recovery from COVID-19 lows, extremely high volatility and unparalleled stimulus. 15 year numbers are likely to most representative of what happens from here on out. We will add that Russell Volatility index looks dead in the water.
Stock Charts, Russell Volatility Index
So we would look for 5% annual returns from here and that is despite RYLD missing this target for the first 6 months of this year.
Trade Update
On our last article, we recommended the longer dated covered calls for IWM as an alternative to buying RYLD. Specifically, we suggested that the Buy-Write for the $190 strikes would outperform RYLD.
Author's App, Pic From Last Article
As we write this, the prices are as follows.
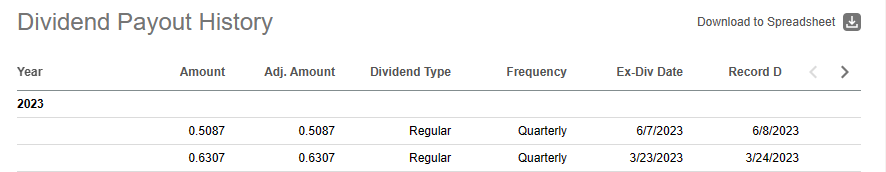
So you would have a $665 gain on the 100 shares ($19,396 minus $18,731). You would also have a $275 gain on the option ($1,740 minus $1,465). So your effective return was $940. IWM also doled out two small dividends.
That would push your total returns for 100 shares to $1,054. This works out to 5.63% in about 6 months. This actually beat, RYLD by about 5.5% and even buying IWM directly by a small margin. You would not have the option gain on buying just IWM. Longer term call selling can provide solid income while reducing volatility and forcing buy-ins at higher prices. While this is just one example and it could have gone the other way, we have a lot of personal data to back this up. At present we would wrap up the trade as we see lots of signs of extreme complacency and we would not want to be holding even covered calls at the index level before a pullback materializes.
Verdict
RYLD will get some bullish press as it does continue its distributions. But 15 years of data does not lie. Small cap indices are cheaper today relative to their larger cap brethren, but they are also likely to feel far more stress as delayed effects from Fed tightening are felt. The area offers some compelling value plays, but buying RYLD is the last way we would play it. Unless you are happy with 5% annual returns. In which case, it looks fine.
Please note that this is not financial advice. It may seem like it, sound like it, but surprisingly, it is not. Investors are expected to do their own due diligence and consult with a professional who knows their objectives and constraints.
For further details see:
RYLD: Imaginary Yield Falls Short Again, Updating Our Trade