AFMC - S&P 500: Bear Trap - Week Starting March 6th (Technical Analysis)
2023-03-06 01:58:38 ET
Summary
- The S&P 500 reversed strongly higher this week as the break of the 200dma failed and yields pulled back.
- What to watch in the S&P 500 in the week ahead.
- Key technical levels and probable outcomes.
The S&P 500 ( SPY) reversed sharply higher after Thursday's bear trap. This was a move driven by positioning, technicals and sentiment rather than any significant change in the narrative. So, will the 3928 low now hold?
In an attempt to answer that, a variety of technical analysis techniques will be used to look at probable moves for the S&P 500 in the week ahead. The S&P 500 chart will be analyzed on monthly, weekly, and daily timeframes, then the information collated into an actionable summary at the end with both bear and bull scenarios guided by inflection points.
The Market Narrative
With data on the light side this week, there was no real change to the narrative and 'higher for longer' rate expectations continued to be the main focus. Yields marched higher and the 2-year yield reached 4.94%, just shy of the big 5% level, while the 10-year broke through 4% to 4.09%. Shorter-term yields made lower highs and mainly consolidated.
There was a notable reversal in longer-term yields on Thursday / Friday which could signal the recent re-pricing has run its course, at least in relation to the current data. Next week will be important as NFP and JOLTS Job Openings will show us if January was a one-off and February activity cooled. Fed Chair Powell is also due to give his Semiannual Monetary Report to Congress and could give us some insight into the Fed's view of recent data. Volatility looks set to continue.
S&P 500 Monthly
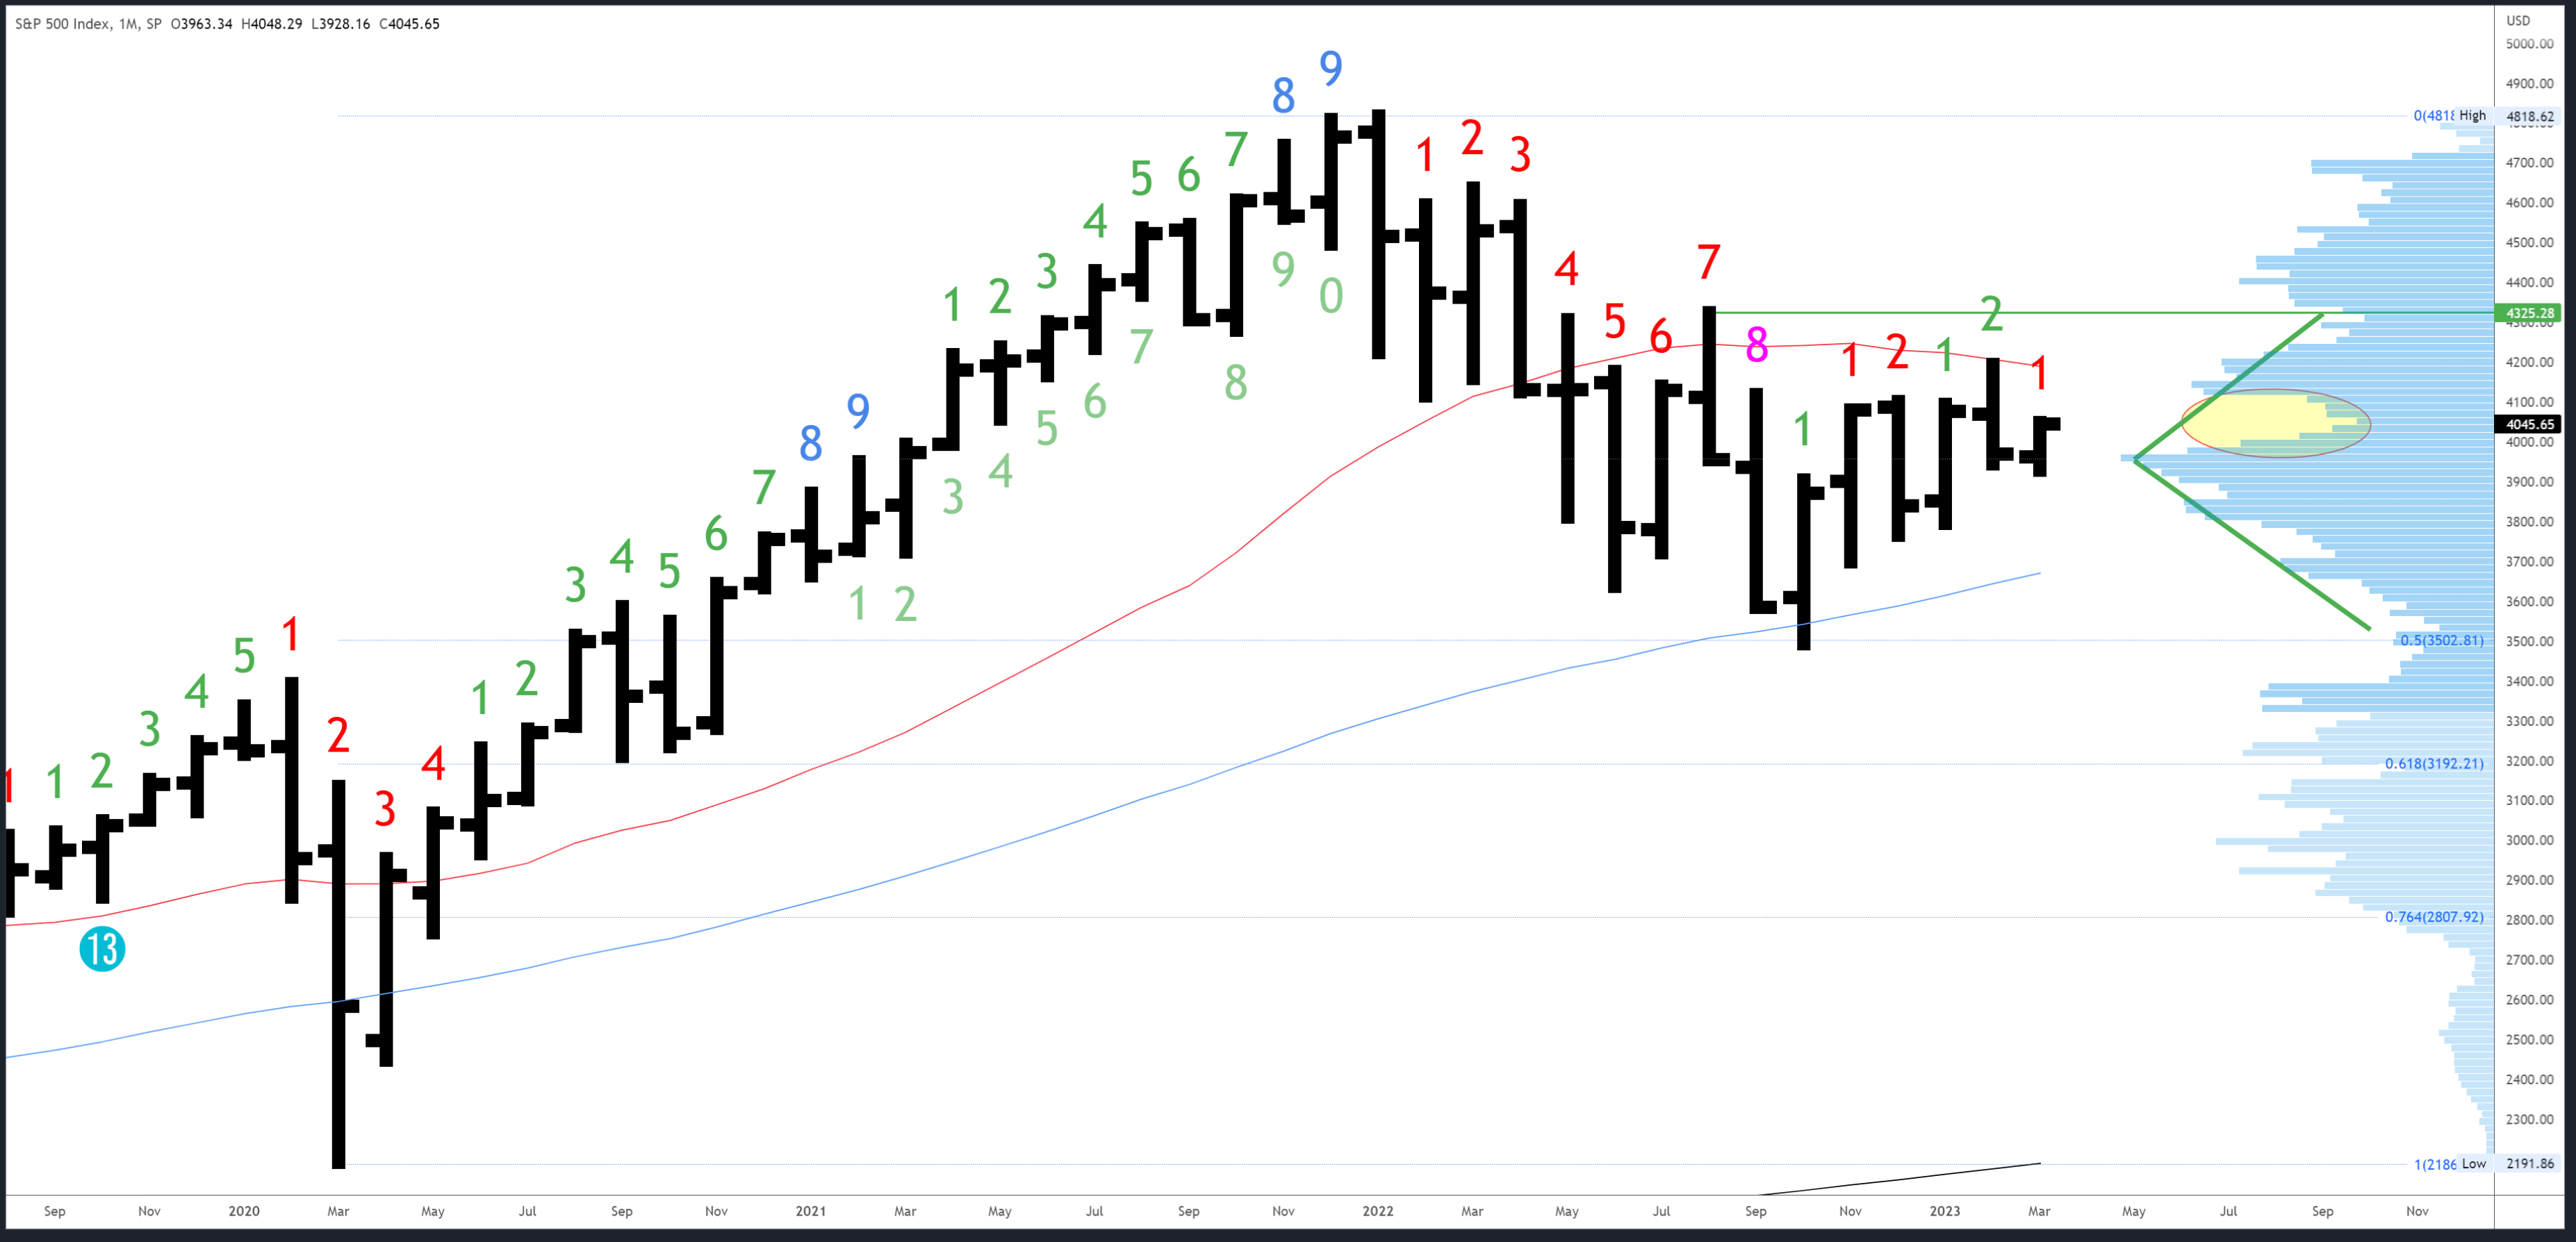
February's bar closed on Tuesday at 3970. This was a weak close near the lows of the month and created a reversal bar with the initial attempt to break above the January highs rejected from the 20MA at 4195. Notably, the US dollar ( DXY ) did the exact opposite from its 20MA. These higher timeframe reversals support the view that a large move could have started.
The 4195 high and the 20MA (now slightly lower at 4189) remain the first major resistance levels, followed by 4325 at the high of August.
A look at the volume profile to the right of the chart shows a low volume node centered around 4050-60. This could act as resistance on an initial test, but is likely to be 'filled in' with trading in the 4050-4100 range over the course of March.
The March bar already made a new low of 3928 below the February low of 3970 and recovered back above. This shows rejection of lower prices and so 3928 is now support. Below 3928, the next references are 3794 at the January lows, with the 50MA a distant 3670.
There are no exhaustion signals in either direction (using Demark methods), although downside exhaustion was very nearly registered in October, so we can say this is being reset with the move from that low.
S&P 500 Weekly
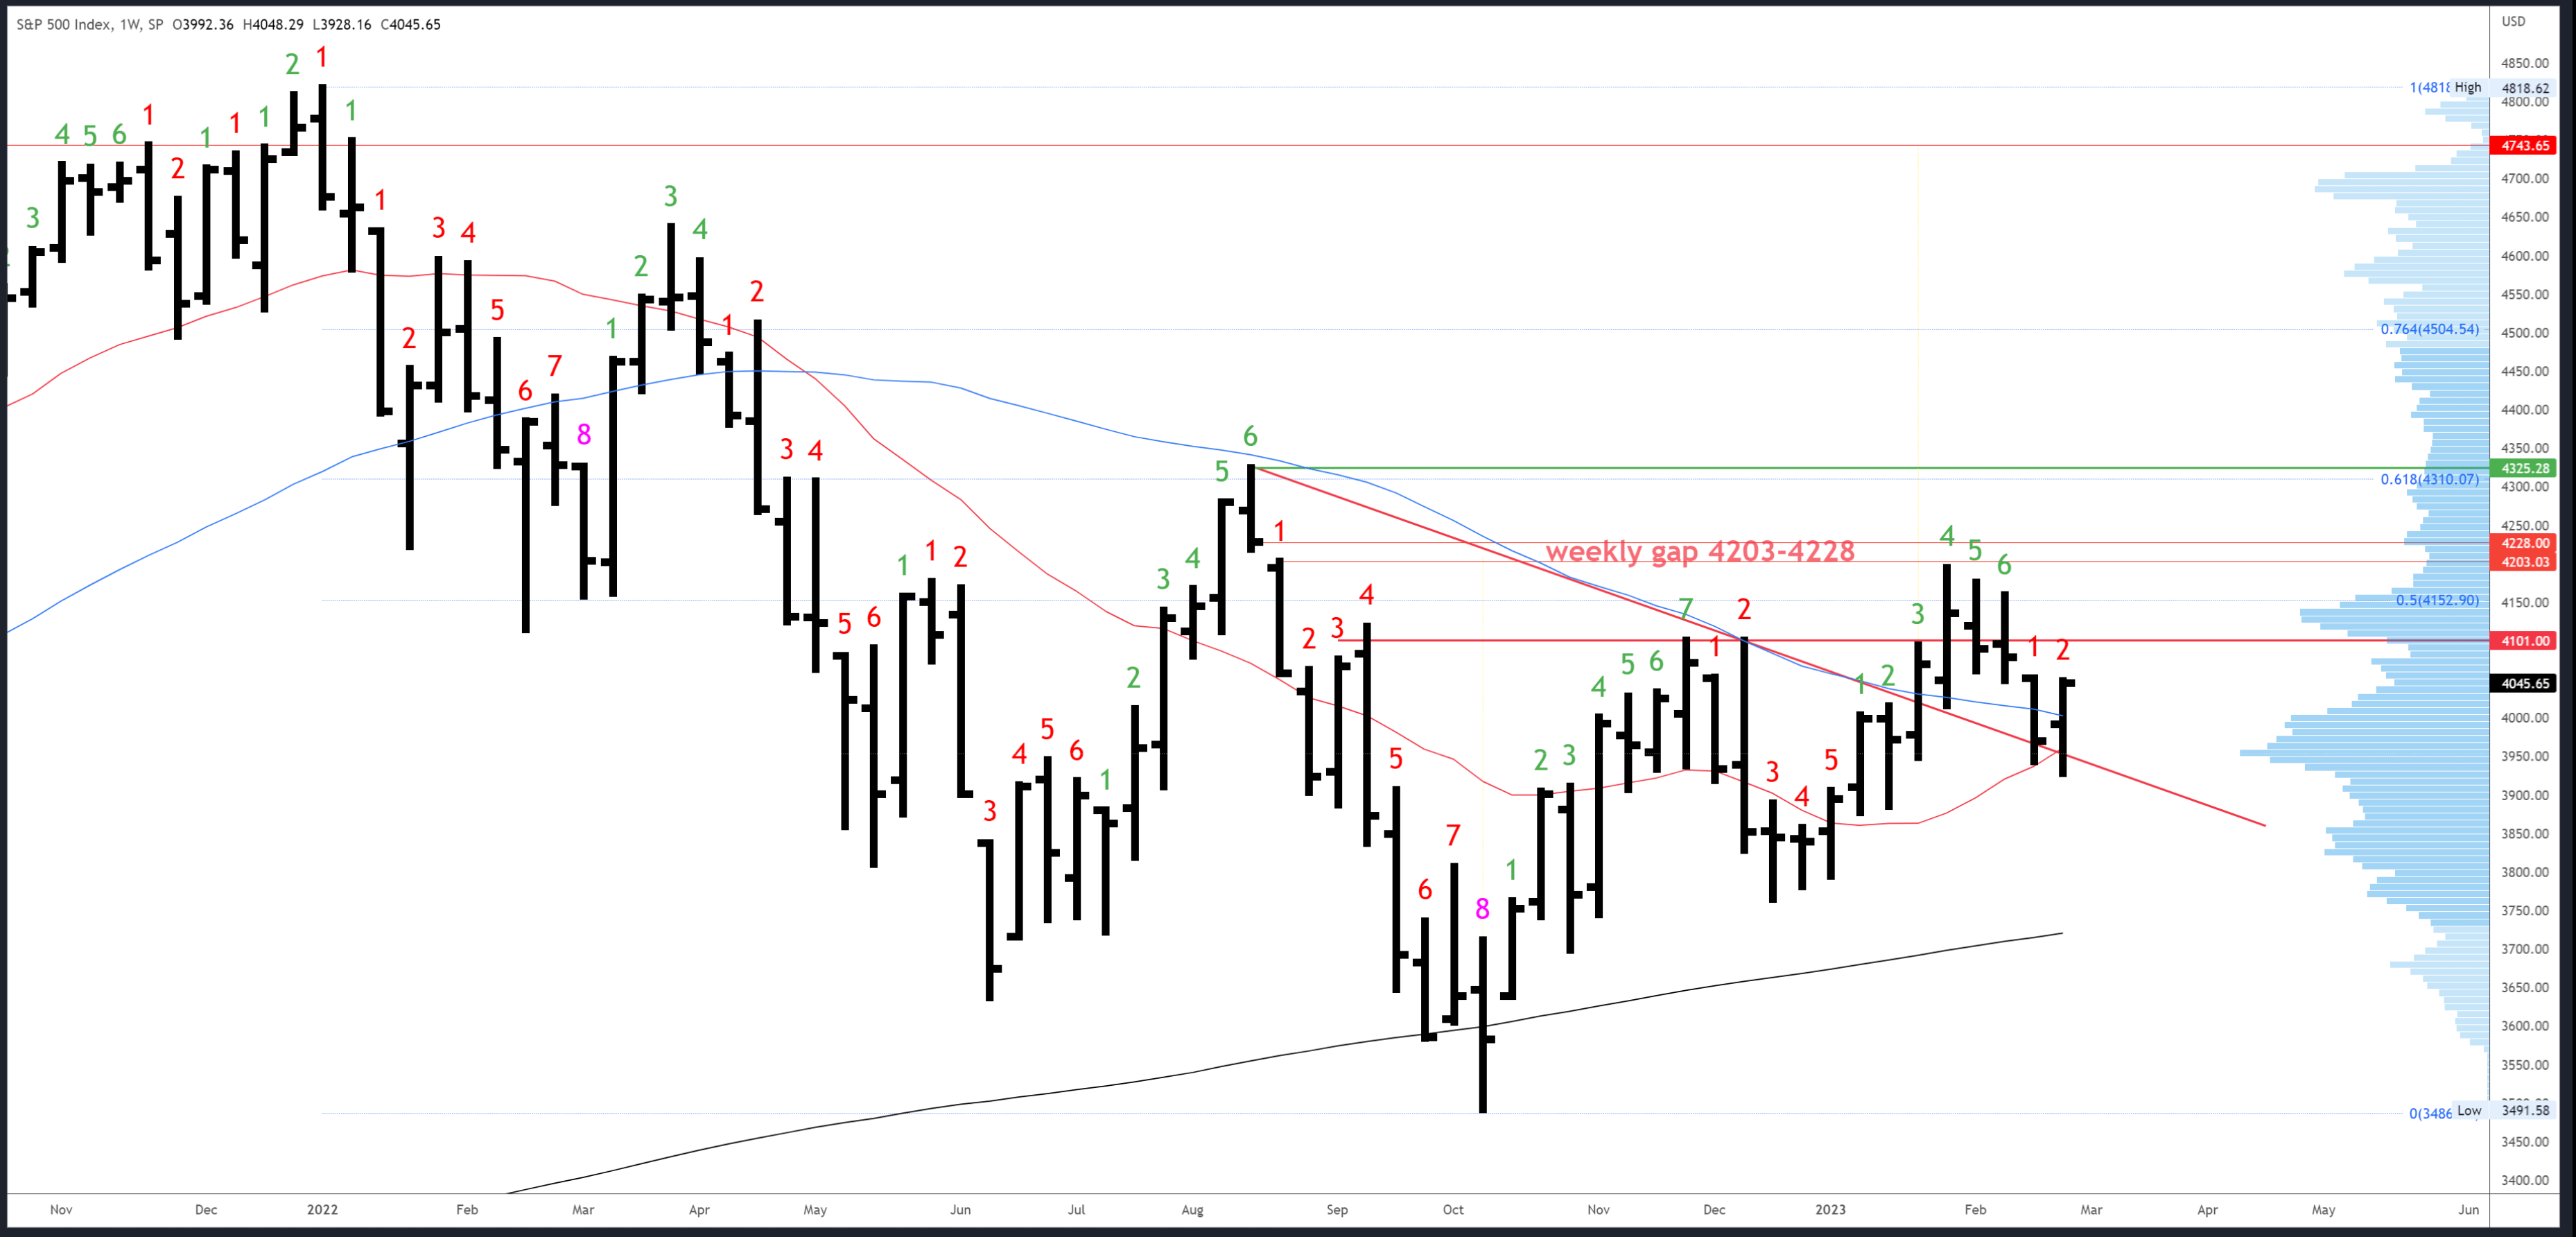
Last weekend's article pointed out the lack of a reversal on the weekly bar. With a further low this week under 3943 and a clear rejection, this week's bar has rectified the situation. Moreover, the close was well above the 20MA and trendline re-test at 3954 needed to keep the bullish look. The strong close near the highs of the week suggests a further high over this week's 4048 high should come early next week, although this could be marginal and fade again.
Resistance is at 4052 and the previous week's high / gap window, then 4101 followed by 4195/4203.
All good supports in this area have been tested and this week's low of 3928 is key support. A break of this level would bring the January low of 3794 and the 200MA at 3725 as the next references.
The upside exhaustion count failed (which itself is a bearish sign) and a downside count will be on bar 3 (of a possible 9) next week.
S&P 500 Daily
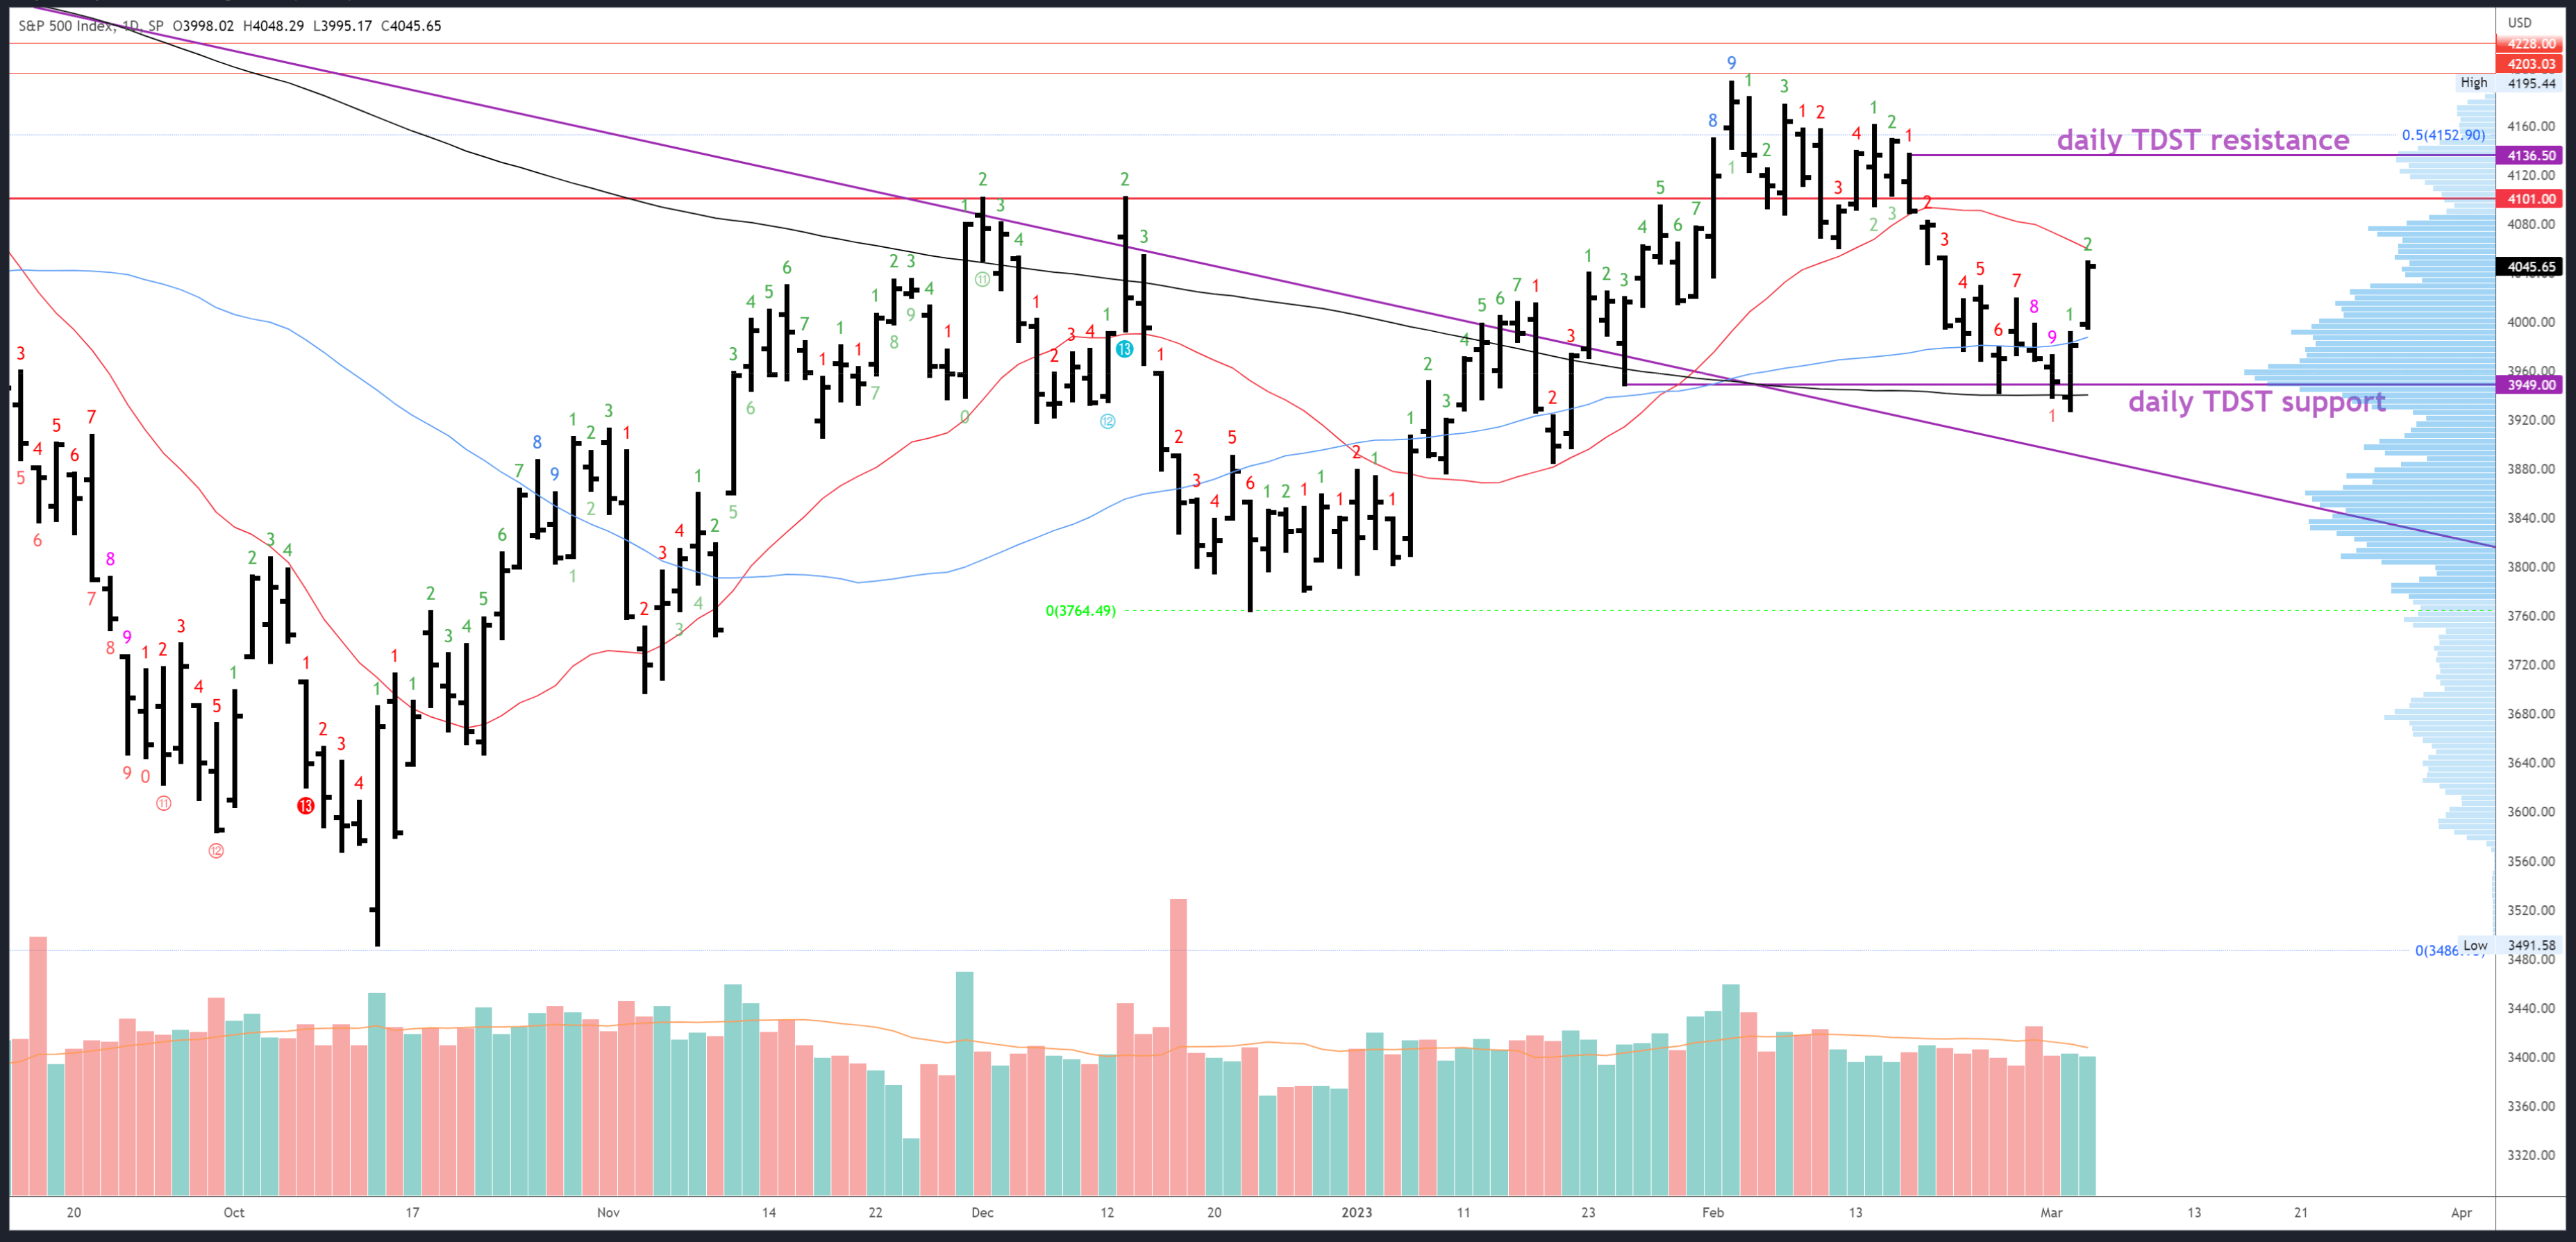
3940-50 is a huge cluster of support and a rather obvious one (it has been mentioned in my last four weekend articles). The 200dma at 3940 is perhaps the most watched technical indicator of them all. Did the market make a clean and easy test of this obvious support and then rally? Of course not...
Last Friday's (24th February) reversal missed the 200dma by 3 points and then rallied nearly 2%, sucking in some late bulls before declining again. Wednesday's session then bottomed at the 200dma and closed above only to flush lower after the close. Thursday's session was the bear trap with a gap below, a drop to suck in shorts, then a sharp reversal higher again. This was actually a good set-up for longs as when price recovered from 3928 back over 3940-43, it signaled a failed breakdown. Additionally, downside exhaustion (Demark) completed on Wednesday so we already suspected sellers would run out of ammo.
Friday's strong close suggests continuation early next week, but the 20dma will be around 4053 on Monday and declining each session. This lines up with the weekly gap at 4052 and we should see a reaction lower from this area. Indeed, we could see a mini bull trap as higher prices on Monday/Tuesday will draw in late FOMO bulls right at resistance. 4101 and 4136 are the next major resistance levels should the 4050s break (likely later in the week following a dip).
Various potential minor supports were created during last week's rally and it's hard to say exactly where a retrace should target before it has even started (once it is underway there are techniques to help fine tune targets). Friday's 3995 low and 3981 are decent spots, and if bulls are really strong they might even defend 4018.
As mentioned earlier, a downside exhaustion count completed on Wednesday. This complements the upside exhaustion registered on the day of the 4195 high and shows how effective this Demark indicator can be. No exhaustion signals are possible next week.
Scenarios for Next Week
Bullish
A solid low has been made at 3928. While it looks like the first leg of the recovery rally could run into some resistance around 4053, a dip could hold 3995, even 4018 to set up a further proportional leg up to target 4101 and 4136. Bulls will hope Chair Powell views recent strong data as potentially 'transitory' (although he'll want to avoid that term given its history) during his testimony and that NFP on Friday comes in soft.
Bearish
Downside exhaustion will be reset next week and the bears can regroup after this week's mauling. There is a higher timeframe reversal in place at 4195 and any rally could therefore unfold as correctional to set up further declines. While the 3928 low is likely to hold next week, defending resistance at 4101 and 4136 would set up a later break-down, this time for real.
Conclusion
The S&P 500 reversed strongly from a bear trap under the 200dma and we can say the 4195-3928 is a complete sequence lower that is now being retraced. Next week's action could bring an early dip from the 4050s followed by a further rally, but several key events are likely to either support or contradict the 'higher for longer' theme and will influence the extent of the moves. 4136 likely caps the upside.
For further details see:
S&P 500: Bear Trap - Week Starting March 6th (Technical Analysis)