QQQ - S&P 500 Criteria For A Continuation Rally Into 2024 (Technical Analysis)
2023-12-08 09:21:17 ET
Summary
- The S&P 500 E-mini Futures contract has rallied 12% since October 27, leaving many questioning if this is a bear market rally or the low point.
- Elliott Wave practitioners have different views on the market's direction, with some suggesting a sustainable low and a potential move to higher levels.
- The current support levels to watch are 4501.75 and 4354.25, and further price clues are needed to determine the most likely scenario.
From a technical analysis perspective, the S&P 500 ( SP500 , SPX ) and other U.S. indices are nearing a clear crossroads between a bullish case in 2024 vs. a bearish one. In this article, I will discuss both and suggest several anecdotes readers can follow to distinguish between these two alternatives. If you are bullish, the train has not nearly left the station, and there will be better opportunities to allocate capital long. If you are bearish, front-running may prove painful in the short term.
In this article, I will focus solely on the SPX levels as reflected by the S&P 500 E-mini Futures contract.
Many Elliott Wave practitioners have viewed the move down into the October 2022 low as an A wave of an ongoing ABC correction, and therefore throughout most of 2023 have viewed the rally off the October 2022 low as a B wave, with a C wave to lower as the next logical directional move. For much of the year, this has been my own view as well. However, this latest rally off the October 27th, 2023, low has to be taken seriously from an overall market view and brings with it the idea of - 1. The 2022 low may now represent a sustainable low; and 2. Price may well take out the 2022 high before a meaningful price correction occurs.
In this article, I will review the two larger-picture views that I see as most likely, and as price provides further clues in the coming weeks and months, will post further articles that may assist in narrowing down which one is exerting itself and most likely.
One interesting anecdote worth noting is that the move down off the 2022 high can be viewed as a diagonal A wave, whereby after a corrective B wave, we should expect a swift and dastardly C wave down to occur that may or may not take out the 2022 low. Unfortunately, Elliott Wave diagonals can also be interpreted as a corrective WXY, which would suggest after completion a move back to the prior high is the initial leg of a new sustainable rally. This is where Mr. Market has held his cards close to his vest, leaving both interpretations as viable.
I'll start with the Bullish Case. See the Bullish Daily Chart below of the S&P 500 ES E-mini Futures Contract:
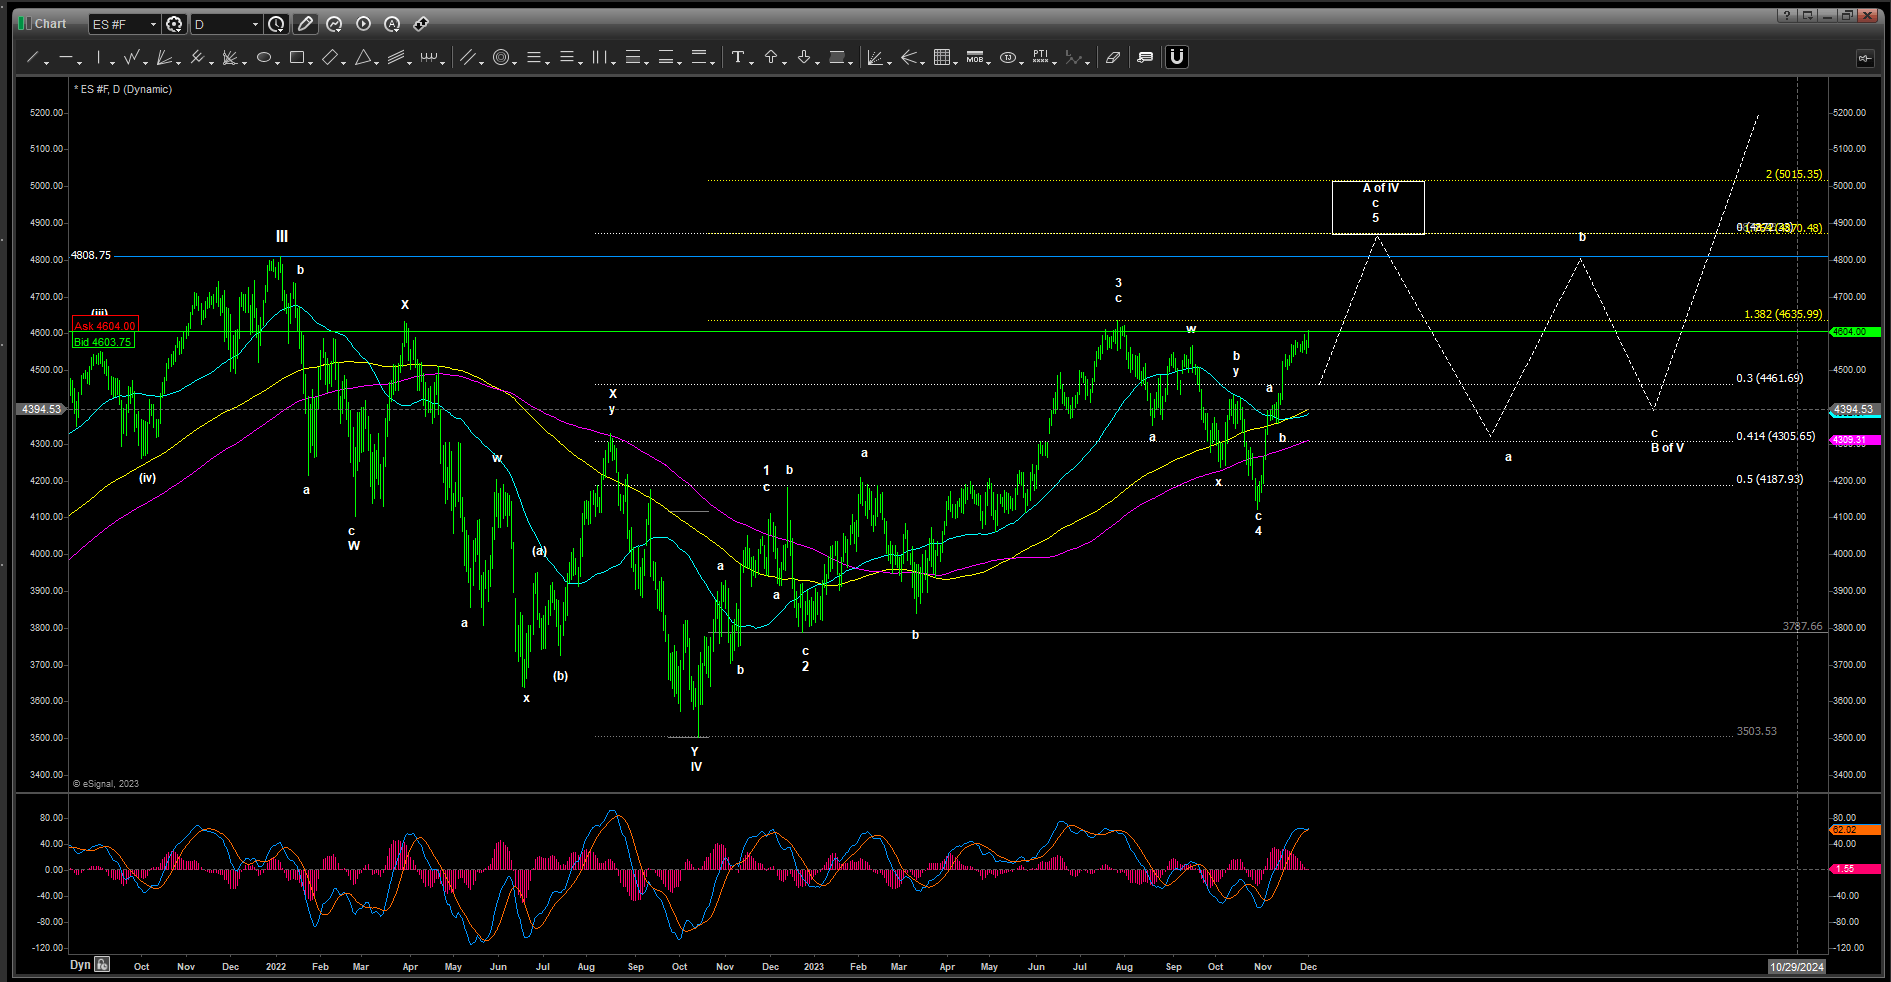
ES Daily Bullish Chart (Author)
In the Bullish Case, SPX topped in a wave III at the 2022 high, then provided a corrective WXY wave IV into the October 2022 low, and is now during forming a diagonal A wave of V. Elliott Wave diagonals consist of 5 3-wave moves, whereby each of waves 1, 3, and 5 consists of an abc. Targets for wave 3 most commonly target the Fibonacci 1.236 or 1.382 extensions of wave 1. Note that, in this case, SPX hit the 1.382 extension in picture-perfect fashion into the July 2023 high. Most often when a 3rd wave targets the 1.382 extension, it suggests at a 5th wave that targets the 1.764 or 2.0 extension, which levels are 4870 and 5015 respectively, and would represent the A wave of V leg up off the October 2022 low. Upon completion, the S&P 500 would provide a multi-week to month consolidation in a B wave if V before heading up to considerably higher levels. From a Cup and Handle perspective, the B of V would provide the handle, as can be clearly visible on the daily SPX chart above.
If the Bullish case is active, we should not expect large corrective price action to occur until the completion of the A wave, and thereafter should not expect corrections greater than 15-20% in the B wave.
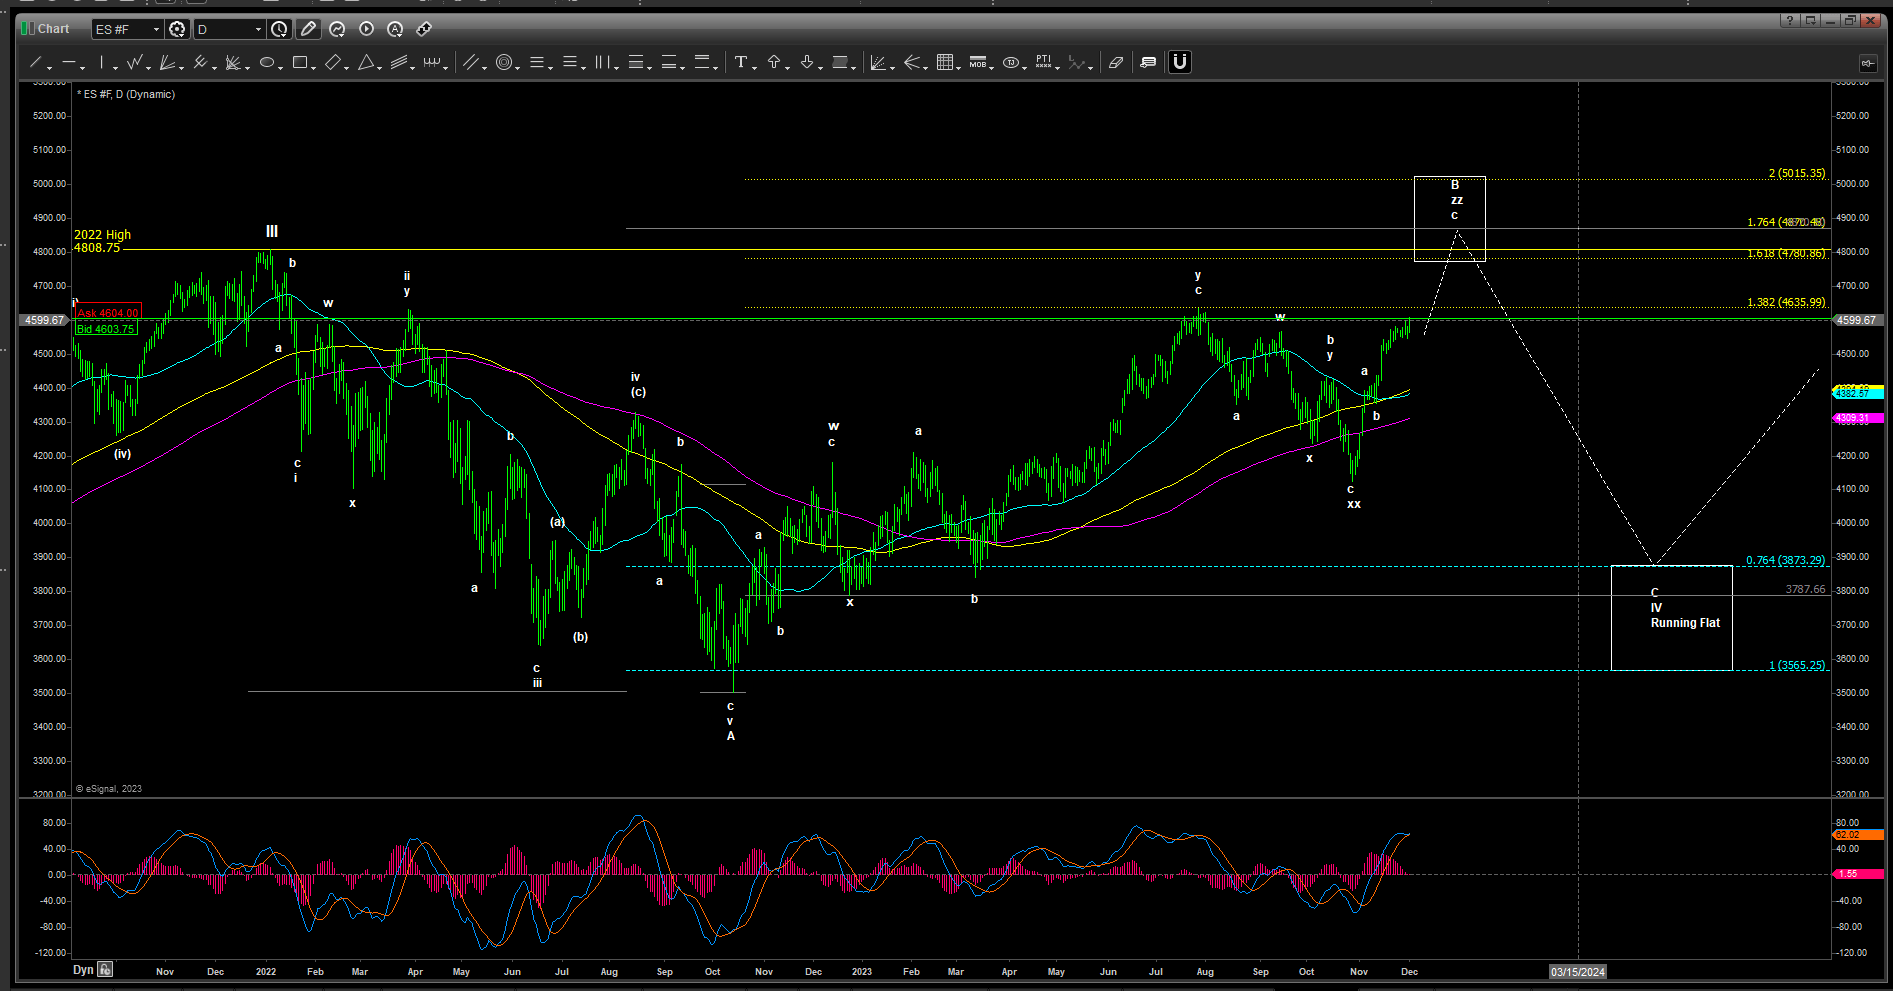
Now let's review the Bearish Case. See the Bearish Daily Chart below of the S&P 500 ES E-mini Futures Contract:
The Bearish case suggests that the move down from the 2022 high into the October 2022 low is a diagonal A wave. If this is correct, then upon completion of a B wave, we should reasonably expect a C wave down to follow. If the Bearish Case is occurring, then the rally off the October 2022 low best counts as a Triple Three Corrective B wave. A Triple Three is 3 abc moves vs a WXY which is two. If the entire correction is a wave IV, as the Bearish case suggests, then it can take on two forms - 1. A running flat; or 2. An expanded flat. In the case of a running flat, as I'm showing on the above Bearish case chart, upon completion of the B wave, SPX would revisit the lows made in October 2022 but would maintain a price level over those lows. In this case, after completion of the B wave high, price would target ~3900 to ~3560.
An expanded flat would suggest the price takes out the October 2022 low, and target considerably lower.
We will not be able to determine which price target is more likely until the B wave tops, and we can observe the initial leg down, which will provide better clues on whether a revisit of the October 2022 low is more likely, or a much larger C wave down is more likely.
Current Support
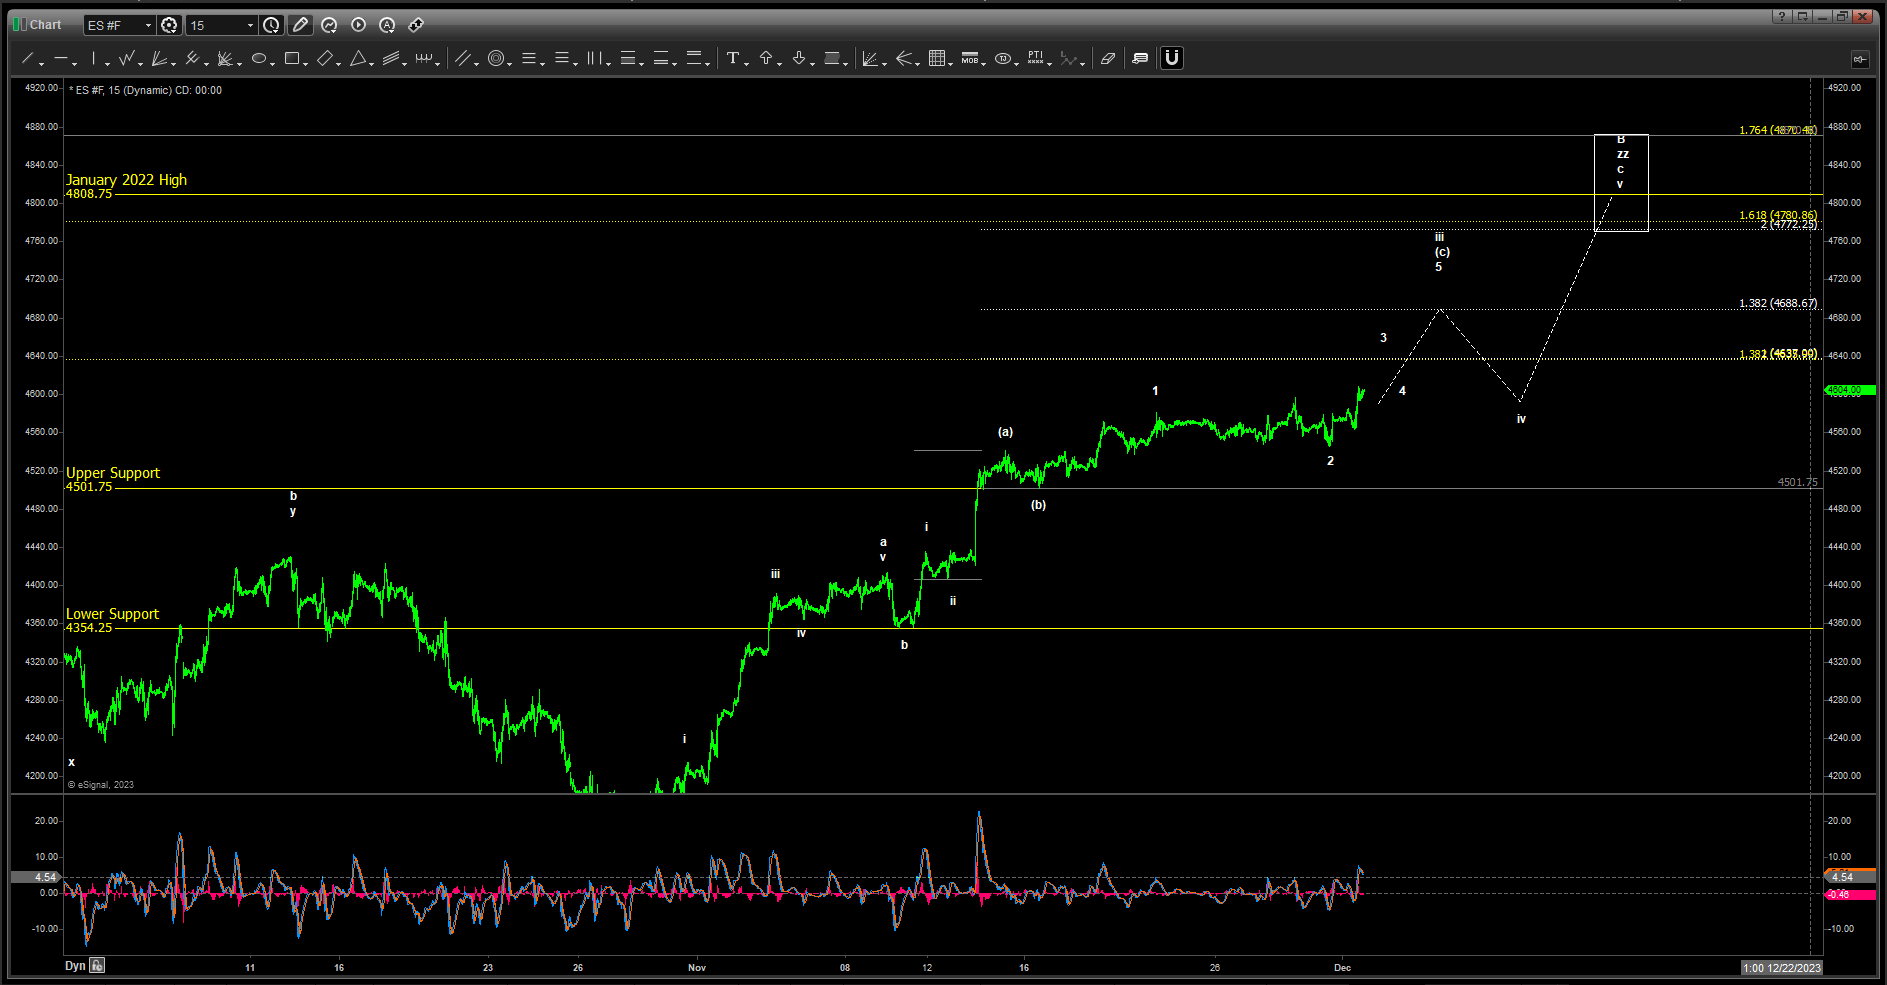
Please refer to the 15-minute E-mini SPX Futures contract chart below.
Note that SPX is approaching the 2022 high. The two levels of immediate support are Upper Support at 4501.75 and Lower Support at 4354.25. Provided price always remains over Lower Support, either of these two cases remains fully intact, and we should expect price to take out the 2022 high to the upside.
If price takes out Lower Support to the downside prior to taking out the 2022 high to the upside, I will revisit these two perspectives, and post an article with revisions to how I view the market at that time.
How to Distinguish between Bullish and Bearish
We will need further price clues to provide evidence of which scenario is most likely occurring. A few interesting observations I would make is that IF price does indeed take out the 2022 high and adheres to a Fibonacci 1.764 to 2.0 extension as I show in the bullish case, it begins to strongly favor the Bullish perspective. Some Elliott Wave practitioners might view this as a 5th wave up that failed to complete at the 2022 high. I personally would not and would view it as the initial leg of a final ABC move to higher as the most probable expectation.
What the Bearish case has going for it is historical price action. In all my analysis of prior corrections going back to the Great Depression, I cannot find a correction of magnitude like this Bearish Case suggests, whereby the B wave did not take out the prior high to the upside before ushering in a large C wave down. Said differently, it would be a rare instance for the B wave not to take out the prior high, or in this case the 2022 high. While this is still certainly possible, I don't view it as probable that price will commence a larger C wave down prior to increasing over the 2022 high. If price commences a large drop before overtaking the 2022 high and takes out Lower Support, I'll revise my overall view of what is occurring, and default to a completely different larger perspective.
Assuming price does take out the 2022 high to the upside, if it fails to achieve the 1.764 or 2.0 Fibonacci extensions, and reverses sharply, I'll view the Bearish Case as more likely. However, if price manages to continue into the target region shown on the Bullish Case, then I'll view the Bullish Case as more likely.
In both instances, after completion to the upside, I'll be monitoring the next pullback as critical in determining which of these two scenarios is most likely, and will post additional articles here on Seeking Alpha with my thoughts.
Concluding Remarks
If SPX remains over Lower Support and continues to rise, I will view the likelihood of taking out the 2022 high as VERY probable. In either the Bullish or Bearish Case, once the 2022 high is taken out to the upside, we should expect some reasonable correction back to levels below current levels. In the Bullish Case, the train has not nearly left the station, and for long-term investors, patience into Q1 of 2024 will serve you well, in my humble view.
On a smaller time scale, as long as price remains over 4354, I will only monitor the smaller timeframes and won't adjust my perspective on either the Bullish Case or the Bearish Case. Over this level, we should continue to look higher.
For further details see:
S&P 500 Criteria For A Continuation Rally Into 2024 (Technical Analysis)