NVQ - S&P 500 Earnings: P/E Expansion Vs. Contraction - Providing Some Color To The Earnings Narrative
2023-04-17 06:05:00 ET
Summary
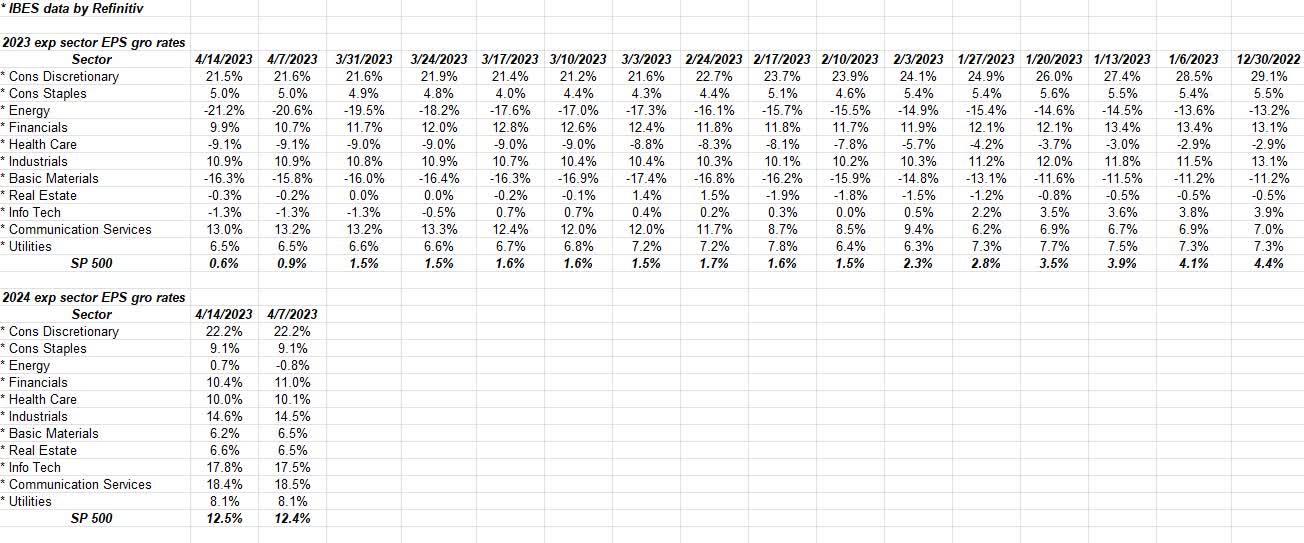
- The S&P 500 is up +8.27% YTD, while expected S&P 500 EPS growth in 2023 is just +0.6%. 2024 expected S&P 500 sector growth rates are looking at healthier EPS growth than the last few years.
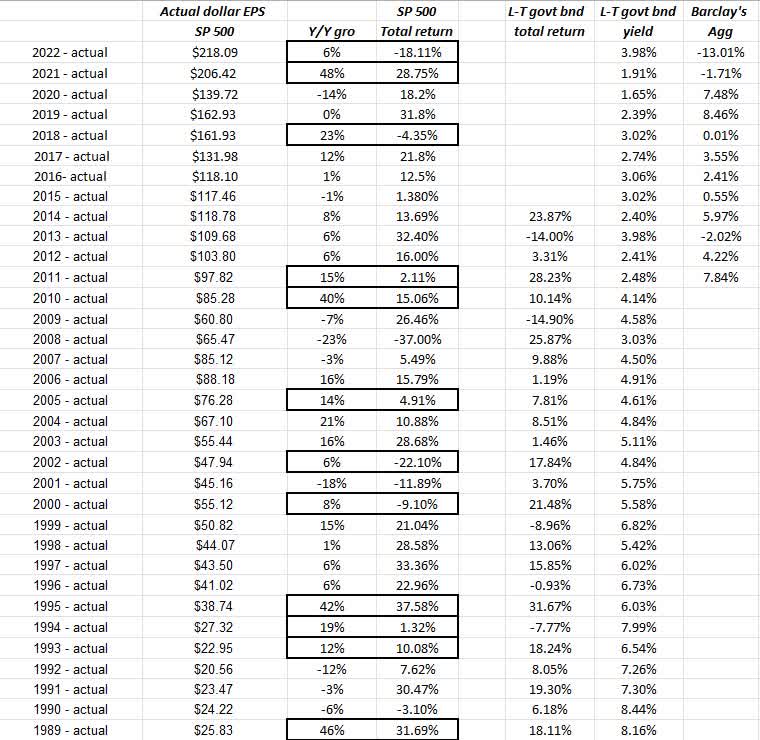
- Of the last 34 years (through 2022) where the S&P 500 annual EPS growth and S&P 500 annual return were compared, 14 years saw “P/E contraction” (i.e., annual S&P 500 earnings growth was greater than the return on the S&P 500).
- The S&P 500 is a “discounting” mechanism, so it will begin to incorporate the prospect for higher S&P 500 earnings in the year ahead. However, much can change, and quickly too.
The S&P 500 is up +8.27% YTD (per the Morningstar data), while expected S&P 500 earnings per share ((EPS)) growth in 2023 is just +0.6%.
However, as readers can see from the above spreadsheet, the 2024 expected S&P 500 sector growth rates are expecting healthier EPS growth than the last few years.
Readers have to remember, while 2024 seems a long way away and much can happen over the next 8.5 months, the fact is the S&P 500 is a “discounting” mechanism, so the S&P 500 will begin to incorporate the prospect for higher S&P 500 earnings in the year ahead.
That being said, there is a reason this data is updated weekly. Much can change, and quickly too, as was learned in 2008.
30 S&P 500 companies reported last week, and per the Refinitiv data, 62 are expected to report this coming week, so by next Friday morning, April 21, ’23, about 20% of the S&P 500 will have reported Q1 ’23 financial results, and you have to think that a lot of attention will be paid to Charles Schwab ( SCHW ), US Bancorp ( USB ), Truist Financial ( TFC ), Fifth Third Bank ( FITB ) and Regions Bank ( RF ) this week.
These banks / financials are the second tier of the financial sector (second tier meaning market cap and earnings weights within the S&P 500 and not the quality of the institution), with Schwab and Truist the two that garnered the most attention after the collapse of Silicon Valley Bank ( SIVBQ ).
P/E Expansion vs. Contraction
The above spreadsheet was started years ago to show how the returns on the S&P 500 annually correlate with the actual S&P 500 earnings growth rate for a given calendar year. (The spreadsheet goes deeper into the 1980s, but it couldn’t all be fit to make it legible.)
The dark, bordered boxes are years where the S&P 500 demonstrated P/E contraction or S&P 500 annual earnings growth (3rd column) was greater than S&P 500’s annual return (4th column). (Have to apologize right off the bat, 2004 was also a year of P/E contraction, even though it’s not highlighted.)
Here’s the point: of the last 34 years (through 2022) where the two data points were compared, i.e., S&P 500 annual EPS growth versus S&P 500 annual return, 14 years saw “P/E contraction”, which means annual S&P 500 earnings growth was greater than the return on the S&P 500 for that particular year.
What really fascinated me, looking at the table, was that the best years in terms of S&P 500 returns - 1991, 1996, 2003, 2013 - were all years where the S&P 500 annual earnings growth was either negative (go figure) or mid-single digits. Only 2003’s 28% return on the S&P 500 saw a double-digit S&P 500 earnings growth year at 16%.
Another interesting point is that some of the best S&P 500 market rallies with the best annual returns tend to occur when overall S&P 500 earnings growth is barely positive. Look at the period from 1995 to 1999. This probably speaks to the market cap issue and the influence of the top tier of the S&P 500 by market cap weight, which was then followed by 2000-2006 (6 years inclusive), where 4 of the years saw P/E contraction.
Bottom line
Looking at the top of the table, the last 2 years saw P/E contraction for the S&P 500 and 3 of the last 5 years have seen P/E contraction - the obvious Covid influence - from 2020 through 2022. The point of today’s post is not to say we (investors) are due for a year of “P/E expansion”, but the pattern makes sense, and the opening line of this week’s blog shows the potential start of a decent year.
Also, this history kind of smacks up against the financial media rhetoric where bearish investors or traders refer to “poor S&P 500 earnings growth” to continually make a bear case. (And the opposite is true as well, “strong earnings growth” leading to bullish prognostications.)
(Finally, this blog started assembling this data years ago when Refinitiv was still Thomson Reuters, and I believe it was Michael Thompson who was at Thomson who [or his team] supplied me with some of the S&P 500’s 1980s EPS data. Michael was a frequent CNBC guest in the late 1990s and early 2000s before moving on to other opportunities. Any errors involving the S&P 500 EPS data going back to the 1980s are this blog’s. Today, as is disclosed every week, all S&P 500 earnings data is sourced from IBES data by Refinitiv, which is the successor to Thomson Reuters and Thomson Financial.)
Summary / conclusion
The regional banks and smaller financials will likely get all the attention this week, but don’t ignore what is happening in other sectors. What’s interesting to me is that the financial sector - which doesn’t yet include the JPMorgan ( JPM ), Citigroup ( C ), and PNC Financial ( PNC ) earnings and revenue data from last Friday morning because Refinitiv cuts off the weekly data as of Thursday night - is expecting 10% EPS growth in 2023 and in 2024. The expected financial sector EPS has come down a little since early March ’23, or around the time Silicon Valley Bank collapsed, but not as much as you’d expect given the headlines.
Undoubtedly, the Fed’s discount window is helping assuage any anxiety over unrealized Treasury losses in the bank portfolios.
The S&P 500 is up 8% YTD, while the Russell 2000 ( IWM ) and the S&P Midcap ( MDY ) have increased 1.61% and 2.9% respectively. The driving influence in terms of YTD returns continues to be the “mega cap growth” factor, with the MGK ETF up 18.9% YTD.
Tesla ( TSLA ) reports this week - Wednesday night after the bell - and is still ranked 8th in the S&P 500 as of this weekend in terms of market cap weight. Netflix ( NFLX ) reports this week as well, so I’m treating both these companies as an early look at higher P/E growth stocks that have fallen out of favor.
Take all of this with a substantial skepticism and a healthy grain of salt. Past performance is no guarantee of future results. This information is provided to anyone that wishes to read the blog, and it may or may not be updated, and if updated, may not be updated in a timely fashion. Capital markets can change quickly, both positively and negatively.
Thanks for reading.
Editor's Note: The summary bullets for this article were chosen by Seeking Alpha editors.
For further details see:
S&P 500 Earnings: P/E Expansion Vs. Contraction - Providing Some Color To The Earnings Narrative