AFMC - S&P 500 Earnings: Sharp Jump In Treasury Yields / Nvidia And April PCE Data This Week
2023-05-22 02:10:00 ET
Summary
- With mega-cap tech / growth up 25.95% this year), the semiconductor group is being pulled higher with it, despite the memory-related names still being in a tough downcycle.
- Inflation data has heated up (or at least not cooled down enough to the Fed’s liking), so Friday’s PCE data could have greater import to both the general equity and bond markets than Nvidia’s much-anticipated earnings report.
- This past week, the Treasury yield curve showed the largest sequential increases in Treasury yields seen in ’23.
With mega-cap tech / growth up 25.95% this year (Vanguard Mega-Cap Growth ETF ( MGK )), the semiconductor group is being pulled higher with it, despite the memory-related names still being in a tough downcycle. SMH (VanEck Semiconductor ETF) is up +31.95% YTD both as of Friday, May 19th, 2023.
Nvidia ( NVDA ) reports this coming week - Wednesday after the close - while Costco ( COST ) reports after the closing bell on Thursday night. Nvidia is up a whopping 113.96% in terms of its YTD return, while COST is up a smidge over 9% YTD. (All return data courtesy of Morningstar.)
Looking at Briefing.com consensus, Nvidia consensus EPS is expected at $0.91 per share versus a $1.36 a year ago, which is a 34% decline y/y for a stock up 113% YTD. That being said, this blog has never owned or followed or modeled Nvidia, but having owned the semis in the late 1990s and early 2000s, the cycles on this sector are something to comprehend. (Micron ( MU ) is up 36% YTD, and that is a DRAM and NAND producer.)
I have no fundamental or technical opinion on Nvidia.
The big economic data point this week will be Friday morning’s, April ’23 PCE prices, with Briefing.com consensus expecting +0.3% overall and +0.3% for Core PCE. There will likely be some attention paid to Thursday’s 2nd look at Q1 ’23 GDP and the GDP deflator.
S&P 500 data:
- The forward 4-quarter estimate slipped to $224.38 this week, from last week’s $224.61 and December 31’s $222.91.
- The P/E on the forward estimate is 18.6x, versus 18.6x as of 3/31/23 and 17.2x as of 12/31/22.
- The S&P 500 earnings yield was 5.35% as of this week’s close, the exact same as on 3/31/23.
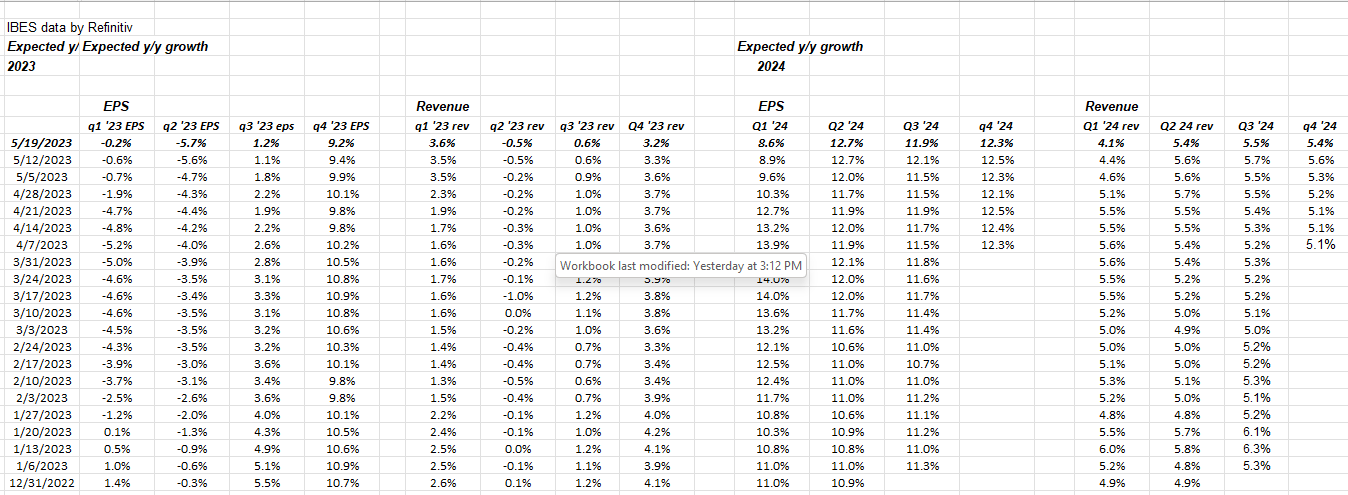
If readers click on the above table, look at Q1 ’23 EPS and revenue revisions by week. Note the strong improvement since Q1 ’23 started being reported.
Q4 ’23 EPS and revenue have not seen the kind of downward drift that other quarters have, which is telling to me. Reading the data and revisions, the numbers are telling us that the end of ’23 could see strong EPS and revenue growth for the S&P 500 in terms of the 4th quarter.
Summary / conclusion
A number of traders on social media seem to be hoping for Nvidia to crater post earnings to take some of the TYD return “heat” off mega-cap tech and technology in general.
Being long some SMH but never owning Nvidia directly, I don’t have a dog in this fight but will simply watch the action.
Inflation data has heated up (or at least not cooled down enough to the Fed’s liking), so Friday’s PCE data could have greater import to both the general equity and bond markets than Nvidia’s much-anticipated earnings report.
With last Friday’s interview of both Jay Powell and Ben Bernanke, the fed funds futures fell sharply in terms of an expected June 14, ’23 fed funds rate hike, back down to the 14% range, after spiking up towards 35% after Jay Powell sounded like he was willing to give the current fed funds rate hikes and the regional bank situation time to see what evolves.
This past week, the Treasury yield curve showed the largest sequential increases in Treasury yields seen in ’23. This blog tracks that data weekly, and this week, Treasury yields across 3 months, 1 year, 2 years, 5 years, 10 and 30 years saw the sharpest jump since June 10th, 2022, even with a little bounce on Friday, May 19th, 2023.
Take everything you read here with substantial skepticism. It’s one person’s opinion, and past performance is no guarantee of future results. All S&P 500 EPS and revenue data is sourced from IBES data by Refinitiv, although the tables and any manipulations are this blog’s work. None of this is advice. Capital markets can change quickly for both the good and the bad, so understand your own comfort level around market volatility.
Thanks for reading.
Editor's Note: The summary bullets for this article were chosen by Seeking Alpha editors.
For further details see:
S&P 500 Earnings: Sharp Jump In Treasury Yields / Nvidia And April PCE Data This Week