CWS - S&P 500 Earnings Update And A Look At Costco Vs. Walmart Revenue Estimates
2023-09-15 21:25:00 ET
Summary
- Walmart is now trading at an all-time-high, although the so-called breakout above the May ’22 highs around $160 has been on below-average volume.
- For fiscal year ’24 and ’25, WMT has seen EPS estimates get cut 2% for fiscal ’24 and 1.5% for fiscal ’25, since 12/31/22.
- For fiscal ’23 and ’24, COST has seen the full-year EPS estimates slip 3% for fiscal ’23 and 2% for fiscal ’24.
Walmart ( WMT ) is now trading at an all-time-high, although the so-called breakout above the May ’22 highs around $160 has been on below-average volume.
Some might argue with the sideways market the last 2 months. Investors have gravitated to consumer staples like Walmart, but staples actually were trading weaker when Walmart moved solidly above $160 to $162.
Costco ( COST ) reports their fiscal Q4 ’23 in about 10 days – the last week of September – so let’s look at or compare revenue estimates for the two retail giants:
Walmart
- Fiscal ’24 (ends Jan ’24): Walmart’s revenue estimate for fiscal ’24 has climbed 3% from 12/31/22, from $623.6 billion to $642 billion as of 9/15/23;
- Fiscal ’25: (ends Jan ’25): Walmart’s revenue estimate for fiscal ’25 has climbed 3.3% from 12/31/22, from $643.1 billion to $664.8 billion as of 9/15/23;
For fiscal year ’24 and ’25, WMT has seen EPS estimates get cut 2% for fiscal ’24 and 1.5% for fiscal ’25, since 12/31/22.
Costco
- For fiscal ’23 (ends Aug ’23), Costco’s revenue estimate has been revised down 1.1% from $243.5 billion as of 12/31/22, to $240.7 billion as of 9/15/23;
- For fiscal ’24 (ends Aug ’24), Costco’s revenue estimate has been revised down 1.7% from $257.99 billion as of 12/31/22, to $253.6 billion as of 9/15/23;
For fiscal ’23 and ’24, COST has seen the full-year EPS estimates slip 3% for fiscal ’23 and 2% for fiscal ’24.
In terms of comparisons between Costco and Walmart, Costco’s earnings report breaks out its product line differentiation, and it shows that “Food & Sundries” and “Fresh Foods” represent about 50% of Costco’s total revenue.
How much of that is true grocery seems to be deliberately obfuscated by the disclosure (and I don’t blame Costco for that), but sell-side analysts estimate Walmart’s grocery segment as anywhere from 50% to 70% of Walmart’s total revenue.
It’s an educated guess on my part, but I suspect Walmart’s grocery business as a percentage of revenue is larger than Costco’s grocery line.
The point being to all of this is that positive revenue revisions is a significant positive for the largest retailer in the world and the revenue estimates have been seeing positive revenue revisions for some time.
For Costco, the 1% to 25% downward drift over the last 9 to 10 months is not that big of a deal, but it’s worth noting.
The fact is, between seeing positive EPS revisions or positive revenue revisions, I’d choose positive revenue revisions 99% of the time, particularly for retail.
Walmart’s operating margin has been under pressure for 20 years given Amazon ( AMZN ) and the move to grocery in 2000, but the EDLP (every day low price) leader is starting to fight back.
Costco has been the better stock and is probably considered the better retailer (or wholesale club) for a number of reasons that require a longer article.
S&P 500 data
- The forward 4-quarter estimate (FFQE) rose a whopping penny this week to $233.39 vs. last week’s $233.38.
- The P/E ratio on the forward estimate is 19x.
- The S&P 500 earnings yield ((EY)) ended the week at 5.24% towards the high end of the range in the last 10 to 11 weeks, but still well below where investors might get interested in putting a lot of cash to work.
- The Q2 ’23 SP 500 bottom-up EPS estimate is unchanged this week at $54.49, up from $52.91 on June 30 ’23.
- The EPS and revenue “upside surprises” remain unchanged for the quarter at +7.9% for S&P 500 EPS and +1.7% for S&P 500 EPS revenue.
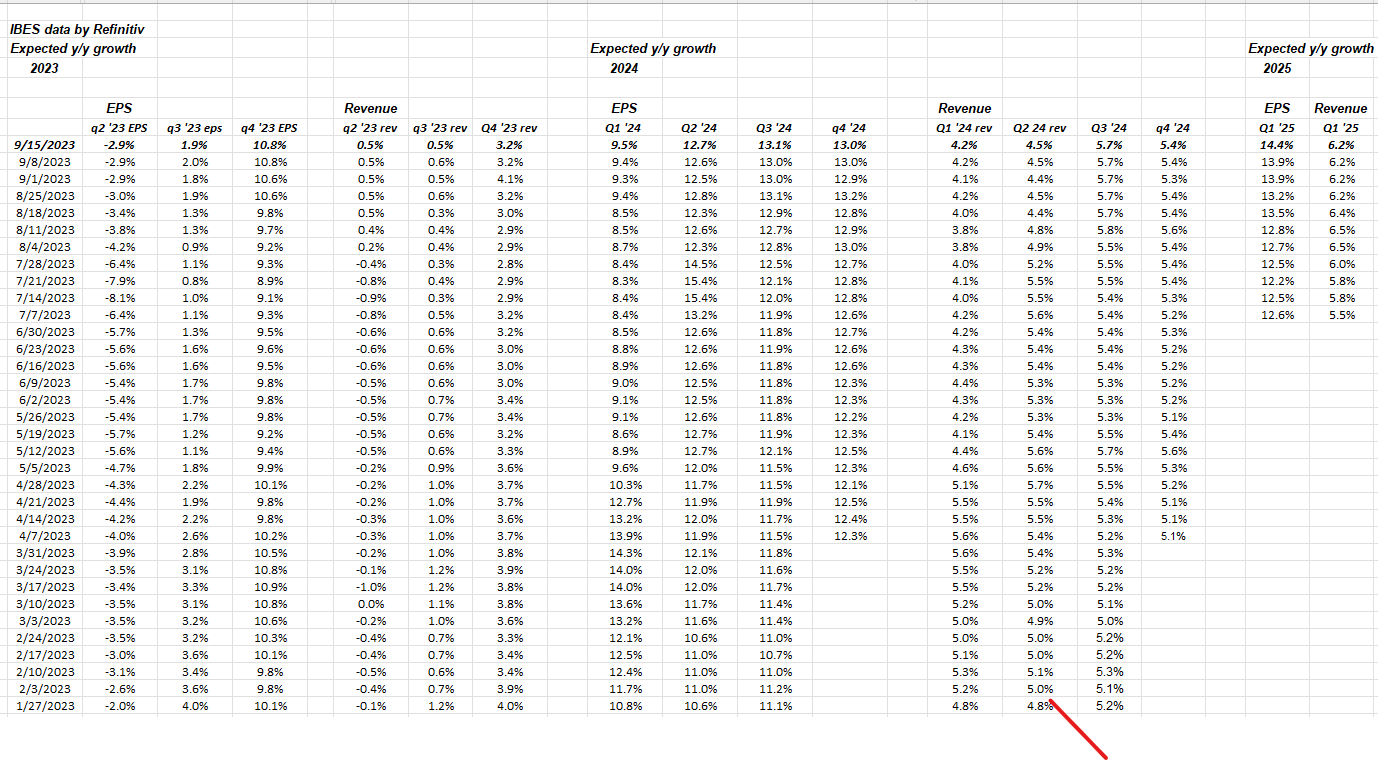
Expected S&P 500 EPS/revenue growth rates by quarter:
Just thought I’d leave this table with readers on the progression in expected S&P 500 EPS and revenue growth rates by quarter, through Q1 ’24.
If Q4 ’23 gets to an expected EPS growth rate of 11%, it would be a new high print.
Starting with Q3 ’23, the S&P 500 faces weaker comps from a year ago: the S&P 500 EPS and revenue estimates started to fall off in Q3 and Q4 of 2022.
Summary/conclusion: We get August housing data next week with August housing starts and building permits and the big report (for this blog anyway) will be FedEx ( FDX ) which will report their Q1 ’24 financial results after the close on Wednesday, September 20th, the same day as the FOMC meeting announcement.
FedEx has a global transportation footprint and the new CEO Raj Subramaniam, is consolidating some of the three segments, Express, Ground and Freight, in order to effectively drive operating margin growth.
Over the last 23 years, anytime FDX’s operating margin hit 10%, it was time to sell the stock. Raj is still guiding to a goal of 10% operating margins, but if the Express segment can see costs removed, FDX can leverage that to “better than 10% operating margins” eventually.
With the last 2 weeks of the quarter coming up, readers may not see the typical weekly S&P 500 earnings update since other topics are worth talking about, but the weekly update will start after October 1 ’23.
I’m trying to combine some individual stock analysis on more blog posts to make for more interesting reading by users.
Take all of the above with substantial skepticism, since it represents one person’s opinion. All S&P 500 EPS and revenue data is sourced from IBES data by Refinitiv, or where noted from FactSet.
Past performance is no guarantee of future results and none of this is to be construed as advice. Some or all of this data may or may not be updated, and if updated, may not be done in a timely fashion.
Capital markets can change quickly, both positively and negatively. Evaluate your own appetite for market volatility and comfort levels, and adjust your portfolio accordingly.
Thanks for reading.
Editor's Note: The summary bullets for this article were chosen by Seeking Alpha editors.
For further details see:
S&P 500 Earnings Update And A Look At Costco Vs. Walmart Revenue Estimates