QVML - S&P 500 Earnings Update: Corporate High-Yield Had A Good Week
Summary
- The February 2nd, 2023 rally in the corporate high yield asset class was the strongest day of spread narrowing since November ’20.
- Spread tightening over longer periods of time is a positive underlying condition for both the US stock market and bond markets, as well as the US economy, since it says the US credit markets are open and functioning.
- But the fly in the fly in the ointment is S&P 500 earnings, and while a component of the current weakness likely is the “normalization” of S&P 500 earnings growth after 2020 and 2021 (post-pandemic), particularly in tech, there is an economic cyclicality to the S&P 500 earnings story.
Twitter was the first medium - I believe it was Lisa Abramowicz of Bloomberg - that noted that the February 2nd, 2023 rally in the corporate high yield asset class was the strongest day of spread narrowing since November ’20. This was confirmed by a long-time friend who has managed corporate bond money for 35 years - both insurance and total return money - who confirmed that Thursday, February 2, 2023 was the 13th-biggest “tightening” (i.e., spread tightening) day in the last 10 years.
Probably due to the pandemic, this economic and S&P 500 earnings cycle is different.
Here’s how clients' taxable high-yield performed this week:
- PIMCO ( PHDAX ): +91 bps on the week, to 4.76% from 3.85% last week
- HYG ETF: +81 bps on the week to 4.25% from 3.44% last week
- SHYG (short-duration high-yield ETF): +64 bps on the week from 3.16% to 2.52% last week
The returns represent YTD ’23 returns as of 2/4/23 and then 1/27/23.
The implication for the stock market is clear: spread tightening over longer periods of time is a positive underlying condition for both the US stock market and bond markets, as well as - generally speaking - the US economy, since it says the US credit markets are open and functioning.
While the benchmark revisions muddied the January ’23 jobs report numbers, and we could likely see downward revisions in the months ahead, the fact is that the US economy remains in fairly good shape. Services PMI on Friday, released after the nonfarm payroll report, shot back up to 55. It was a month ago, the day of the December ’22 jobs report in early January when the Services PMI came in much worse than expected at 45, when the Street thought the services part of the US economy was finally capitulating to higher interest rates. Average the two months and services is about 50, neither expanding nor contracting.
But the fly in the fly in the ointment is S&P 500 earnings, and while I do think a component of the current weakness is the “normalization” of S&P 500 earnings growth after 2020 and 2021 (post-pandemic), particularly within the tech sector, there is an “economic cyclicality” to the S&P 500 earnings story.
S&P 500 earnings data:
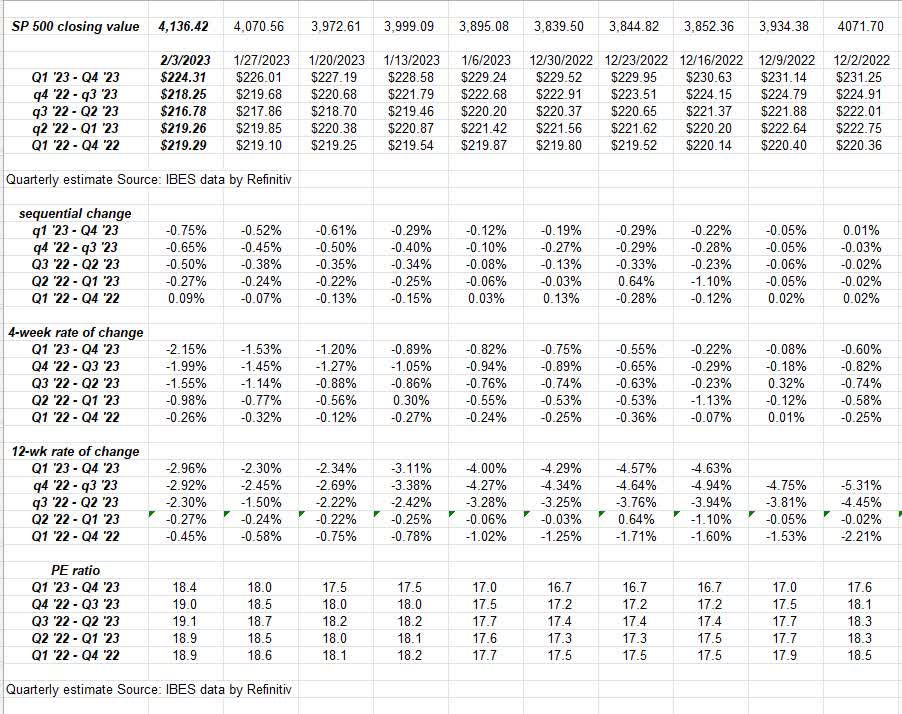
- The forward 4-quarter (FFQE) earnings estimate for the S&P 500 fell this past week to $223.28 from last week’s $225.02, which was a sequential decline of -0.77%, the sharpest sequential drop since the last time Big Tech reported earnings in late October, early November ’22;
- The P/E ratio as of Friday, February 3rd’s close was 18.5x versus last week’s 18x;
- The S&P 500 earnings yield fell to 5.40% from last week’s 5.53% and September 30, ’22’s 6.53%;
- The Q4 ’22 bottom-up S&P 500 estimate rose last week to $53.44 from the prior week’s $53.26. That is a positive, although forward estimates continue to be under pressure.
Rate of change
This block starts early December ’22, and the 2023 EPS estimate is being watched. The 12-week downward revision was more severe this week, which we wanted to watch with last week’s earnings update , but the 2023 full-year rate of change is still not as severe as what we were seeing for 2023 in late 2022.
However, I’d like to see those numbers improving, not getting worse.
The caveat to all this too is that Apple ( AAPL ), Amazon ( AMZN ), and Alphabet’s ( GOOG , GOOGL ) forward EPS changes are not in the above data because they reported Thursday, February 2nd after the close and IBES data by Refinitiv cuts off the weekly data as of Thursday night’s market close, so next week’s data will reflect full estimate changes for the week ended February 3rd’s earnings releases.
Quarterly, estimated, bottom-up, S&P 500 EPS / revenue growth rates
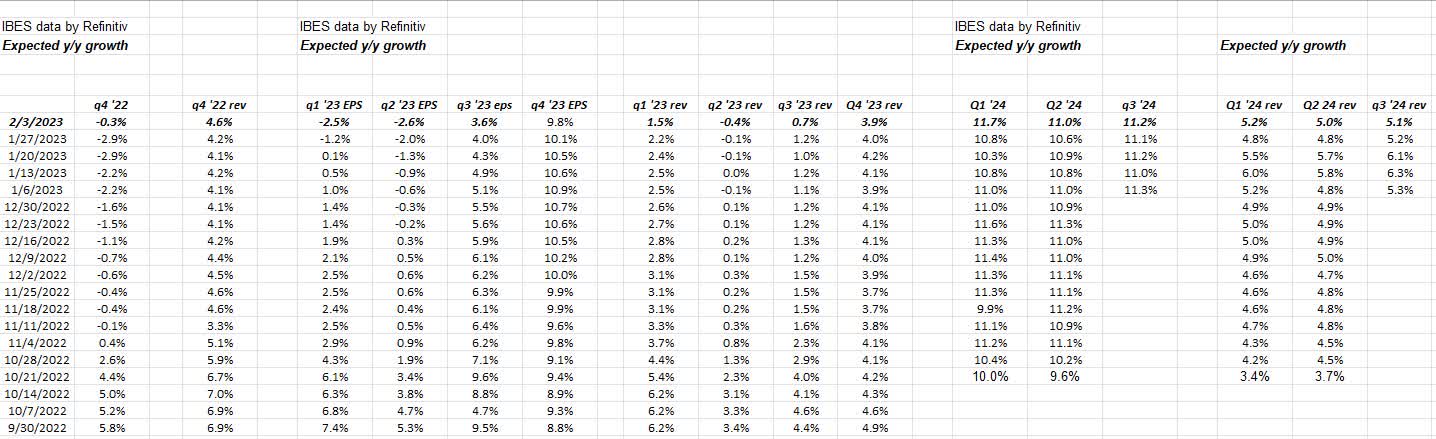
The above spreadsheet shows current, estimated, bottom-up S&P 500 EPS and revenue growth rates for Q4 ’22, the four quarters of 2023 and then the first three quarters of 2024. Refinitiv basically gives subscribers an 8-quarter look at what’s expected for S&P 500 earnings.
- Q4 ’22 showed upward revisions to Q4 ’22 EPS and revenue growth this past week;
- 2023 by quarter shows weaker numbers until Q4 ’23, and then high-single-digit EPS growth is expected for Q4 ’23 (as of this week);
- 2024’s initial expectations show a stronger year brewing for S&P 500 EPS and revenue estimates, but it’s still a little early.
The only reason this data is shown is that you have to look at S&P 500 EPS and revenue data across different time frames.
If the S&P 500 is a discounting mechanism that looks 12-15 months forward, then one should realistically assume that early 2024 is being factored into market prices and levels.
Given the inherent pessimism in the stock market, both on the part of corporate managements and investors, there is typically a discount factor in S&P 500 quarterly results that generates the “upside surprise” that the media talks about. Now the upside surprise or the beat rate has come down late 2021 and early 2022, which was expected, since Q1 and Q2 ’21 generated well-above-the-ordinary “upside surprise,” or beat rates of 22% and 15% respectively in S&P 500 EPS and 4% and 5.2% respectively in S&P 500 revenue.
The upside surprise in Q3 ’22 for the S&P 500 EPS and revenue was 5.5% and 2.3%, respectively.
This is all a return-to-normal for the expected S&P 500 EPS and revenue growth rates post-pandemic, but it has taken 8-10 quarters to play out.
Summary / Conclusion
Looking at the results of JPMorgan’s ( JPM ) corporate and investment bank or Goldman Sachs’ ( GS ) numbers in 2022, FICC (fixed-income, currency and commodities) and stock and bond underwriting were horrid, but the developments this past week and really in 2023 thus far (after 5 weeks) are showing an opening up of the bond markets for the first time in a year.
It feels like 1995 in terms of the still-pervasive negative market sentiment and skepticism, and the constant worry about a recession after what was back then the worst bond market ever in 1994. (The funny thing is in 1994, the Barclays Aggregate fell just 2% for the full year, versus the 13% drop in AGG in 2022.)
There is reason to worry over punk S&P 500 earnings and guidance, but the fact that corporate spreads are improving, particularly high-yield, is an overlooked positive for sure.
If readers / investors / worriers see a day like Monday this past week, when the S&P 500 fell 1.2% and the Nasdaq fell 2%, look at the daily change in the corporate high-yield ETFs like HYG (of which clients are long) and JNK. Compare the rates of change over time.
As someone who was studying money & banking in the fall of 1980 at a small school (the course was being taught by a local Federal Reserve manager), and Volcker was sending the Fed funds rate to 20% and the 30-year Treasury hit 15% that fall, watching the 10-year Treasury yield trade down to 55 basis points in August 2020 just prior the Jackson Hole conference felt like a life that had come full-circle. The point being that think how many US corporations refinanced debt (again) like from 2008 to 2016, at very low nominal rates and tighter credit spreads than the previous 30 years. It’s the same with the single-family mortgage market, too. The Fed data is showing that household balance sheets remain in good shape, probably from the wave of refinancings and lowering the cost of mortgage payments during 2020, 2021 and early 2022.
Take all of this with substantial skepticism, since it’s one person’s opinion. Past performance is no guarantee of future results. The earnings data is courtesy of IBES data by Refinitiv, but the calculations and measurements are solely this blog’s, so any mistakes are on me. Capital markets can change quickly, both positively and negatively, so assess your own level of risk and reward.
Thanks for reading.
Editor's Note: The summary bullets for this article were chosen by Seeking Alpha editors.
For further details see:
S&P 500 Earnings Update: Corporate High-Yield Had A Good Week