QVMS - S&P 500 End Of 2023: The 'Flaw' Of Averages
Summary
- Seeking Alpha have asked contributors to make a forecast of S&P 500 index level at end of 2023.
- The basis of forecasting is fairly prescriptive, requiring an estimate of S&P 500 average multiple applied to an estimate of S&P 500 average earnings, to arrive at market capitalizations.
- "The 'Flaw' Of Averages" leads me to take a slightly different approach to arrive at estimated market capitalizations.
"The 'Flaw' Of Averages"
The use of the S&P 500 ( SP500 ) average multiple applied to an estimate of S&P 500 average earnings, to arrive at market capitalizations, brings into play what this article from the Harvard Business Review describes as, "…"the flaw of averages," which states, simply, that plans based on assumptions about average conditions usually go wrong. This basic but almost always unseen flaw shows up everywhere in business, distorting accounts, undermining forecasts, and dooming apparently well-considered projects to disappointing results."
Forecasts, whether close to actual outcomes or not, are only useful if we can discern why actual outcomes differ from forecast, enabling us to review and reset our thinking. Adopting averages in forecasts without clearly documenting the detailed elements of and basis of calculation of those averages does not allow us to understand why actual outcomes differ from forecast.
Another issue I have with estimating S&P 500 average earnings is knowing whether I should be using GAAP or Non-GAAP earnings estimates. I presume S&P 500 earnings are historically GAAP based, though I have been unable to verify this. Most forward analysis is based on Non-GAAP earnings. We can avoid this dilemma by understanding float market cap is a function of share price and outstanding shares. We can forecast share prices by either multiplying estimated GAAP EPS by estimated GAAP P/E ratio or estimated Non-GAAP EPS by estimated Non-GAAP P/E Ratio. We can then multiply share price by float outstanding shares to arrive at float market cap. That requires estimates by ticker, a potentially massive task, creating so much detail we will be unable to discern the forest for the trees. How we can bring that down to a manageable task is discussed below.
Not Quite A Pareto Analysis
The Pareto principle recognizes that in many situations 80% of the outcome is driven by 20% of the inputs. So for a company selling a range of goods 80% of the profits might come from 20% of the range. The S&P 500 index does not quite match that with only around 60% of the index valuation derived from 20% of the tickers. That's 100 tickers which would involve more work than I wish to do. I'm happy to settle on detailed forecasting for 10% of the tickers (top 50 of the 500 tickers) which contribute a little over 50% of the index value.
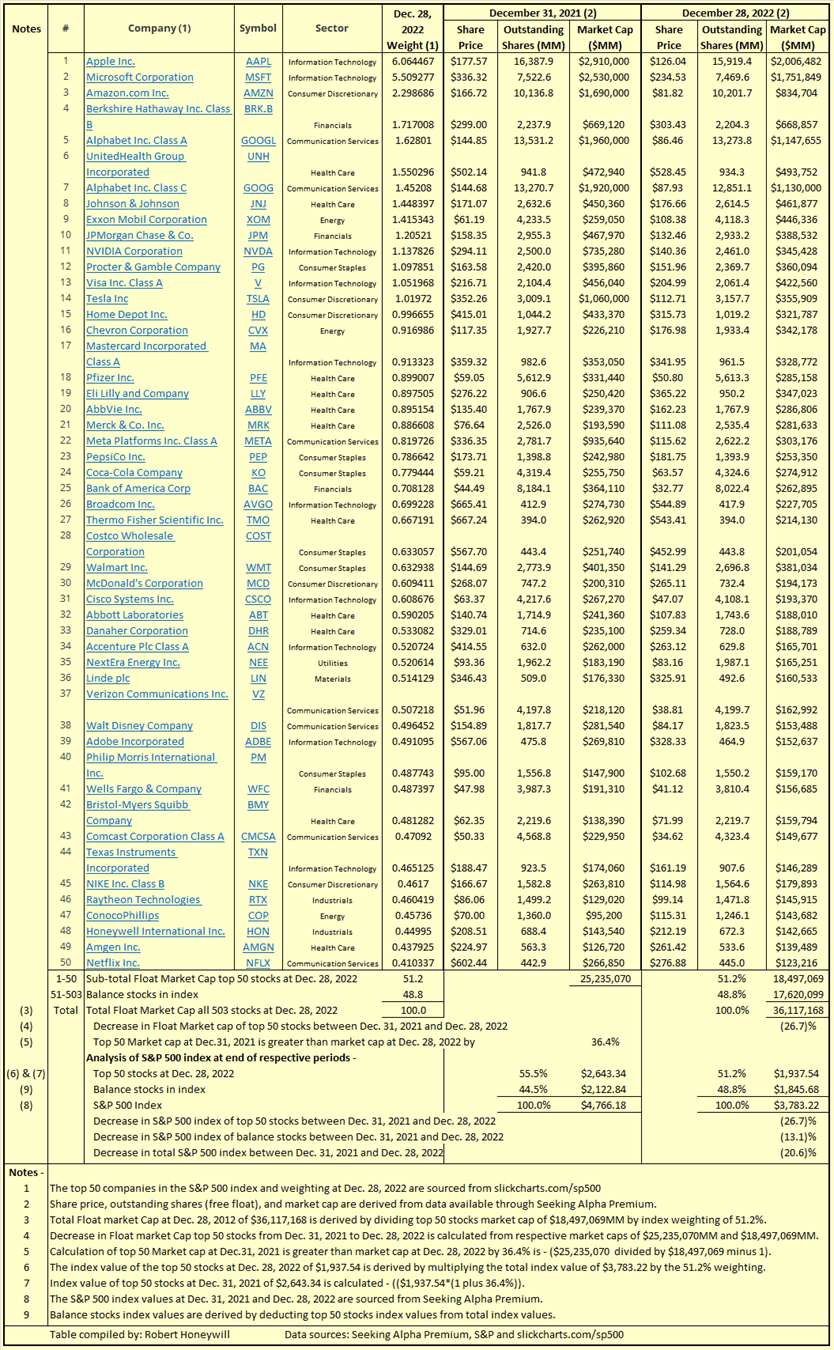
Table 1 below analyses the S&P 500 index between the current top 50 tickers by line item and the balance as one line item.
Table 1
Seeking Alpha Premium, S&P, slickcharts.com/sp500
In Table 1 above, I have taken the current top 50 tickers included in the S&P 500 index and multiplied share price at Dec. 28, 2022, by outstanding shares to arrive at total float market cap of $18,497,069MM at Dec. 28, 2022. I have carried out a similar exercise to arrive at market cap of $25,235,070MM at Dec. 31, 2021, for the same 50 tickers (the top 50 in the index will not necessarily be the same for both periods, but that does not impact the exercise). Not surprisingly, it can be seen the market cap of the top 50 shares has decreased by 26.7% since end of 2021, compared to total index decrease of 20.6%. Having determined market cap of the top 50 shares, representing 51.2% of the index value, I can calculate the estimated market cap of the balance 450 shares in the index at $17,620,099MM (48.8%). I can then analyze the index value at Dec. 28, 2022, into top 50 stocks and balance stocks. I know the total float market cap of the 50 top stocks was 36.4% higher at end December 2021 than at Dec. 28, 2022, and I have made the assumption their value in the index was also 36.4% higher at end December 2021. On this basis, the total index value of $4,766.18 at end of December 2021 can be analyzed into top 50 stocks $2,643.34 and balance 450 stocks $2,122.84. This allows me to calculate the top 50 stocks index value has declined by 26.7% in the past year and the balance 450 stocks index value has declined by 13.1%.
S&P 500 Forecast At End 2023
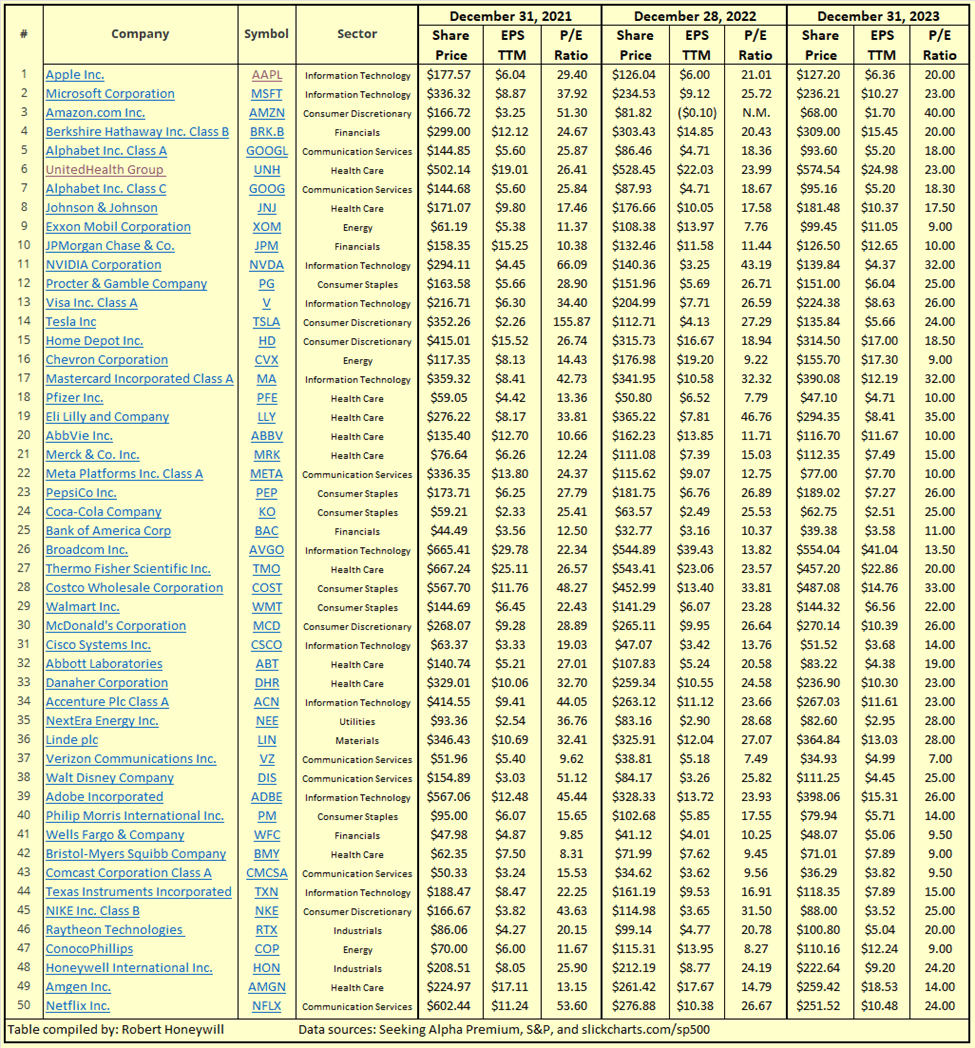
My first step is to calculate estimated share prices for the top 50 tickers at end of 2023, per Table 2 below.
Table 2
Seeking Alpha Premium, S&P, slickcharts.com/sp500
Table 2 includes for the top 50 stocks -
- actual share prices for end of 2021 and at Dec. 28, 2022.
- actual Non-GAAP EPS for 2021 and analysts estimated EPS for 2022.
- P/E ratios for 2021 and 2022 based on dividing share price by EPS.
- SA Premium analysts EPS forecasts for TTM 2023 (TTM Nov 2023 or Jan 2024, as appropriate, for tickers that do not report a December quarter)
- Estimated non-GAAP P/E ratios for 2023 - these are based on 2021 and 2022 P/E ratios, somewhat arbitrarily adjusted to take into account EPS growth, and an element of judgment, possibly including a touch of sentiment.
- Estimated end of 2023 share prices calculated by multiplying estimated EPS by estimated P/E ratios.
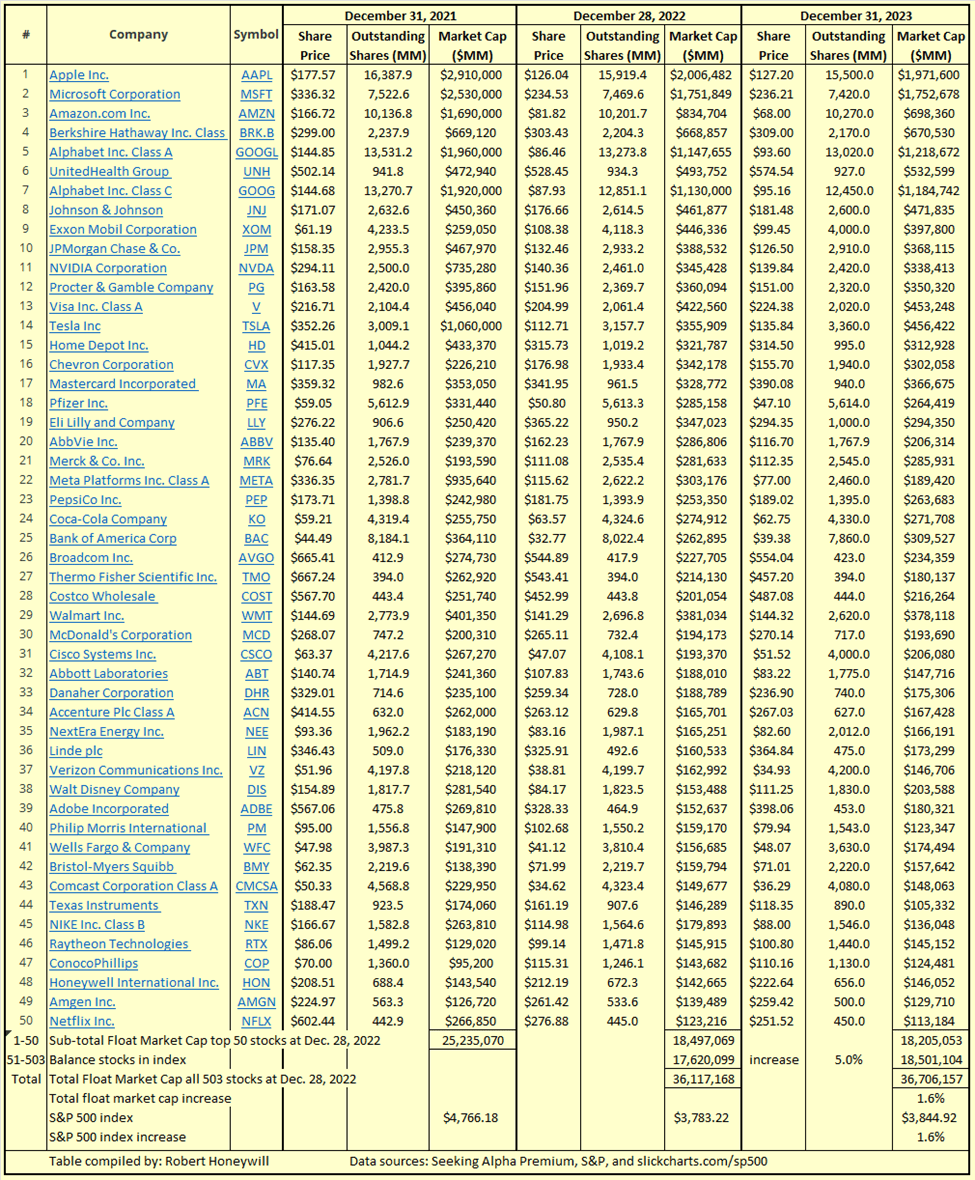
My next step in Table 3 below is to estimate outstanding shares at end of 2023 for the top 50 tickers to apply to the share prices per Table 2 to arrive at market cap at end of 2023.
Table 3
Seeking Alpha Premium, S&P, slickcharts.com/sp500
Table 3 shows, despite analysts generally higher EPS estimates for 2023 versus 2022, for the top 50 stocks, the total market cap at end of 2023 is expected to reduce slightly from end of 2022. The reason for the reduction is due to allowance for a continuation of share buybacks for many of the tickers, reducing outstanding shares and thus lowering market cap. For the balance 450 stocks I'm estimating a 5% overall increase in total market cap. I'm doing this on the basis I believe there's still a considerable appetite for stocks, tempered over the last year by interest rate increases and the threat of further rate increases. I believe the effects of interest rates are likely now fully absorbed and that appetite for stocks will result in increased buying interest.
Summary & Conclusions
My best estimate/forecast for the S&P 500 index at end of 2023 is $3,845, based on the foregoing assumptions and calculations. As other contributors have pointed out, there are many factors that are currently in play, and others that could come into play between now and end of 2023, including the war in Ukraine and its impact on oil prices, the shortage of workers and supply side constraints, and of course inflation and ongoing actions by the Fed. One advantage of completing a detailed forecast as above, rather than guestimating the effect of all the various factors on earnings and P/E ratio averages, is I should be able to explain in detail where I was wrong. Well, that is, for at least of 50% of my forecast.
For further details see:
S&P 500 End Of 2023: The 'Flaw' Of Averages