EFIV - S&P 500 ETFs: 16 Things Smart Investors Should Know
Summary
- The S&P 500 index is almost unarguably the #1 benchmark followed by long-term investors, fundamental analysts, and short-term traders alike.
- I felt the need to explain 16 details about the S&P 500, I believe well-informed investors should know about this index, however they use it.
- These points cover different ways of trading the S&P 500, its composition and place in global portfolios, and how it compares with other markets, market slices and strategies.
- I would be very surprised if even 1/4 of the readers of this article knew more than 4 of these points before reading them here, but either way, I hope to start an informed discussion on this index.
Whether you are a long-term passive index fund investor, a fundamental analyst, or an active trader, chances are you have at least one S&P 500 statistic somewhere on your investment dashboard. Even though I decided many years ago that I would no longer buy and hold any S&P 500 index funds or ETFs , there is no escaping that this index remains a stock valuation benchmark that is too big to ignore and too liquid not to use for quick hedges. In this article, I wanted to lay out 16 of the most important points about the S&P 500 index and top S&P 500 index ETFs I believe smart investors should keep in mind, whether or not your portfolio includes any direct positions in any of these ETFs.
The first two points introduce the top-3 S&P 500 ETFs, and the one other ETF in the top-4 I believe may as well be an S&P 500 ETF. Points #3-6 look into the S&P 500 as part of the global stock market, and its relative revenue mix, valuation metrics, and performance. Then, points #7-9 look at different ways of tracking, and sometimes outperforming, the S&P 500 with a limited number of stocks, while #10-13 look at different ways of slicing the index by growth vs. value, sectors, ESG, and debt vs. equity. Finally, points #14-16 explain different offshore ETFs, futures, and options that different investors may find to be better ways to access the S&P 500 index than others.
#1: 3 of the 4 largest US-listed ETFs track the S&P 500
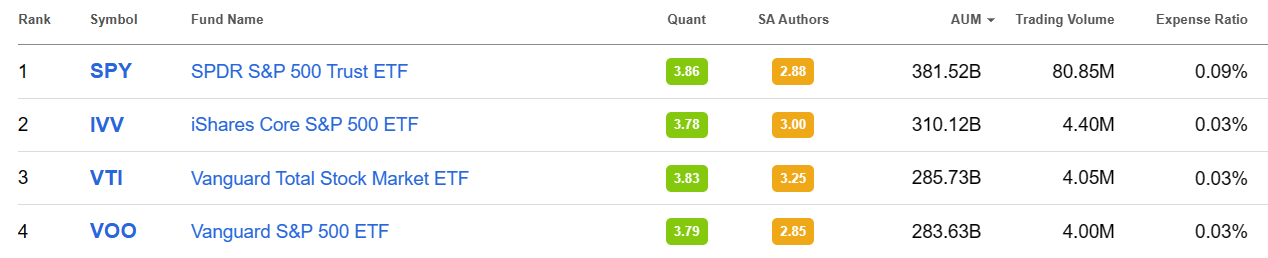
Of the four largest US-listed ETFs, three track the S&P 500:
The largest US-listed ETFs by size can be seen at any time by looking at the SeekingAlpha ETF screener and sorting by assets under management ((AUM)). The only one of the top four that does not track the S&P 500 is the Vanguard Total Stock Market ETF ( VTI ), which I will argue in point #2 is practically interchangeable with VOO for many investors. For that reason, I will argue that the Vanguard funds are practically the leading vehicle US long-term buy-and-hold passive investors use to hold the S&P 500, while the volume numbers show that SPY remains the dominant way traders get in and out of it.
If we chart the long-term AUM of these four funds, we see that the older funds built on their head starts to build up their asset bases, but that IVV, VTI, and VOO, whose expense ratios are significantly lower than SPY's, have made up most of the difference over the past decade. Some ETF watchers ask when IVV or VOO may eventually overtake the AUM of SPY, but in my view that is not a useful question for most investors, who will continue to use SPY for quick trades and IVV or VOO for long-term buy-and-hold positions. For me, the more important question about which of these three ETFs I look at is which other ETF I am comparing it to. For example, if I am comparing to another iShares fund I will use IVV, if I am comparing to another Vanguard fund I will use VOO, etc., in order to compare statistics from similar sources, as I will show in point #5 below.
#2: The S&P 500 tracks the total US market extremely closely short to medium term
Since this article is about the S&P 500, I wanted to finish off my mention of VTI with a few charts showing why I see it as interchangeable with VOO short-term, with differences really only noticeable over the very long term. The first of these charts shows how, since the 2010 launch of VOO, the total returns of VTI vs. VOO would be very difficult for most investors to tell apart, with the two funds passing each other by a few basis points here or there over the past decade.
If we go back to 2001, from which point we can compare VTI to the older SPY, we see that VTI has managed to average a more significant premium of over 0.6% per year over a little more than two decades. I attribute this to the small size premium, and especially the small cap value premium , which benefitted from large cap growth being overvalued relative to small cap value coming out of the 1999-2000 dot-com bubble and into the 2000-2002 bear market.
If we look at the rolling correlations between the 1-month returns of SPY vs. VTI, we see that this correlation is over 99% most of the time, with the biggest "anomaly" being the year after the COVID-19 pandemic pushing this correlation only as low as 94% and only very briefly. This basically means that for most if not all months of the past 20 years, most investors would probably have not noticed any difference between the monthly returns of SPY vs. VTI, making these two "practically interchangeable" for shorter-term uses.
#3: The S&P 500 covers about half the world's stock market value
Very roughly, we can break down the value of the Vanguard Total World Stock ETF ( VT ), which as the name suggests aims to track a market-cap weighted index of whole global equity market, into the following three parts:
- 50% Vanguard S&P 500 ETF ( VOO )
- 10% Vanguard Extended Market ETF ( VXF ), and
- 40% Vanguard Total International Stock ETF ( VXUS )
VXF is defined as the US total market excluding the S&P 500 (in other words, VOO + VXF = VTI), while VXUS is basically VT minus VTI. In other words, the global stock market by value is currently weighted around 60% US and 40% non-US, and that US portion is roughly 85% S&P 500 and 15% everything else.
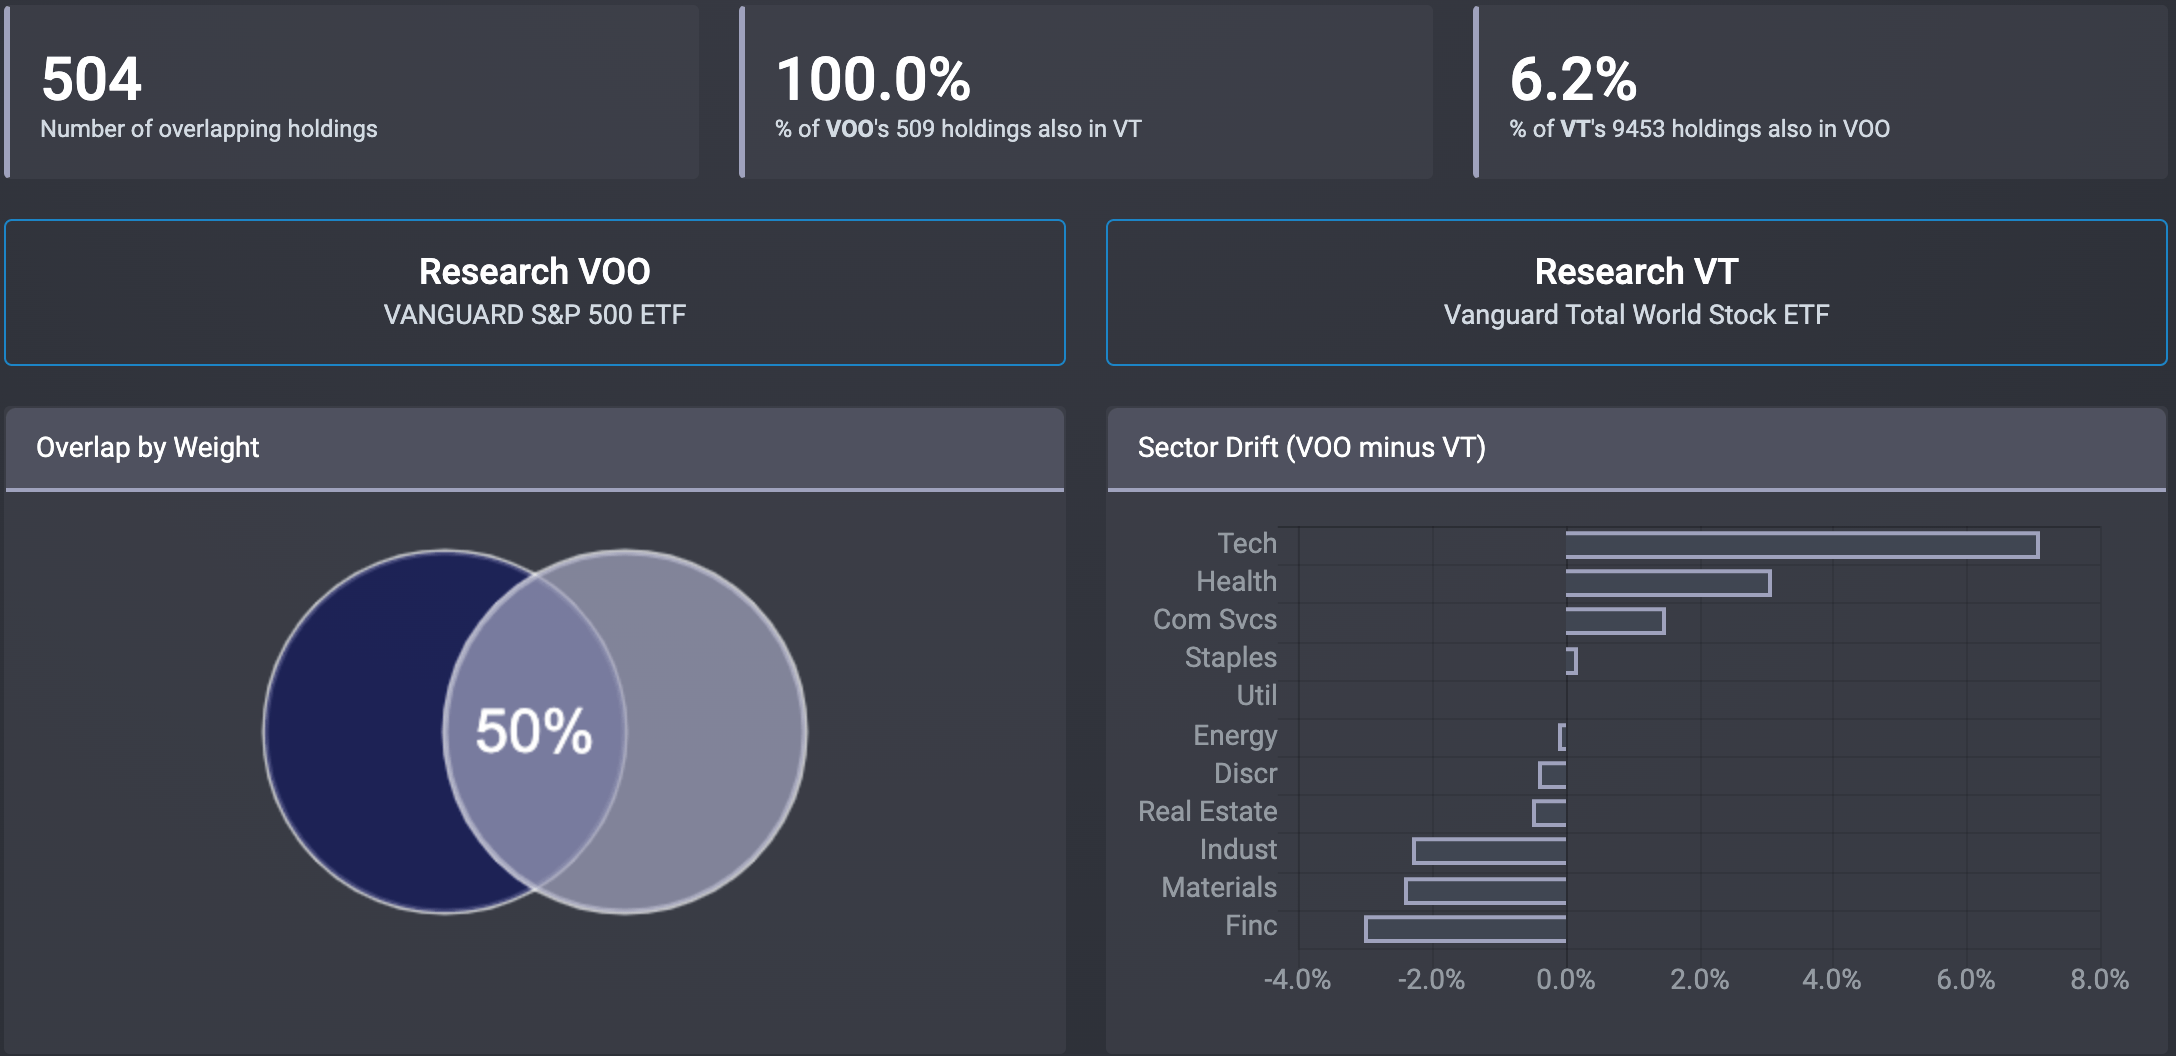
The below charts from etfrc.com shows the 50% overlap between VOO and VT, showing that all 504 components of VOO are also in VT, but these are only 6.2% of the number of names in VT. We also see that VOO is relatively more overweight technology and health care than VT, while being lighter on the financials, materials, and industrial sectors.
If we look at the performance of these three parts of VT since the launch of VXUS in 2011, we see:
- The underperformance of VTI vs. VOO over the past dozen years can be seen as the difference between the 12.3% rate of return on VOO, and the 12% return on a portfolio of 85% VOO + 15% VXF, as 0.85*12.3+0.15*10.1 = 12% per year, 0.3% per year behind VOO's recent returns.
- The lower returns of VXUS versus VOO and VTI over the past dozen years has been FAR more significant, and something we look at in more detail in point #6 below.
In theory, a totally passive global market index should have portfolio weights roughly in proportion with those of VT, with 60% in the US and 40% in non-US stocks. In practice though, many passive index fund investors seem to be significantly overweight US stocks, and especially the S&P 500, relative to international. One simple data point on the scale of this "home country" bias and preference to buy more of what has gone up more lately can be dramatically seen in the below chart of the relative AUMs of VOO, VTI, VXF, VXUS, and VT below.
#4: 30-40% of S&P 500 revenues come from outside the US, and this percentage is higher for technology companies
One statistic I would love to more easily get data on is the geographic revenue breakdowns of many different companies at once. The best high-level estimates of the percentage of S&P 500 revenues coming from overseas range from 30% according to S&P to 40% according to Global X . The Global X report also highlights that the large technology stocks have an even higher percentage of their revenue coming from foreign countries, which I highlighted in my latest Apple article where I pointed out that almost 60% of Apple's revenue comes from non-US sources.
Cross-border revenue of course goes the other way as well, with 30% of the revenue of the second largest VXUS component, Swiss food giant Nestle, coming from the US alone (source: Nestle 2021 annual report , page 47). So in other words, the geographic decision between whether to invest in Apple or Nestle has less to do with whether you are more bullish on revenues from US or Swiss sources, but rather on which company you expect to best deliver you profits from their global sources.
There are many investors who argue that the S&P 500 provides enough international diversification for many investors, based on how geographically diverse the sources of the S&P 500's revenues are. I myself prefer to overweight non-S&P 500 stocks not because I believe they necessarily capture revenues from faster growing economies, but because in many cases, those foreign stocks offer me those earnings at much better valuations.
#5: The S&P 500 is more expensive than the other half of the global stock market
One simple clue that US stocks may be relatively overvalued versus foreign stocks is that despite being valued at 60% of the global stock market, the US has reported a trade deficit every year since 1991, now exceeding $800 billion per year or almost 4% of GDP . This next chart shows the remarkable trend over the past 50+ years of how the US share of global GDP has declined from almost 40% to below 25%, while the value of US stocks divided by that GDP (sometimes called the " Buffett Indicator ") has doubled from around 70% to around 140%.
YCharts
While there are many more direct ways to measure the relative valuations and expected future rates of return of VOO versus VXF vs. VXUS, one quick source I often check are data provided directly on the Vanguard's fund fact pages . Below is a quick table I put together comparing five metrics of VOO vs. VXF vs. VXUS:
| VOO |
| VXF |
| VXUS |
| Price/Earnings |
| 19.1 |
| 12.5 |
| 11.2 |
| Price/Book |
| 3.6 |
| 2.2 |
| 1.5 |
| Dividend Yield |
| 1.6% |
| 1.2% |
| 3.1% |
| Return on Equity |
| 23.3% |
| 8.3% |
| 12.4% |
| Earnings Growth Rate |
| 19.4% |
| 16.3% |
| 9.8% |
Source: Vanguard
Some thoughts I might summarize from the above table, in bullet points:
- VOO is significantly more expensive than both VXF and VXUS on a Price/Earnings and Price/Book basis.
- VXUS's dividend yield is almost double that of VOO. VXF on the other hand has a significantly lower dividend yield than VOO, which might be related to the next point about VXF's companies being on average less profitable than those in VOO or VXUS.
- As measured by Return on Equity, VOO's portfolios of companies seem to be about twice as profitable as those in VXUS and three times as profitable as VXF's. While many top VOO components are genuinely very profitable, some of the elevation of ROE rates in US large caps has been due to shrinking of the book value denominator through buybacks, as I illustrated using McDonald's as an example .
- Finally, stocks in VOO seem to be enjoying an earnings growth rate around double that of VXUS, though I would want to check how this is calculated and what this might look like on a forward-looking basis.
#6: Multiple expansion explains the S&P 500's outperformance since 2008
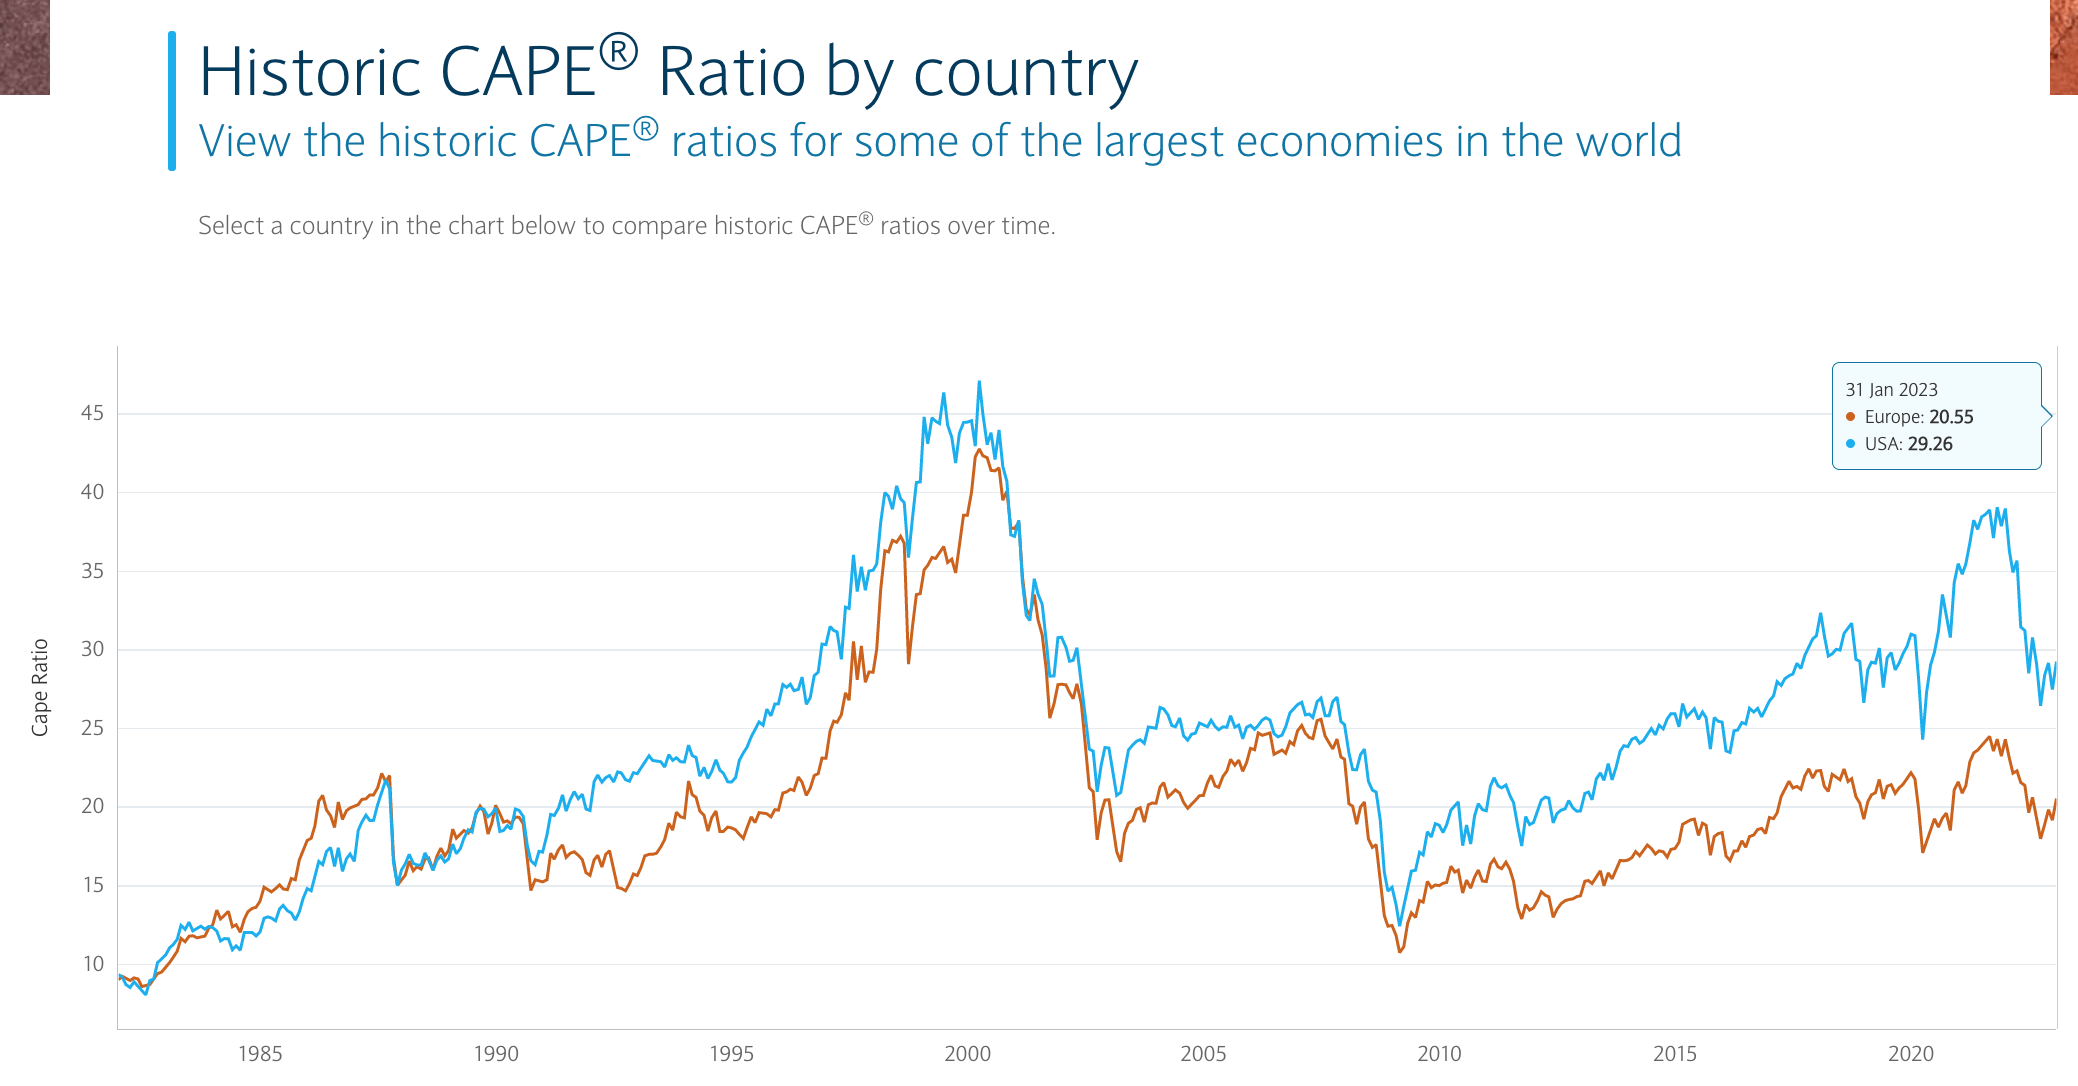
This next chart comes from Barclays , and shows the cyclically-adjusted price/earnings ratio or "CAPE" of US stocks versus European stocks from 1982 to the start of 2023. What this shows is that the valuation multiples on the two stock markets started diverging significantly since the 2008-2009 global financial crisis, and this change in valuation multiples explains much of the outperformance of VOO over VXUS in those years since. Past performance is of course not by itself predictive of future results, but it seems that expecting another decade of VOO outperforming VXUS would require expecting another decade of VOO's valuation multiples continuing to increase faster than VXUS's as well.
#7: The S&P 500 can be surprisingly well tracked with 50, 30, or even 5 stocks
Despite being made up of only 30 rather than 500 stocks, and weighing those stocks completely differently (by price rather than by market value), the SPDR Dow Jones Industrial Average ETF ( DIA ) tracks SPY amazingly well over both long and short periods of time. For purposes of understanding how performance breaks down into earnings growth versus multiple expansion, I have long argued that a simpler index of 30 stocks has many advantages over a broader one of 500 . I have also argued that investors seeking to build their own direct stock portfolios with deliberate deviations from the S&P 500 are often better off starting with the Dow 30, and stepping through an approach I call " Make My Dow ".
Another common comparison of how closely the S&P 500 can be tracked with a fraction of the number of stocks is by looking at the 50 largest components of the S&P 500, which is tracked by the Invesco S&P 500 Top 50 ETF ( XLG ). As the below chart shows, the "eyeball estimate" of tracking error XLG sees versus SPY really does not look that much different from what we saw with DIA above.
One experiment I found even more surprising was how closely I was able to track the returns of SPY or VOO using just 5 stocks .
#8: Several simple screens have matched or beaten the S&P 500 over time
Over the years, I have looked at many, many different simple strategies for screening and putting together a portfolio of a small handful of stocks that can not only track, but preferably outperform the S&P 500 over time. Four of those strategies that I have found continue to work well and I continue to incorporate in my portfolios include:
- Growth at a reasonable price , aka "GARP",
- Buying stocks that consistently raised their dividends aka "dividend achievers",
- Focusing on stocks with the best reputations, aka the " most admired companies ", and
- Overweighting stocks whose reputations are improving over time, a factor I sometimes call " brand value momentum ".
The first of these can be tracked with the Invesco S&P 500 GARP ETF ( SPGP ), which since its 2011 launch really only started outperforming since 2017.
For the second of the above screens, I was surprised to see that there don't seem to be any S&P 500 "dividend achievers" ETFs, but rather only the ProShares S&P 500 Dividend Aristocrats ETF ( NOBL ), which has the stricter requirement of 25 years of dividend increases rather than just 10. NOBL's returns have lagged those of SPY since the former's 2013 launch, which is different than the results I got starting in 1996.
For the third and fourth screens above, I know there used to be a brand value ETF which has since closed, so for now, factoring in how admired a company is and whether its brand value is rising or falling is something I have been accounting for manually.
#9: Equally-weighting the S&P 500 has beaten the S&P 500 over time
A much simpler twist on the S&P 500 which seems to have done consistently well at outperforming SPY over time is to simply buy the same 500 stocks as SPY, but to equally weight them rather than weighting them by market cap. This is what the Invesco S&P 500 Equal Weight ETF ( RSP ) has been doing since 2004, since then it has outperformed SPY by an average of 1% per year. There are two often-cited explanations for why this simple change in weighting methodology has added a return premium over time:
- RSP allocates significantly more to smaller companies in the S&P 500 than SPY, so to the extent that smaller stocks have higher expected returns than larger stocks, it captures some of that premium, and
- Since RSP needs to periodically rebalance to maintain equal weighting, it needs to sell stocks that have gone up and buy more of the stocks that have gone down. This may give it a bit of a value tilt along with profiting from simple mean reversion of stock price fluctuations over time.
#10: Despite the past decade, value has beaten growth over time, but growth funds got more assets due to recent outperformance
The first ETFs to separately track the S&P 500 Growth and S&P 500 Value benchmarks were issued by iShares just one week after they launched IVV, those are the:
I have long criticized growth and value ETFs like these for being way too "shallow" in their tilts towards growth and value , as even over a period like the past 23 years we see only relatively minor back and forth periods of outperformance and underperformance like what is charted below. One simple narrative on the below chart is that IVE looks like the "tortoise" while IVW is the "hare", with IVE falling more in the 2000-2002 bear market, then racing ahead faster from 2009-2021, then declining more significantly again in 2022. Looking at the rates of return over this whole period, you could be forgiven for thinking it might make no difference whether you pick IVV, IVW or IVE, though investors like me tend to prefer "the tortoise" that more steadily avoids declines like those in 2000-2002 and 2022.
Despite all that has been written about how value tends to do better over long periods of time, it seems that the S&P 500 funds tilted towards growth have managed to raise and maintain significantly more in assets than those tilted towards value. I find this especially remarkable seeing how the AUM of the Vanguard S&P 500 Growth ETF ( VOOG ) is more than double that of the Vanguard S&P 500 Value ETF ( VOOV ), given Vanguard customers' reputation of being long term, rational, and patient investors. I have to wonder if even Vanguard investors have been lured too much by the past decades outperformance of growth over value in steering more assets to VOOG than VOOV.
#11: S&P 500 sectors provide a more colorful picture of returns
2023 is the 30th anniversary of SPY, but also the 25th anniversary of the launch of the Sector SPDRs , which I like because many of these ETFs have liquid options that trade in small sizes, enabling a good amount of fine-tuning of exposure to S&P 500 sectors. I believe many investors who follow the S&P 500 should have at least a few of these on their watchlists or dashboards, the list of all 11 being:
- Technology Select Sector SPDR Fund ( XLK )
- Financial Select Sector SPDR Fund ( XLF )
- Health Care Select Sector SPDR Fund ( XLV )
- Energy Select Sector SPDR Fund ( XLE )
- Consumer Discretionary Select Sector SPDR Fund ( XLY )
- Industrial Select Sector SPDR Fund ( XLI )
- Utilities Select Sector SPDR Fund ( XLU )
- Consumer Staples Select Sector SPDR Fund ( XLP )
- Materials Select Sector SPDR Fund ( XLB )
- Communication Services Select Sector SPDR Fund ( XLC )
- Real Estate Select Sector SPDR Fund ( XLRE )
The total return chart of the nine of these Sector SPDRs going back to 1998 is well worth studying, as it shows how XLK was very much the "hare" sector over the past 25 years while XLP and XLV have been relative "tortoises". XLE and XLF also seemed to be relatively strong performers in their first decade, and relative laggards since.
#12: Even many religious and ESG ETFs start with the S&P 500
If I needed any more proof that the S&P 500 has become "the standard", it is seeing how even many portfolios based on religious or environmental conviction prefer to start with the S&P 500 rather than create their own index from scratch. Four ETFs I might mention here are:
- SPDR S&P 500 ESG ETF ( EFIV ),
- Xtrackers S&P 500 ESG ETF ( SNPE ),
- Global X S&P 500 Catholic Values ETF ( CATH ), which I reviewed here , and
- For Muslim investors, the SP Funds S&P 500 Sharia Industry Exclusions ETF ( SPUS )
As with my article on CATH, each of these deserves their own article on what each excludes or overweights, but I do think anyone who wants to deeply understand the S&P 500 should be aware of these variants based on it.
#13: Watch SPXB to see the borrowing costs of SPY components
In a business school case study, I remember reading that the objective of a CFO is to maximize total returns to shareholders, while minimizing total returns to bond holders. An S&P 500 component company can do this by maintaining a very good credit rating, and so borrowing at a low interest rate not much higher than where the US treasury borrows, but also by borrowing more at long-term fixed rates when rates are low, and less when rates are high. The ProShares S&P 500 Bond ETF ( SPXB ), which only buys corporate bonds issued by S&P 500 companies, seems to have somewhat succeeded in that by averaging a rate of return 0.4% per year below that of the Vanguard's benchmark of intermediate term corporate bonds. That return is also only about 0.8% per year more than Vanguard's benchmark of what the US treasury itself has paid to bondholders.
#14: Even in Europe, S&P 500 ETFs top the lists
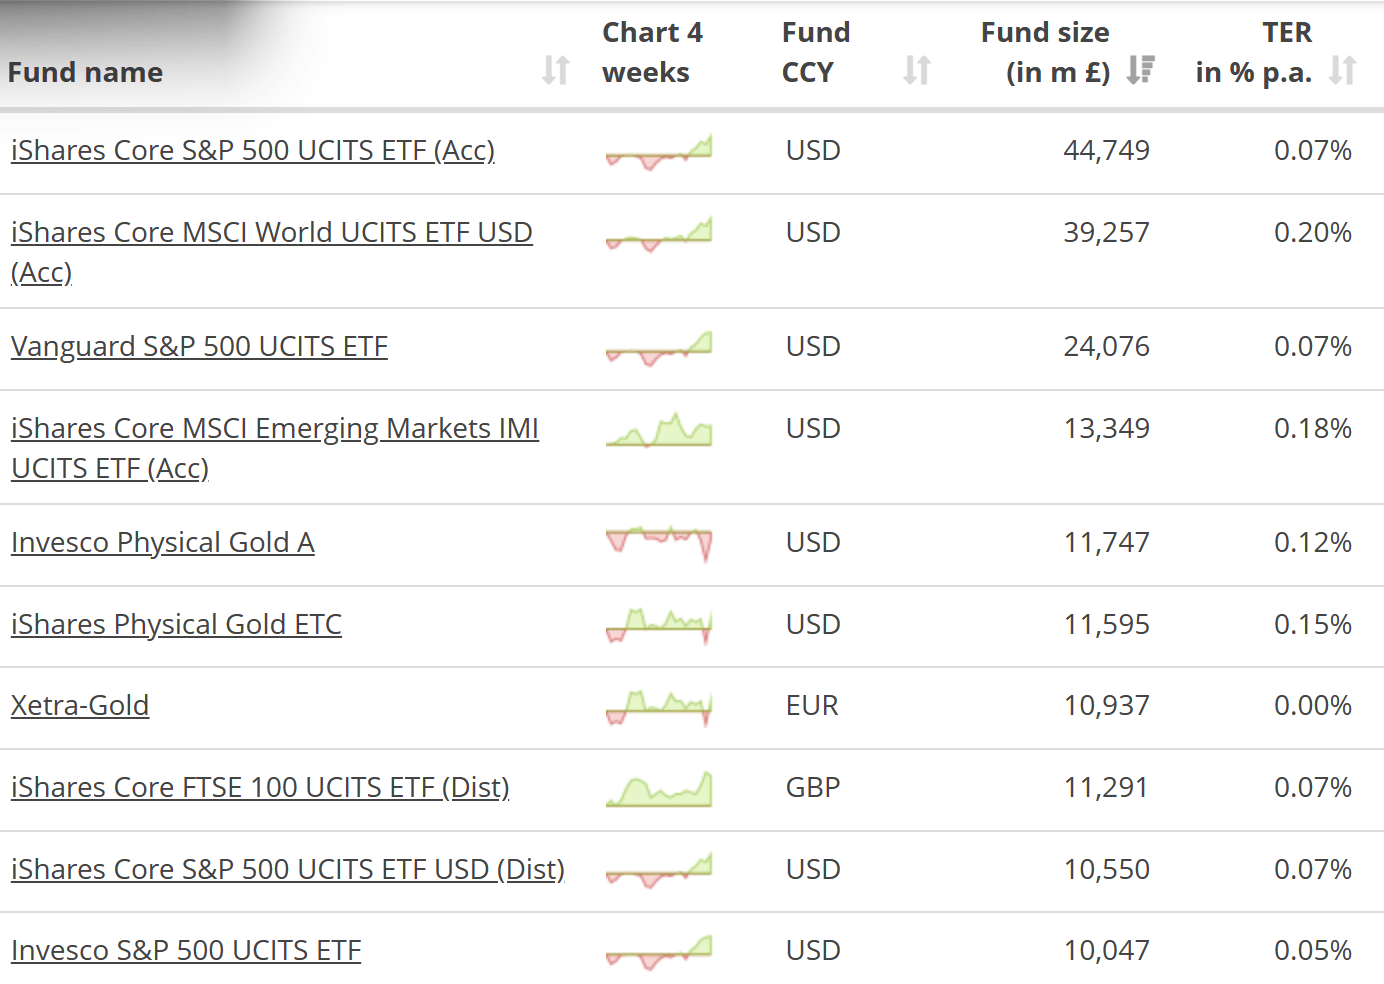
Across the pond, I have long been surprised to see that the most popular ETFs listed on European exchanges are not ones tracking European or global benchmarks, but rather, the American S&P 500. According to the JustETF screener ranked by AUM, four of the ten largest European-listed ETFs by assets track the S&P 500, though to be fair, two of them are share classes of the same iShares ETF (one which accumulates/reinvests dividends, the other distributing them). For investors residing in a country without a US tax treaty to reduce the 30% default withholding rate on dividends, the extra 0.04%/year expense ratio of one of these funds is often worth the significant reduction of that withholding tax to the 15% rate under the Ireland or Luxembourg treaties. These assets are still only a fraction of those seen in US funds, but I believe it is remarkable how even many foreign investors seem to strongly prefer the S&P 500 over other benchmarks.
#15: For many traders, futures may be better than SPY, especially for leverage or shorting
According to the CME website , advantages of trading the S&P 500 with their "e-mini" futures contracts instead of with ETFs include claims that their futures:
- Trade seven times more per day than all S&P 500 ETFs combined
- Trade 2.5 times more per day than the entire U.S. ETF market
- Trade more before the U.S. cash market opens than all three S&P 500 ETFs trade all day
- Offer lower transaction costs and cheaper leverage for tactical, active, short, and leveraged investors
- Offer a more tax efficient investment for international investors
The trading volume numbers probably won't make a significant difference to most investors reading this who trade less than a few billion dollars' worth of S&P 500 each day. In my view, it is the fourth and fifth points that are more significant advantages of these futures contracts over SPY or VOO. I won't comment on transaction costs, but in terms of leverage, shorting, or tax efficiency for foreign investors:
- I can get long exposure to about US$20,000 worth of the S&P 500 per micro e-mini future using only a few thousand dollars of my account's margin value. To get the same amount of exposure via 50 shares of SPY, I would either need to pay the full $20,000 in cash or pay margin interest to borrow much of that $20,000.
- I can get short exposure on about US$20,000 worth of S&P 500 per micro e-mini future by using only a few thousand dollars of my account's margin value. To get the same exposure via SPY, I would need to borrow 50 shares of SPY and pay the borrow cost on those shares.
- A foreign trader holding 200 shares of SPY would expect a gross dividend of around US$1,260 per year, of which up to 30%, or $378, may be withheld as withholding tax. Also, if that foreign investor were to die holding those shares, then the value over $60,000 may be subject to US estate taxes . On the other hand, holding the same S&P 500 exposure through a long position in 4 micro e-mini futures would have no dividend flows, so no explicit withholding taxes, and if properly managed not leave significant US situs assets that might be exposed to estate taxes.
Since 2006, there have been ETFs that have been trying to provide the greater efficiency of using futures for leverage or short selling in a more convenient wrapper. The first two of these were the ProShares Ultra S&P 500 ETF ( SSO ) and the ProShares Short S&P 500 ETF ( SH ). The big disadvantage of these ETFs is that they rebalance daily, meaning SH reduces its exposure after the market falls and increases it after the market rises, which is the opposite of "buy low, sell high". The effect of this in the 16.5 years since SSO's launch are seen in the below chart, where despite taking 2x the risk, SSO has delivered only around 1.3x the return of SPY over this period.
Similarly, even if you were right about SPY declining by 7.83% from February 1st 2022 to February 1st 2023, buying SH would have only delivered a return of +5.53% over that period. This is because SH increased its exposure as the market fell, before it recovered, and decreased its exposure after it rose reducing the amount of the next decline it captured.
In contrast with SSO or SH, an investor with $10,000 in a margin account who can simply roll a single long or short micro e-mini contract every quarter would not face the disadvantages of this daily rebalancing, but rather get "purer" leveraged or inverse exposure to this index.
#16: For options, look at index options, SPY, micro e-minis, then nanos
If the choices between the different S&P 500 ETFs, futures contracts, and leveraged and inverse products was starting to get confusing, I'll try and end the confusion with this point on options trading before moving on to the points on the S&P 500's fundamentals. For trading options on the S&P 500, my "go to" order of preference is as follows:
- CBOE SPX options are the original cash-settled options directly on the S&P 500 index, with liquid expirations going out almost five years (now until the end of 2027). The big disadvantage with these is that they trade in large, chunky sizes of $100 per index point, so currently around US$400,000 notional value per options contract.
- Options on the SPY ETF are my second choice, with more than enough liquidity out to around three years expiry (currently out to the December 2025), and with a notional value of 100 shares of SPY, or around US$40,000 per contract, are a much more manageable 1/10th the size of the SPX contracts.
- Options on the CME micro e-mini futures have two advantages over SPY options: a) they are half the notional size, at $5 per index point or around $20,000 per option contract, and b) I can trade them long before the US exchanges open, which is very helpful since I spend most of my time in Europe and Asia. The big disadvantage of these options is that their expiries only go out a few months, not years, currently only to June 2023.
- Finally, for a complete discussion on trading options on the S&P 500, I find it worth mentioning the CBOE nanos options . I would almost describe these as "cute" with a notional value of $1 per point of an index defined at 1/10th the value of the S&P 500 index, meaning that the notional value of each of these options contracts is a mere $400 (yes, that's not a typo, I really mean four hundred dollars ). While I appreciate the fine-grained position sizing that might be possible with contracts this finely sized, I find these contracts useless with expiries that only seem to go out about a week or two, when I prefer to put on option positions going out months or years. That said, I mention them here in case a reader finds this a more useful tool for trading S&P 500 exposure than I do.
So of these four different ways of trading options on the S&P 500, it is the second option above, options on SPY, that I find most valuable most of the time as they are a convenient enough size and go out long enough to be useful. While there are also options on VOO and IVV, SPY options have been my go-to simply because they have never let me down in terms of being able to execute at my choice of expiration dates.
Conclusion
As mentioned in my introductory bullet points, I would be very surprised if more than 1/4 of the readers of this article were to tell me they already knew more than 4 of the 16 points written above before reading this article. In my experience, many traders and investors use the S&P 500 so that they don't have to know what is in it, and I believe it is very important to address that by listing things like these I believe well-informed investors should know about this index. More important than "testing" readers on this though, I hope that these 16 points can serve as a useful reference to your understanding of the S&P 500 for many years to come, and make you a far more informed user of it.
For further details see:
S&P 500 ETFs: 16 Things Smart Investors Should Know