AFMC - S&P 500 Has Reached A Line In The Sand (Technical Analysis)
Summary
- The S&P 500 has tested the 0.5 Fibonacci Retracement.
- Most bear markets end when the 0.5 retracement is successfully breached.
- Leading indicators suggest that the bottom is not in for the S&P.
- The "line in the sand" is around 4,250.
- A picture is worth a thousand words, but a chart is worth a thousand pictures.
Equities have experienced an impressive rally over the past five months equal to a 50% retracement of the bear market losses in the S&P 500. While many are soundly convinced that the bear market is now over, I remain skeptical.
The 0.5 Fibonacci retracement is a key level that is commonly reached during bear markets but, in the case of the S&P 500, has never been successfully breached during a bear market over the last 77 years .
This makes the 0.5 Fib a proverbial "line in the sand." To cross it with earnest would be a significant signal that the bear market is likely finished. Needless to say, I'm keeping a close eye on it.
Track Record of the 0.5 Retracement
The S&P 500 today has spent three days above the 0.5 Fib retracement level as measured from the highs in January 2022 and the lows in October 2022. The index has since rejected the level. I'm watching the 4,200 level for a possible retest and successful breakout. At this time, the daily RSI is pulling back from reaching overbought territory.
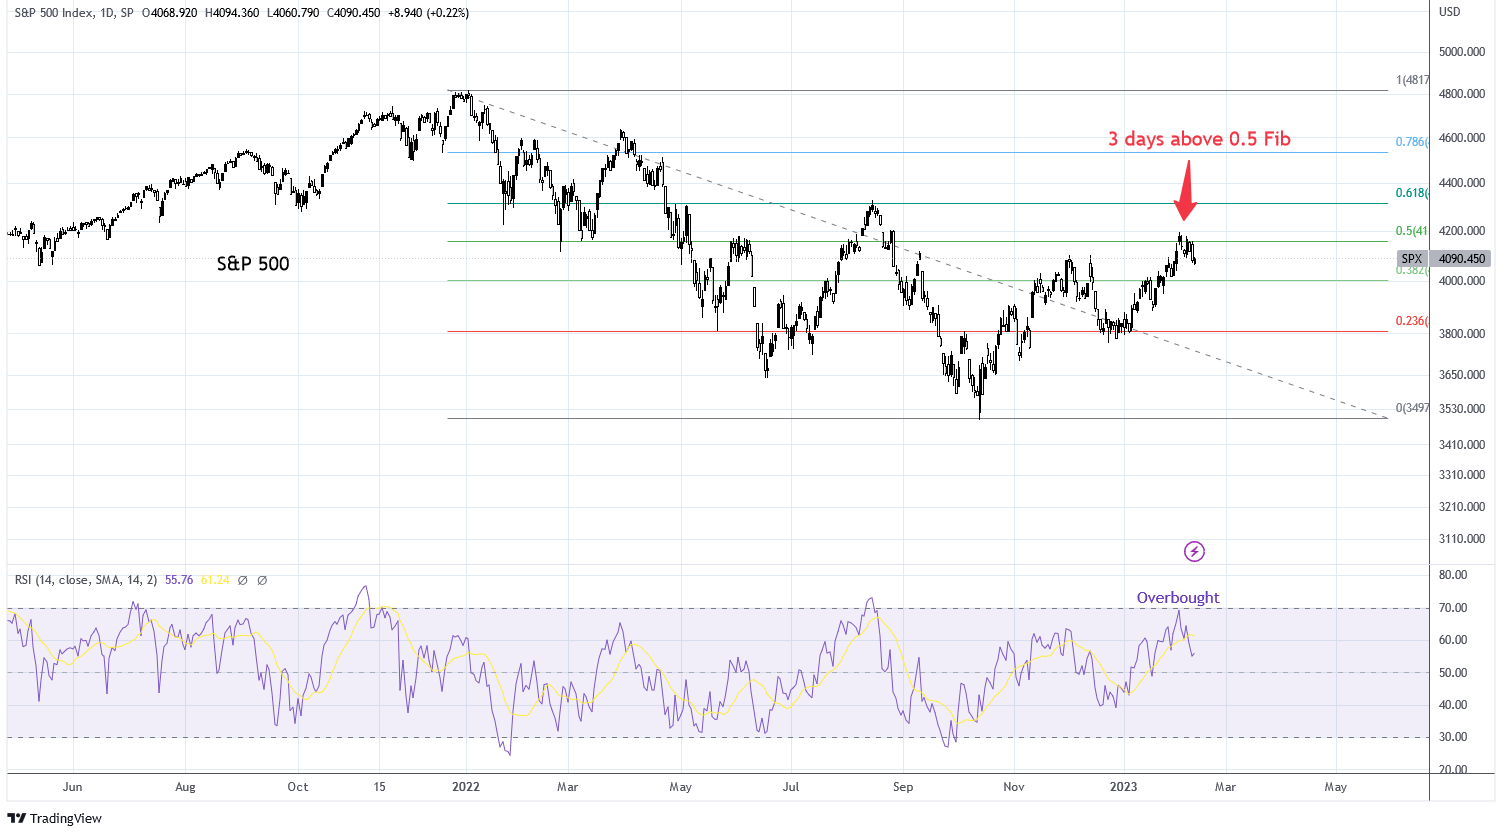
Charts by TradingView (adapted by author)
Looking back at the 2008 bear market, we can see that the S&P 500 also reached the 0.5 Fib retracement level, twice. It reached the 1,417 level for three days, declined, and then breached the level on the retest. It actually made it halfway to the 0.618 Fib retracement level before the bear market continued. Daily RSI was near the overbought territory.
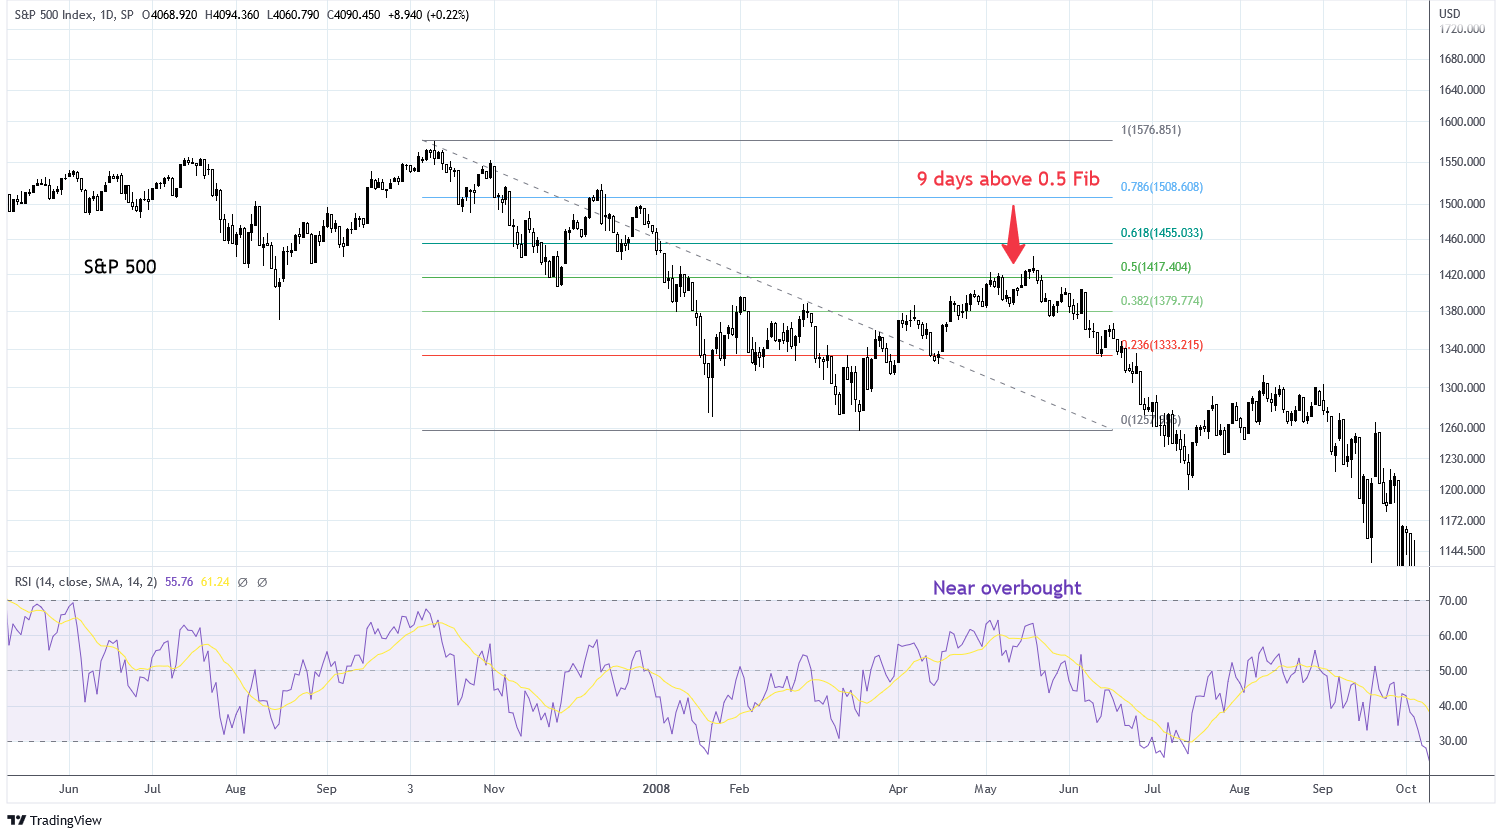
Charts by TradingView (adapted by author)
The bear market of 2001 produced a 0.5 Fib retracement that lasted three days before turning over. This also coincided with the daily RSI reaching overbought territory.
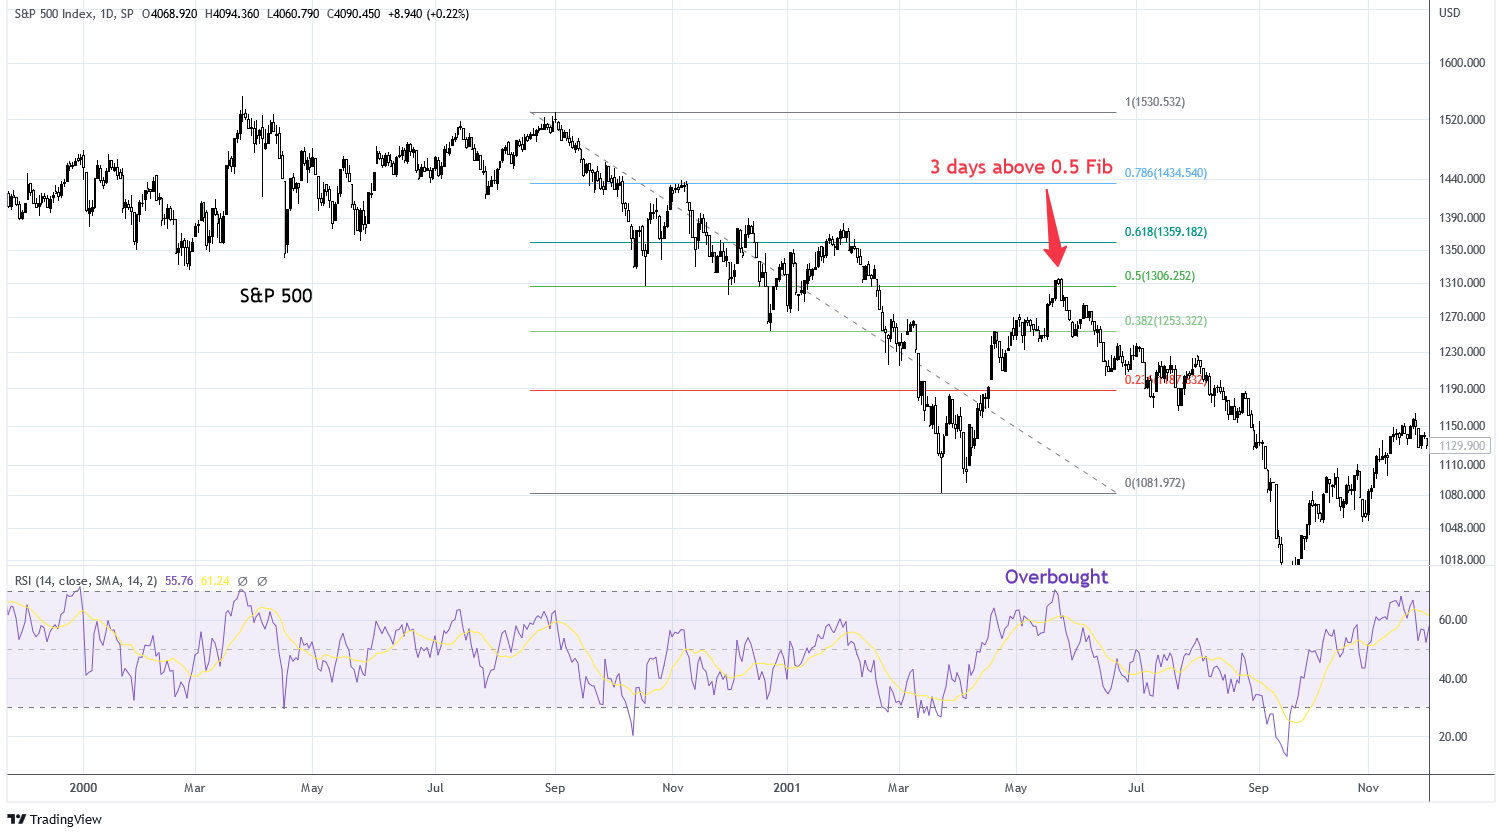
Charts by TradingView (adapted by author)
Based on history, current market action is not uncharacteristic of a bear market. Typically, major bear markets will rally to the 0.5 Fib retracement level at least once. But for decades, bear markets have not breached the 0.5 Fib retracement level. The 2008 bear market was one of the closest bear markets to do so. What this means to me is that the 4,200 level on the S&P 500 will put me on high alert for a signal that the bear market is over with confirmation at the 4,300 level.
The Bear Case
At the end of the day, market price action is everything. This is why technical analysis is key. But for fundamental reasons, my base case is that the bottom in the S&P 500 is ahead. This expectation is largely centered around the probability of an earnings recession which will be difficult to manifest without weakness to employment.
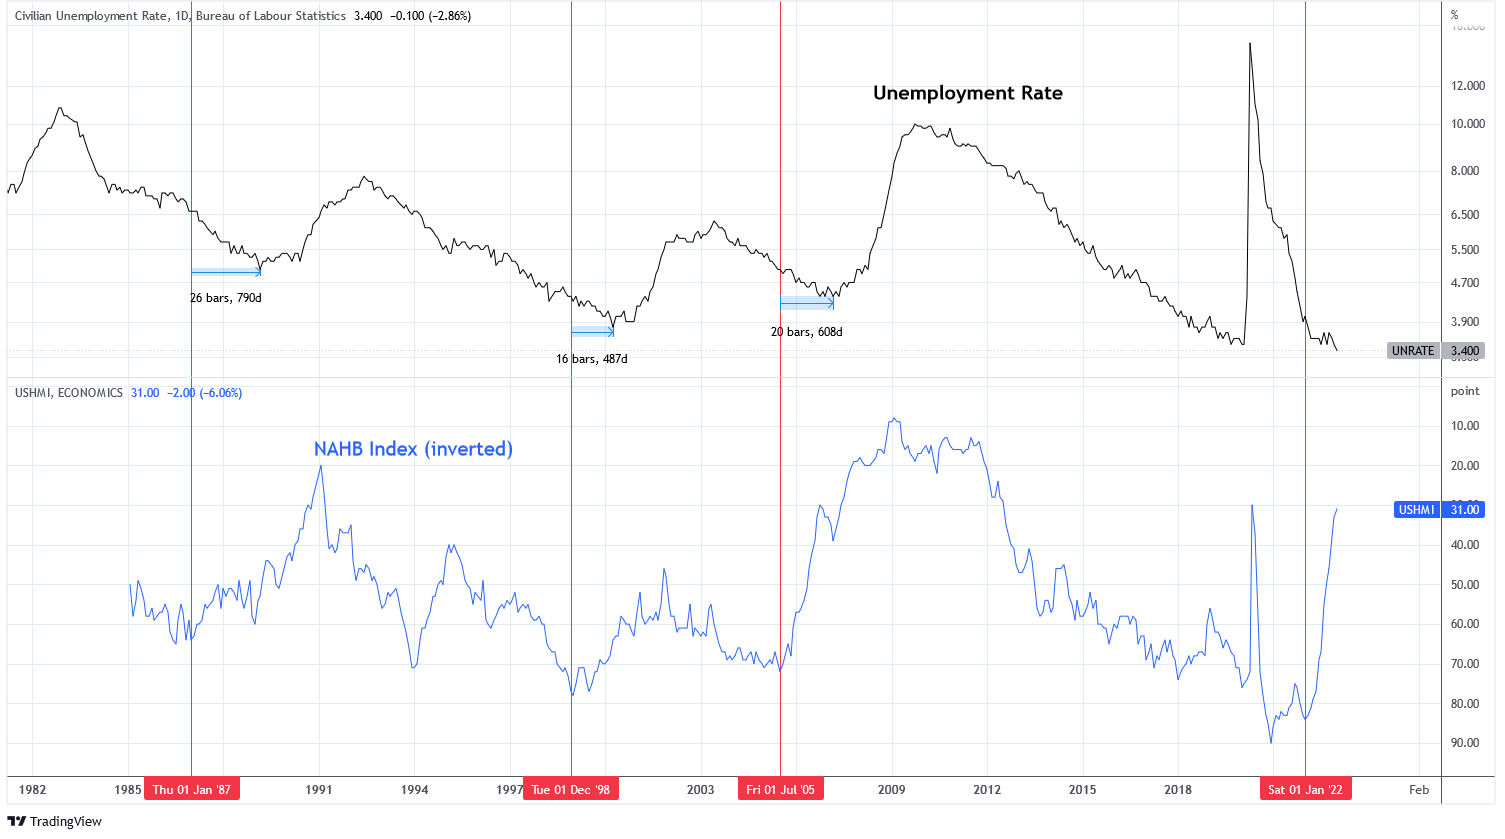
The U.S. unemployment rate is the lowest in 53 years at 3.4%. There are no indications from this current data of labor weakness. But each of the past four recessions were preceded by low unemployment.
One of the leading indicators that I prefer to use for forecasting unemployment is the National Association of Home Builder index ((NAHB)). When the index falls, it often precedes a rise in unemployment. With the exception of the 2020 COVID recession, where people were laid off immediately by mandate, the last three major recessions saw a decline in the NAHB about 790, 487, and 608 days prior to the bottom in unemployment.
The NAHB index has declined from 84 in January 2022 to 31, a significant and rapid deterioration. I am measuring off the more recent high in January 2022 instead of the high set in December 2020 which may be an outlier as a result of the bullwhip effect coming out of the 2020 lock-downs. Using this date, we would expect the bottom in unemployment to be reached between May 2023 and March 2024.
Charts by TradingView (adapted by Author)
One of the reasons why employment remains strong during this period is the effect of employers hoarding employees because of a tight labor market. This tightness in the market is a result of the events related to COVID, including:
- Significant numbers of employees that were laid off and are not returning to their prior occupation,
- Numerous employees that decided to retire to avoid consequences of COVID in the workplace,
- Countless others that have changed their employment status either because they were inspired to change their lifestyle or achieved financial freedom during the impressive gains in financial assets as a result of stimulus.
It would be different if the labor market was starting from a baseline. Instead, starting from a deficit means there is extra ground to cover before resulting in real losses to employment. I think this is the top reason why market participants are so skeptical of the indicators that forecast recession. Every "time" is different and this is one of the differences today.
Leading Indicators
Leading indicators are pointing toward recession. The Conference Board US Leading Index is convincingly in recession territory with a consistent track record over the past 60 years. The 10Y-2Y Treasury Yield curve is the most negative since the 1980s at -0.76 while the 10Y-3M curve is shockingly negative at -1.0. These economic indicators suggest nothing but recession.
The Daily Shot (used with permission)
The Morgan Stanley Leading Earnings Indicator is forecasting a YoY decline in S&P 500 earnings of nearly 10% in 2023. I think that given the momentum of the economic data this will prove to be the minimum amount of decline with my base case looking at -15% by the end of 2023 or beginning of 2024.
The Daily Shot (used with permission)
The correction in the S&P 500 so far has mostly been to valuations after reaching an adjusted operating earnings P/E of 24 in late 2021. At a P/E of 18.76 today, the index is fairly valued if earnings do not decline .
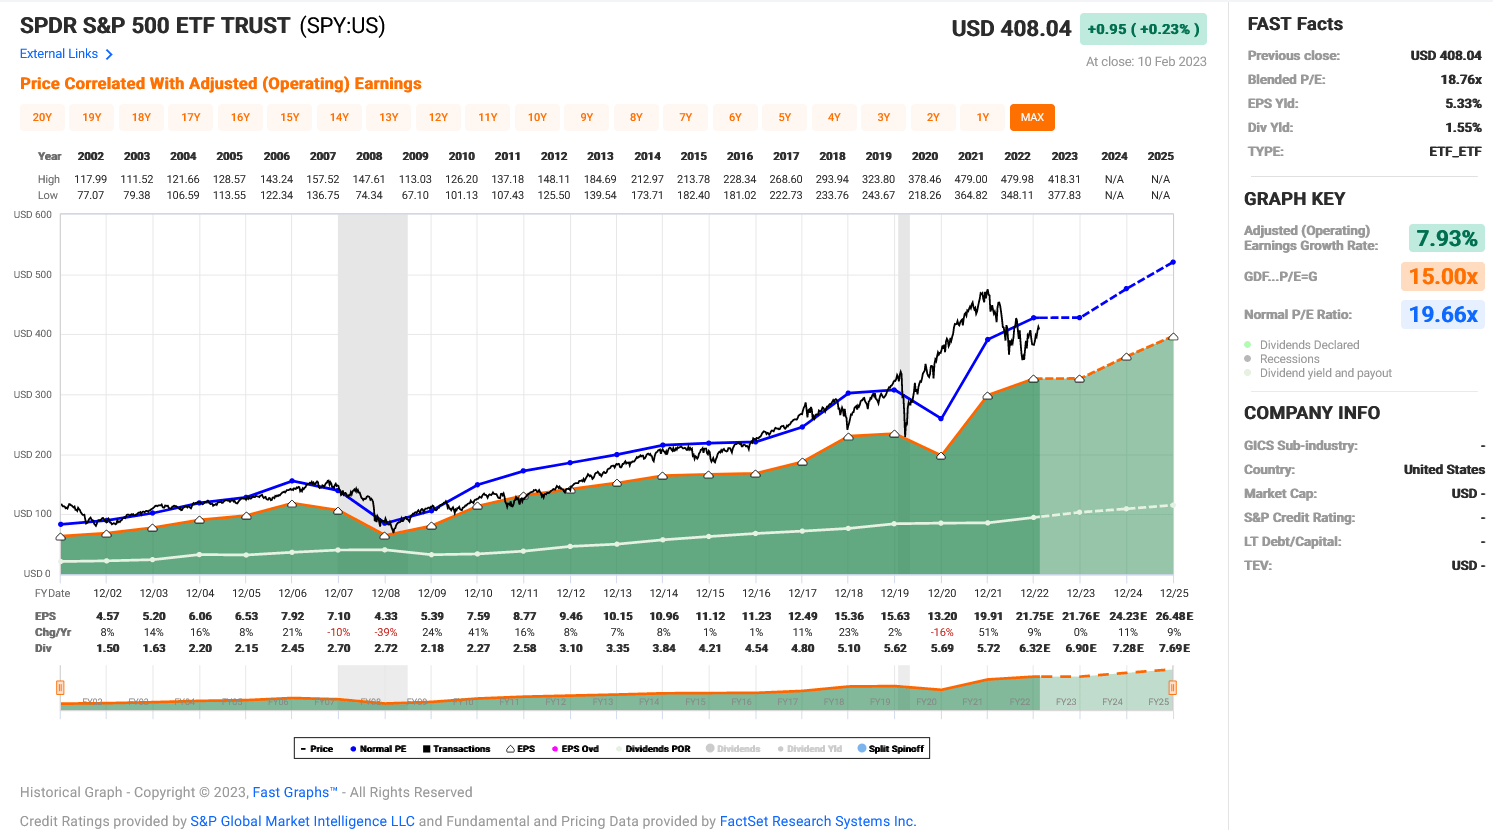
FAST Graphs
Given that I expect an earnings decline of 15% over the next 4-5 quarters, that would put the S&P 500 at about 3,300 and a new low for the bear market. Last week I added to my put positions on the S&P 500 with a stop loss at 4,300. I still have significant buying power in reserve because I expect the market may be range bound for weeks.
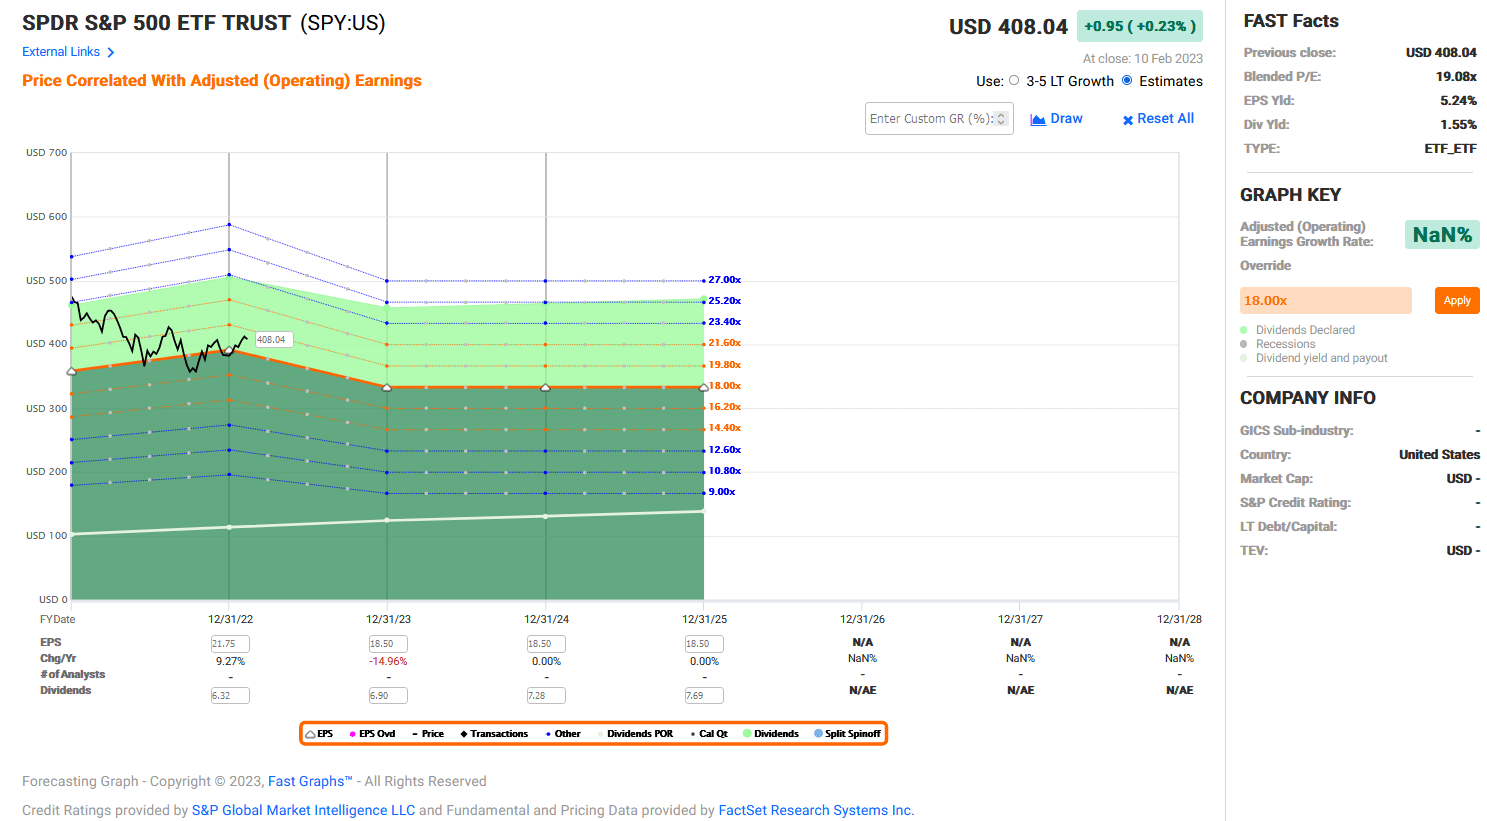
FAST Graphs
Risk to the Thesis
There are several risks to this investment thesis. First, of course, is that the recession does not materialize. At the moment, employment remains strong (as we've discussed) and household balance sheets are relatively strong despite low savings rates and increased credit balances. The housing market is exhibiting some weakness but the potential for a catastrophic event is low. I'm currently writing an article on the subject which is going to be a deep dive into my thoughts on the housing market , you don't want to miss it.
Another risk is an actual pivot to monetary policy. If the Federal Reserve transitions from removing liquidity from the financial system to adding liquidity that would change my thesis and I would react immediately. I've written on this subject often and in my opinion the pivot is not imminent. There are other sources of liquidity for the market and a significant one is the Treasury Department. Due to the debt ceiling, the Treasury Department is having to postpone new borrowing and use funds from the Treasury General Account which is adding liquidity to financial markets. Further liquidity would nullify my thesis.
One other risk to consider is that the market has already priced in the recession and associated earnings decline. This is plausible, given that equity markets are very effective at bottoming before the end of recessions. For this to be true today, the equity market would need to price the recession before it officially began, before the yield curves flattened, before the Fed pivoted, and before employment weakened. That is a very uncommon phenomenon.
Summary
The current equity rally is challenging the bear market narrative. By testing the 0.5 Fibonacci retracement, the S&P 500 is sitting on the edge of a new bull market. History shows that bear markets consistently end when the 0.5 retracement level is successfully breached. For today's market, that signal would be about 4,250 on the S&P.
Fundamental economic data causes me to lean towards further downside in equities due to recession and decline in earnings. Two factors that I think are confusing investors is the prolonged strength in the labor market and added liquidity from the TGA. In contrast, I think the bear case is alive and well. But price action has reached a line in the sand, and if that line is crossed, I will have to change my thesis.
Finally, we haven't discussed inflation in today's discussion. I've written on the subject prior. The next CPI print could be hot or cold and the market may react aggressively to it but I don't think the inflation picture changes this thesis, at present.
What do you think, will the S&P 500 make new lows? Leave a comment below.
For further details see:
S&P 500 Has Reached A Line In The Sand (Technical Analysis)