XLC - S&P 500 In 2024: Bear Market Before All-Time High
2023-12-21 11:39:11 ET
Summary
- As always, analysts remain upbeat on corporate America over the coming year, however, Wall Street isn't as optimistic about the S&P 500 as it usually is.
- We see 2024 unfolding in a V-shape similar to the 2022-2023 (combined) pattern: Big dive first, (though not as) big recovery later.
- The bigger and later (in the year) the dive - the harder it will be for the following recovery to fully compensate for the decline.
- The election tends to be a positive catalyst, however, if the S&P 500 reaches a bottom late in the year there won't be enough time for a full recovery.
- Overall, we believe that the dive is going to be big enough and the bottom won't be reached before mid-year, consequently seeing the index ending 2024 below YE 2023 level.
Prologue
Since 1928, there have been 9 back-to-back 20%+ years for the S&P 500 Index (SP500)(SPX): 1935/6, 1950/1, 1954/5, 1975/6, 1982/3, 1995/6, 1996/7, 1997/8, 1998/9.
Not a single back-to-back 20%+ year for SPX in the 21st century.
Based on the market 2024 EPS consensus, SPX will need to trade at a forward P/E of ~23x for 2024 to become another 20%+ year.
Can the SPX rally another +20% in 2024? Possible, but not probable.
2024 will need to replicate one of two prior episodes:
- 1982/1983: Relief rally after soaring inflation led to record-high rates.
That sounds familiar, however. When 1983 started, inflation was still ~4% versus the current ~3%, i.e., more room to fall, and the Fed Funds Rate ("FFR") was nearly twice as high as its today, i.e., a lot more room to fall.
- 1995-1999: Strong belief that innovation and technology justify such unprecedented high multiples.
There's nothing wrong with strong belief, but there's something really dangerous with building your investment strategy on a "This Time is Different" approach.
Bloomberg
So no, we don't expect 2024 to look anything like 2023, but can it look like 2022?... Perhaps even better, can it look like a combination of both?
We believe that there's a good chance we will see a similar pattern, even if the magnitude might be different, either way (down or up) or both ways (down and up).
Economy (Recession?) in 2024
At the end of the day, "Recession or no recession?" - that's the question.
Normally when the Fed starts cutting rates stocks perform well, however, if a recession is part of the story - they perform poorly.
Putting it differently, tell me if there's a recession in 2024, and I'll be able to tell you how good or bad 2024 returns are going to look like...
Goldman Sachs
If you look at some models, like that of Goldman Sachs for example, the probability of a U.S. recession in 2024 is pretty low (around 15%).
However, as per Bloomberg Consensus, we're looking at a probability of at least 50%, i.e., a recession in 2024 is a real possibility/threat.
Goldman Sachs
However, based on the yield curve (inversion), not only is the probability at levels we've only twice since the 1960s, but both these cases ended in the severe economic depression.
WARNING: 2024 recession probability is at levels only seen 2 times since 1960
Monetary Policy
On one hand, over the last two months, 5-year inflation expectations have dropped about 40 bps, and they're now closing on the Fed's 2% target.
Bloomberg
On the other hand, Financial Conditions are the most loosened they've been in two years.
Goldman Sachs
Yet, investors are currently pricing 55 and 130 bps of rate cuts for 1H and FY 2024, respectively.
Goldman Sachs
That's a lot more than Fed members are forecasting, likely explaining the big-unusual divergence among strategists when it comes to where the US Treasury 10-Year Yield (US10Y) may finish 2024 at.
While TD is seeing another 94 bps move down from here (as of Dec. 18; US10Y ~3.95%), Barclays is seeing a 42 bps move up.
Bloomberg
1.36% is a huge gap - a reflection of the great uncertainty and confusion that many investors - including the (allegedly) most sophisticated ones, are feeling these days when it comes to the Fed's policy as well as the yield curve.
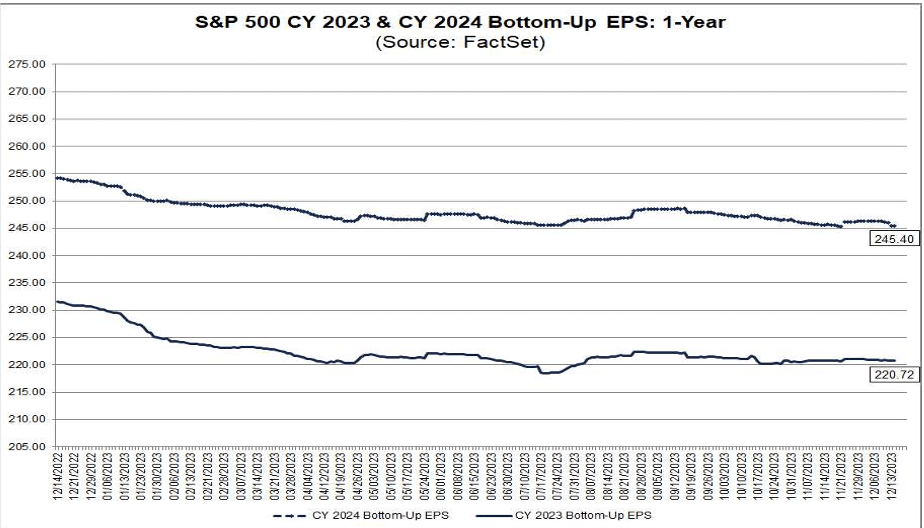
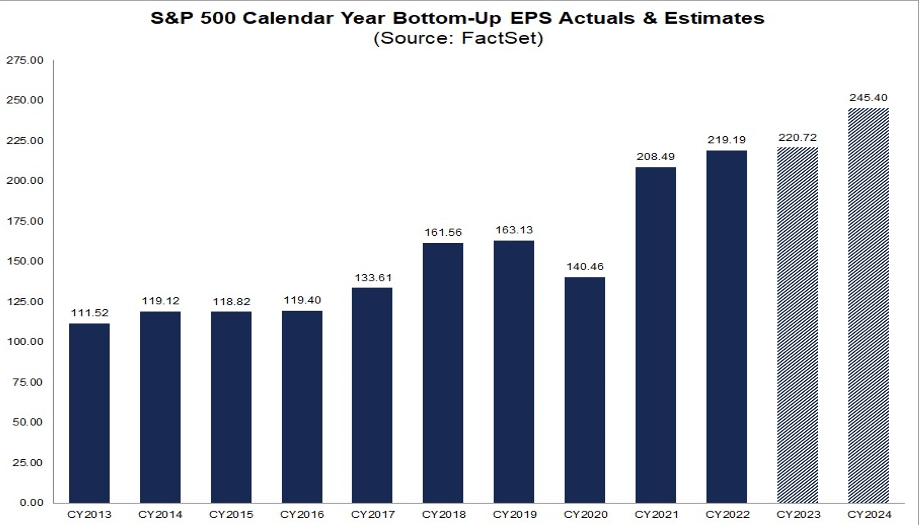
Earnings
Wall Street, like good old Wall Street, is expecting SPX EPS to grow 12% (!) in 2024. That's a lot more than the earnings growth we saw in 2022 and will see in 2023.
As a matter of fact, putting the COVID-effect aside, over the past decade the only two (consecutive) years delivered 12%+ earnings growth: 2017 and 2018.
The thing is, back then (in 2017/8):
- Inflation was lower
- FFR was lower
- US10Y was lower
- Unemployment rate was trending down
- The yield curve wasn't inverted.
Simply put, 2024 isn't going to enjoy the same favorable setup that 2017/8 did.
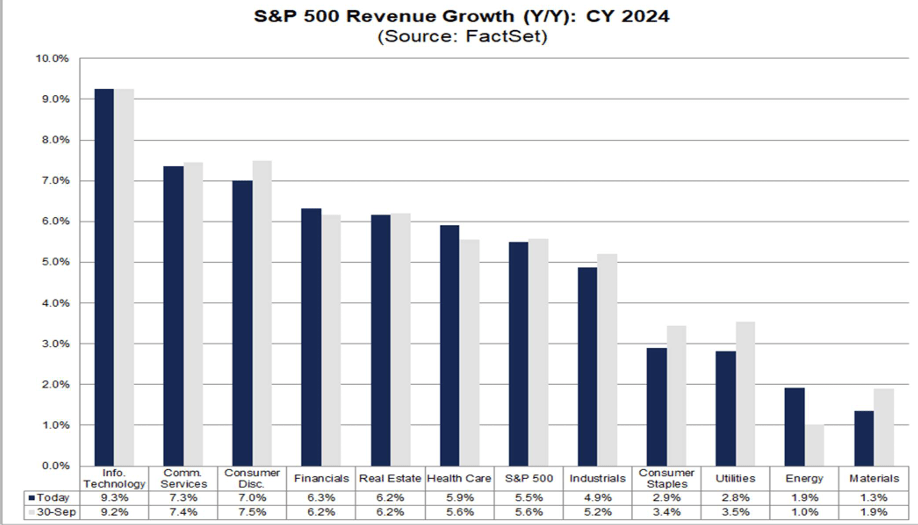
Sector Growth
Six sectors are expected to drive the SPX revenue growth in 2024: Technology (XLK), Communication Services (XLC), Consumer Discretionary (XLY), Financials (XLF), Real Estate (XLRE), and Healthcare (XLV).
[Only] Four sectors are expected to drive the SPX earnings growth in 2024: Healthcare (XLV), Communication Services (XLC), Technology (XLK), and Consumer Discretionary (XLY).
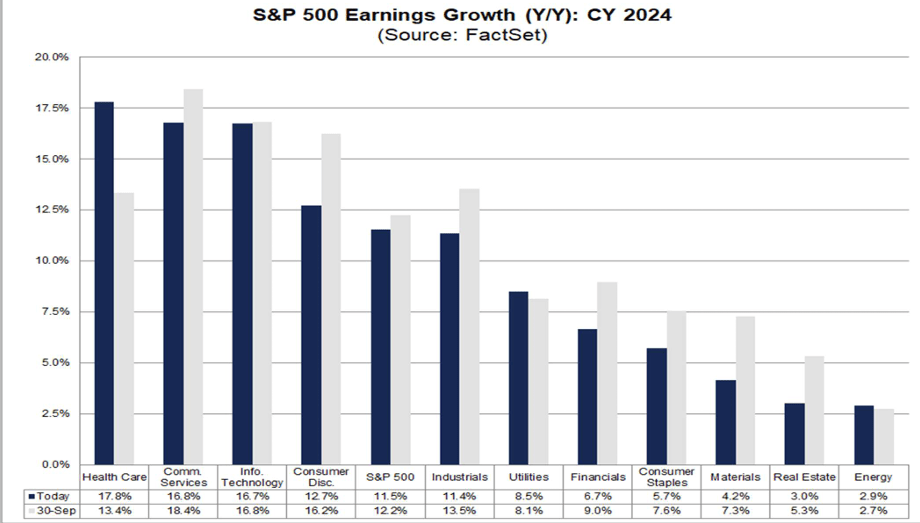
Are these forecasts reasonable?
Per FactSet , at this point in time:
"273 companies in the index have issued EPS guidance for the current fiscal year (FY 2023 or FY 2024). Of these 273 companies, 130 have issued negative EPS guidance and 143 have issued positive EPS guidance. The percentage of companies issuing negative EPS guidance is 48% (130 out of 273)."
How can this negative guidance - before a recession is upon us - match SPX EPS 2024 estimates!?
| Analysts Forecast |
| Y/Y earnings growth |
| Y/Y revenue growth |
| Q1 2024 |
| +6.2% |
| +4.3% |
| Q2 2024 |
| +10.5% |
| +5.2% |
| Q3 2024 |
| +8.7% |
| +5.2% |
| Q4 2024 |
| +18.1% |
| +5.8% |
| CY 2024 |
| +11.5% |
| +5.5% |
Source: FactSet.
Moreover, analysts are a lot more positive on the second half of 2024 than on the first half, but since a recession - if and when - is likely to start towards (or not before) mid-year, how exactly can they be so upbeat on H2!?
Even if one is optimistic about 2024, we find it really hard to justify a better H2 than H1, so our estimates for 2024 are significantly lower than those of Wall Street.
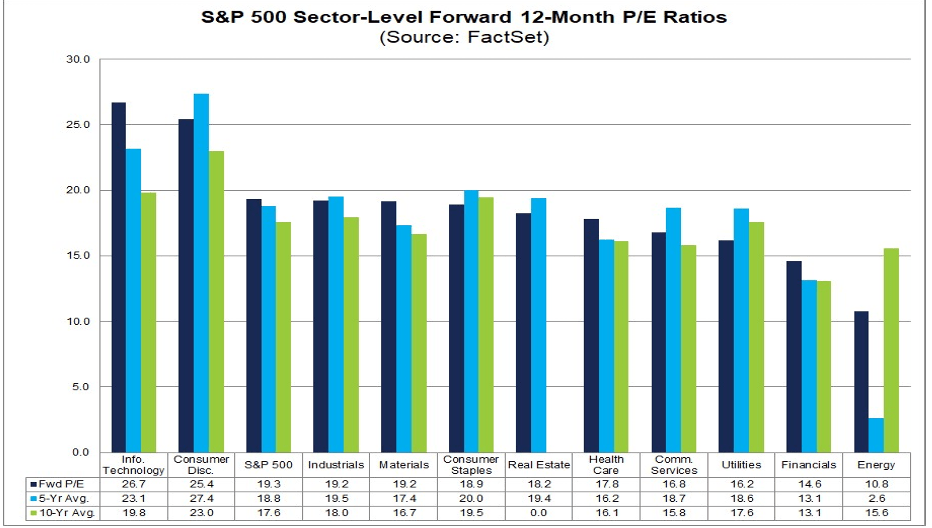
Multiples
SPX's forward 1-year P/E ratio is currently 19.3x, higher than both the 5-year average (18.8) and the 10-year average (17.6).
FactSet
Only two sectors are trading with higher multiples than the SPX index itself, and accidentally or not - they are the same two sectors that are expected to drive the revenue and earnings growth of the SPX next year.
Positioning
Looking at the recent Bank of America's Fund Manager Survey, it surely seems like everybody is currently sitting on the same side of the boat.
Fund managers have the least bearish on stocks in nearly 2 years.
BofA FMS
They are also holding the least cash in nearly 2 years.
BofA FMS
When everyone and their mother is so bullish, it's no wonder to see the SPX reaching the most overbought level in over 3 years.
The last time SPX RSI moved above 80 was September 2020.
Barchart
We're due for a pullback.
Wall Street's 2024 Outlook
You wouldn't be surprised to know that over time, stocks trade up.
Everybody knows that, surely the wolves of Wall Street, and they usually set their forecasts accordingly.
S&P Dow Jones Indices
It's not only statistics (better than a 3:1 ratio in favor of up years), but it's also better for the business to remain positive.
Based on the main forecasts for 2024 that have been published so far, the upside potential seems subdued, with the average and median (of the below table) coming at 4853 and 4895, respectively.
CNBC
We're not saying that Wall Street is always right; that's certainly not the case, e.g., 2023. Nevertheless, the point we're making is that if Wall Street isn't too optimistic about the coming year, it's likely that something is off.
During prior cycles (except 1973/74), the Fed delivered the first-rate cut when the Leading Economic Indicators ("LEIs") were a lot higher than they are now.
Whenever the Fed waited until the LEIs were near zero or negative (as it's now), a recession landed every single time.
Pictet
Epilogue
Only in September 1982 did the S&P 500 Equal-Weight move from a 52-week low to a 52-week high faster than during the 33 trading days it took the index to do so over the past month.
SentimentTrader
It looks too easy, but seasonality might take the SPX to 4800 by year-end. If so, that would (technically) be a new all-time high as the previous high was 4796.
Goldman Sachs
Correlation between the SPX to five leading sectors - Financials ( XLF ), Industrials ( XLI ), Technology ( XLK ), Healthcare ( XLV ), and Consumer Discretionary ( XLY ) - suggests there's still fuel in this rally's tank... but not for another long-haul (full year) ride!
DataTrek
It's now all about hard landing, soft landing, or no landing at all.
Here's a friendly reminder of how the exact same debate started back in 2007, with the main, most distinguished, figures in the financial world insisting that we're heading safely to a "soft landing."
Google Search
We all know how this ended.
A recession and a major crash.
Now, on the verge of a new year, we are seeing the exact same articles and we're hearing the exact same voices.
Once again, the main, most distinguished, figures in the financial world tell us that we should not be worried because a "soft landing" is ahead.
Google Search
Will this time be different? Possible, not probable.
Frankly, we don't think it's smart to adopt a "This Time is Different" approach, and we certainly don't build our investment strategy on such hope/belief.
What do we see for the S&P 500 in 2024?
First and foremost, we see a significantly smaller upside potential (no more than 10%) than downside risk (worse than -20%). That's quite a lousy risk/reward.
Secondly, we believe that the risk of a major economic slowdown is real and we expect revenue and earnings growth to come in lower than (currently) expected.
Finally, if a recession is upon us ("hard landing") we expect a sharp move down before a possible not-as-sharp move up (recovery).
We must also keep on the back of our minds that 2024 is an Election year, and Elections tend to be positive catalysts.
All in all, we see the SPX dives to ~4000, even 3500 (!) in an extreme scenario, and then recover back to 4550 +/-150.
Why the "+/-150"? Because the recovery very much depends on how deep the dive is and when we reach the bottom. It's one thing to bottom at 4000 in May and another to bottom at 3600 in September.
For the sake of this article and the challenge that Seeking Alpha put to us, we're seeing a 2024 year-end target of 4550 (midpoint of 4400-4700) with a stop at 4000 (midpoint of 3850-4150) before that .
Y-Charts, Author
Wishing everybody Happy Holidays, Merry Christmas and Happy New Year!
Editor's Note : This article was submitted as part of Seeking Alpha's 2024 Market Prediction competition , which runs through December 20. With cash prizes, this competition -- open to all contributors -- is one you don't want to miss. If you are interested in becoming a contributor and taking part in the competition, click here to find out more and submit your article today!
For further details see:
S&P 500 In 2024: Bear Market Before All-Time High