QQQ - S&P 500: Positive Run Into 2024
2023-12-21 14:00:00 ET
Summary
- We expect GDP growth for the U.S. in 2024 to be between 1.7% and 2.12%, with interest rates ranging from 4.39% to 4.6%.
- Our proprietary model indicates only a 32% probability of a market crash in 2024 based on the historical correlation of current economic indicators with past market crashes.
- Our valuation of the S&P 500 Index indicates, a 12.7% upside left, with a price target of 5,374.
In our previous S&P 500 ( SP500 , SPY , SPX) market outlook for 2023, we anticipated a strong market rebound following the dismal performance in 2022. As 2023 comes to an end, our previous expectations of economic factors such as inflation to moderate did happen in 2023, with PCE growth projected at 3% by the Federal Reserve, slightly lower than our projected rate of 4.14%. Additionally, our expectations of higher GDP growth compared to 2022 at a 2.2% rate are in line with the Federal Reserve's revised projection of 2.4% this year.
However, one area in which our projections were off the mark was interest rates, which we had projected at 4% compared to the actual Fed funds rate of 5.5% in 2023, as the Federal Reserve withheld from cutting rates this year against our expectations. Notwithstanding, the S&P 500 had rallied by 24.2% YTD, below our expectations of a 37.8% upside.
Therefore, in this analysis, we updated our market outlook for 2024. Our analysis first focuses on the U.S. economic outlook in terms of GDP growth, interest rates, and inflation expectations. We derived our updated forecast for U.S. GDP growth based on two methods, namely growth contribution by productivity and using the Taylor Rule based on the Federal Reserve’s inflation projections. Furthermore, we determined the risks of a market crash in 2024 by compiling and analyzing past market crashes and economic indicators during those periods, deriving a weighted average probability using our model and comparing our results with current economic trends. Finally, we derived our price target of the S&P 500 based on a valuation featuring the market PE and forecasted EPS.
Economic Growth Outlook
In this section, we first examine the U.S. economic outlook based on the GDP growth contribution by productivity components as well as our own proprietary model updated from our previous analysis.
GDP Growth Contribution by Productivity
| US GDP Growth Contribution |
| 2013 |
| 2014 |
| 2015 |
| 2016 |
| 2017 |
| 2018 |
| 2019 |
| 2020 |
| 2021 |
| 2022 |
| Average |
| Total Hours Worked (%) |
| 1 |
| 1.4 |
| 1.6 |
| 1 |
| 1 |
| 1.3 |
| 0.8 |
| -4.5 |
| 3.4 |
| 2.4 |
| 0.94 |
| Share Of Growth Contribution % |
| 53% |
| 64% |
| 59% |
| 63% |
| 43% |
| 45% |
| 35% |
| -167% |
| 59% |
| 120% |
| 37% |
| ICT Capital (%) |
| 0.4 |
| 0.3 |
| 0.3 |
| 0.3 |
| 0.4 |
| 0.4 |
| 0.4 |
| 0.4 |
| 0.5 |
| 0.5 |
| 0.39 |
| Share Of Growth Contribution % |
| 21% |
| 14% |
| 11% |
| 19% |
| 17% |
| 14% |
| 17% |
| 15% |
| 9% |
| 25% |
| 16% |
| Non-ICT Capital (%) |
| 0.4 |
| 0.4 |
| 0.4 |
| 0.3 |
| 0.4 |
| 0.4 |
| 0.4 |
| 0.3 |
| 0.3 |
| 0.3 |
| 0.36 |
| Share Of Growth Contribution % |
| 21% |
| 18% |
| 15% |
| 19% |
| 17% |
| 14% |
| 17% |
| 11% |
| 5% |
| 15% |
| 15% |
| Multifactor Productivity (%) |
| 0.1 |
| 0.1 |
| 0.4 |
| 0 |
| 0.5 |
| 0.8 |
| 0.7 |
| 1.1 |
| 1.6 |
| -1.2 |
| 0.41 |
| Share Of Growth Contribution % |
| 5% |
| 5% |
| 15% |
| 0% |
| 22% |
| 28% |
| 30% |
| 41% |
| 28% |
| -60% |
| 11% |
| Total GDP Growth (%) |
| 1.9 |
| 2.2 |
| 2.7 |
| 1.6 |
| 2.3 |
| 2.9 |
| 2.3 |
| -2.7 |
| 5.8 |
| 2 |
| 2.1 |
Source: OECD, Khaveen Investments.
The GDP Growth is categorized into four components, including Total Hours Worked, ICT Capital, Non-ICT Capital And Multifactor Productivity. Overall, the average GDP growth that is attributed to these four components is 2.1% from 2013 to 2022. Among these, the Total Hours Worked has the highest impact on the GDP with an average of 0.94% in the past ten years. Additionally, it has been positive except in 2020, when the pandemic occurred, which has led to a decline in GDP growth. Following 2020, total hours had strong growth in both 2021 and 2022. Analyzing workforce trends, there was a 6% drop in total nonfarm employees to 142.2 million in 2020, according to the Bureau of Labor Statistics. While it bounced back in 2021 (2.9% growth), it only recovered above pre-pandemic levels in 2022 (152.6 mln). Hence, we will exclude the figures for 2020, considering the pandemic as a one-off event and acknowledging that the economy has subsequently undergone recovery since 2021. Additionally, we calculated the labor force participation based on total nonfarm employees (adjusted by dividing 0.8x) and total U.S. working age population (15-64 years), which shows a recovery from 86.3% in 2020 to 92% in 2022, in line with 2019 levels of 91.4%. Thus, we forecast total hours worked based on a 7-year average before 2020 to exclude the impact of the pandemic as labor participation and total employees only recovered to pre-pandemic levels in 2022.
| U.S. Labor Participation Estimate |
| 2018 |
| 2019 |
| 2020 |
| 2021 |
| 2022 |
| Adjusted Total Employees* |
| 183,264 |
| 188,614 |
| 177,691 |
| 182,851 |
| 190,782 |
| Growth % |
| 2.92% |
| -5.79% |
| 2.90% |
| 4.34% |
| U.S. Working Age Population |
| 206,540,220 |
| 206,311,647 |
| 205,970,209 |
| 205,285,192 |
| 207,305,321 |
| Growth % |
| -0.11% |
| -0.17% |
| -0.33% |
| 0.98% |
| Calculated Participation Rate |
| 88.73% |
| 91.42% |
| 86.27% |
| 89.07% |
| 92.03% |
| Actual Participation Rate |
| 62.90% |
| 63.10% |
| 61.70% |
| 61.70% |
| 62.20% |
*Divided by a factor of 0.8x as an estimate for total employees. Source: U.S. Bureau of Labor Statistics, Organization for Economic Co-operation and Development, Khaveen Investments.
Both ICT and Non-ICT Capital consistently contributed positively each year, while Multifactor Productivity contributed positively every year except for 2022 which saw a decline. Therefore, we forecast the ICT Capital including ICT and non-ICT based on a 10-year average as they had been very stable in the period.
Whereas for Multifactor Productivity, to explain the anomalous decline in 2022, we examined Total Factor Productivity ((TFP)) which measures the economy’s efficiency in output without increasing inputs, tied to innovation. Labor productivity growth reflects an economy's ability to produce more output per unit of labor input, driven by technology and a skilled workforce. According to the U.S. Bureau of Labor Statistics , in 2022, the U.S. saw a 1.2% decline in TFP for private nonfarm businesses, driven by a 3.6% increase in combined inputs, outpacing the 2.3% growth in output. One factor for this phenomenon is attributed to the strong growth recovery in industries that were affected by the COVID pandemic which have “traditionally lower productivity jobs” such as hospitality and retail. On the other hand, these impacted industries led to a boost in productivity during the pandemic (2020 and 2021). Therefore, we forecast Multifactor Productivity based on a 7-year average excluding 2020 to 2022 due to the impact on productivity by industries heavily affected during the pandemic.
| GDP Growth Projections |
| 2022 |
| 2023F |
| 2024F |
| Total Hours Worked |
| 2.4% |
| 1.16% |
| 1.16% |
| ICT Capital |
| 0.5% |
| 0.39% |
| 0.39% |
| Non-ICT Capital |
| 0.3% |
| 0.36% |
| 0.36% |
| Multifactor Productivity |
| -1.2% |
| 0.37% |
| 0.37% |
| Total GDP Growth % |
| 2% |
| 2.28% |
| 2.28% |
Source: OECD, Khaveen Investments.
In total, the table above shows our derived GDP growth forecasts based on the combination of all 4 components at 2.28%, which we expect as the long-term growth for the US economy. In comparison, this figure also aligns with The Conference Board ’s consensus of a 2.4% GDP growth in 2023.
Khaveen Investment GDP Model
Previously, we forecasted the U.S. GDP to grow by 2.2% in 2023 which is in line with the forecasted growth rate of 2.4% by the U.S. Conference Board. However, as our interest rate forecast was off, we upgraded our model by projecting the interest rate based on the Taylor Rule which “determines the target interest rate using the neutral rate, expected GDP relative to its long-term trend, and expected inflation relative to its targeted amount.”
| Component |
| Value |
| Based on |
| Source |
| Neutral Rate |
| 2.08% |
| 5-year Average 1-year Treasury Yield |
| Expected Inflation |
| 2.40% |
| 2024 Headline CPI Forecast |
| Expected GDP |
| 1.70% |
| 2024 Real GDP Forecast |
| Federal Reserve Bank of Philadelphia SPF |
| GDP Trend |
| 2.28% |
| Our Forecasts of Long-Term US GDP |
| OECD, Khaveen Investments |
| Targeted Inflation |
| 2% |
| Long-term Federal Reserve Target |
| Targeted Rate |
| 4.39% |
*Targeted Rate = Neutral Rate + Expected Inflation + [0.5*(Expected GDP – GPD Trend) + 0.5*(Expected Inflation – Targeted Inflation)]. Source: Khaveen Investments.
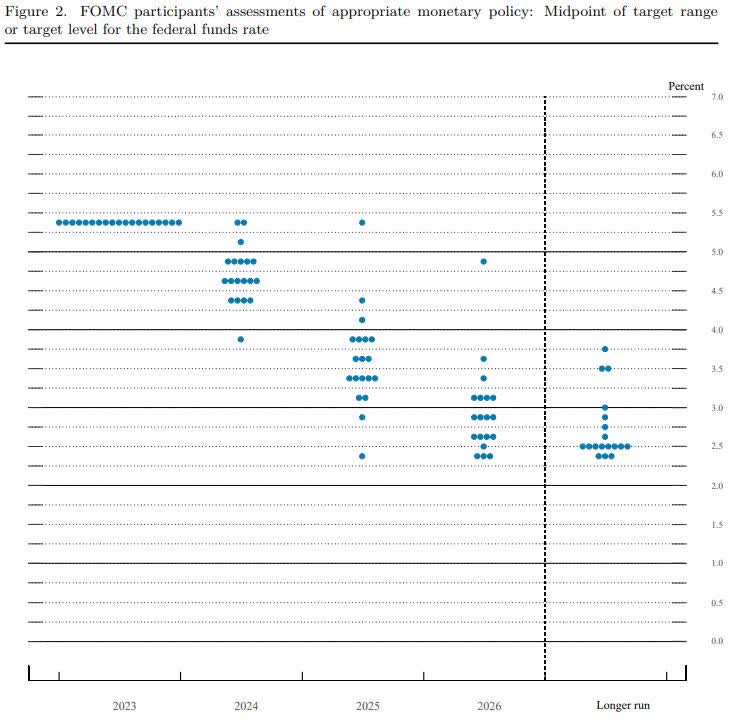
In total, we forecasted the Fed funds rate to be 4.39% in 2024 based on the Taylor Rule formula. As per the projections from the Federal Reserve Bank of Philadelphia SPF, the anticipated inflation rate for 2024 is 2.4%, while the GDP growth is forecasted at 1.7%. In comparison with the latest Federal Reserve dot plot below, the median projection for rates at 4.6% is fairly in line with our forecasts of 4.39%.
In the scenario where the Federal Reserve cuts rates only to 4.6%, we calculated an expected GDP growth of 2.12% based on the Taylor Rule formula. Hence, we believe the Federal Reserve will cut to around 4.6% should GDP be in line with a 2.12% growth.
| Summary |
| 2024F |
| GDP Growth Forecast Range |
| 1.7% to 2.12% |
| Interest Rate Forecast Range |
| 4.39% to 4.6% |
Source: Khaveen Investments.
Outlook
All in all, the U.S. Conference Board expects GDP growth to be 1.7% in 2024. Additionally, based on the Taylor Rule, we believe the Federal Reserve would need to cut interest rates in 2024 to 4.39% to achieve a 1.7% GDP growth rate. Additionally, our forecast is fairly in with the Federal Reserve expectations based on the latest dot plot which has a median rate of 4.6% by the end of 2024 based on the dot plot. Using the Taylor Rule, we calculated an expected GDP growth rate of 2.12%. Thus, we believe GDP growth in 2024 to be between 1.7% to 2.12% depending on the interest rate to range between 4.39% to 4.6% as determined by the Federal Reserve. This is fairly in line with our long-term U.S. GDP growth projections based on the growth contribution by productivity components method at 2.28%.
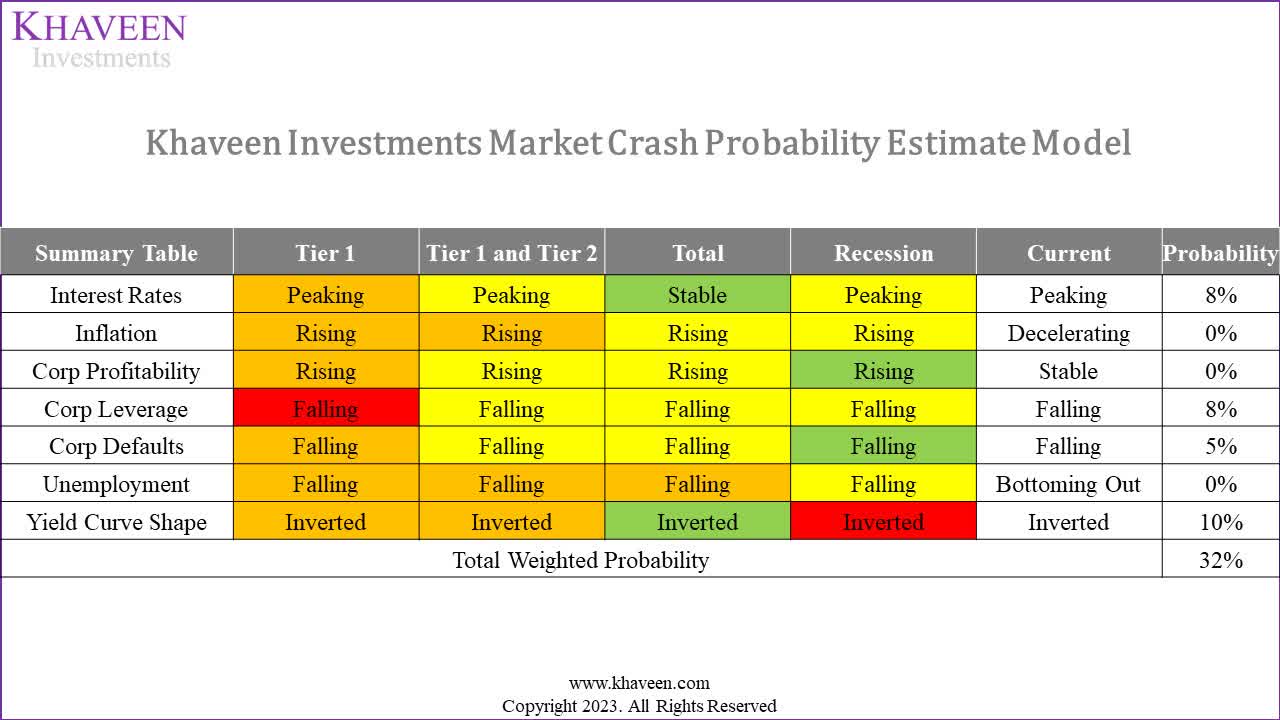
Probability of A Market Crash in 2024
In this point, we examine the risk of a possible market crash in 2024 based on our analysis of key economic indicators during past market crashes in comparison with current indicators. We also derived a model to estimate the probability of a market crash.
We categorized the past market crashes into different tiers based on the severity of the market crashes in terms of magnitude and duration where Tier 1 is the most severe crashes, followed by Tier 2 as less severe and Tier 3 as the least severe.
In the periods of the major (Tier 1) crashes (Dec 99, May 07 and Jul 21), the indicators that were common in all 3 periods before the start of the crash dates were corporate leverage which was falling in these periods. Interest rates were peaking in both Dec 99 and May 07 but were stable in Jul 21. Inflation in both Dec 99 and Jul 21 were rising except in May 07. Corporate defaults were falling on both May 07 and Jul 21. Unemployment was falling in Dec 99 and Jul 21. The yield curve was inverted on both Dec 99 and May 07 but was steep on Jul 21.
Furthermore, accounting together with the less severe crashes (Tier 1 and Tier 2), all indicators were contrasting with no indicator similar across all 6 periods. However, interest rates were commonly peaking, inflation was rising, corporate profitability rising, corporate leverage falling, corporate defaults falling, unemployment falling and the yield curve was inverted.
Overall, including Tier 3 crashes as well, indicators for interest rates were commonly stable, inflation rising, corporate profitability rising, corporate leverage falling, corporate defaults falling, unemployment falling and yield curve shape inverted.
Furthermore, the common metrics during recessionary periods rather than crashes on Mar 09, Dec 99, May 07 and Mar 19 were interest rates were peaking, inflation rising, corporate profitability rising, corporate leverage falling, unemployment falling and the yield curve was inverted.
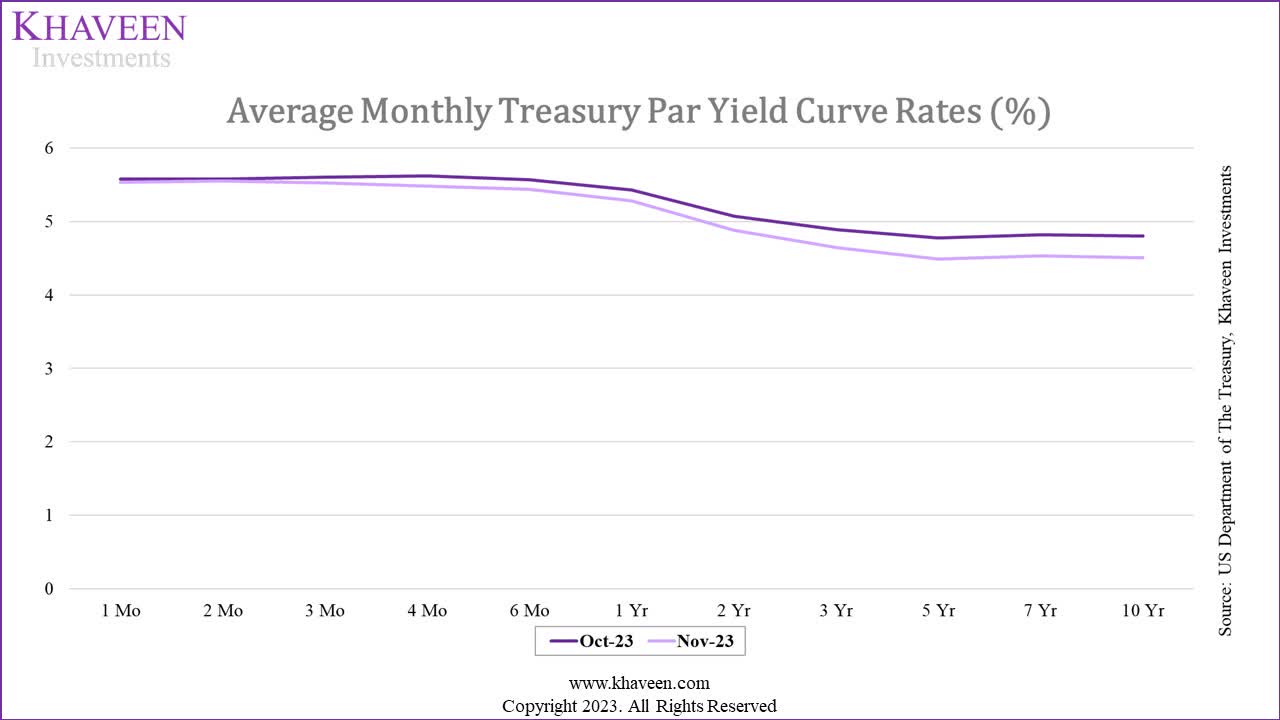
Yield Curve
US Department of The Treasury, Khaveen Investments
We plotted the average U.S. treasury yields above in Oct and Nov 2023. As seen, the yield curve is inverted with average yields of longer-term maturities (1 year and above) lower compared to short-term yields.
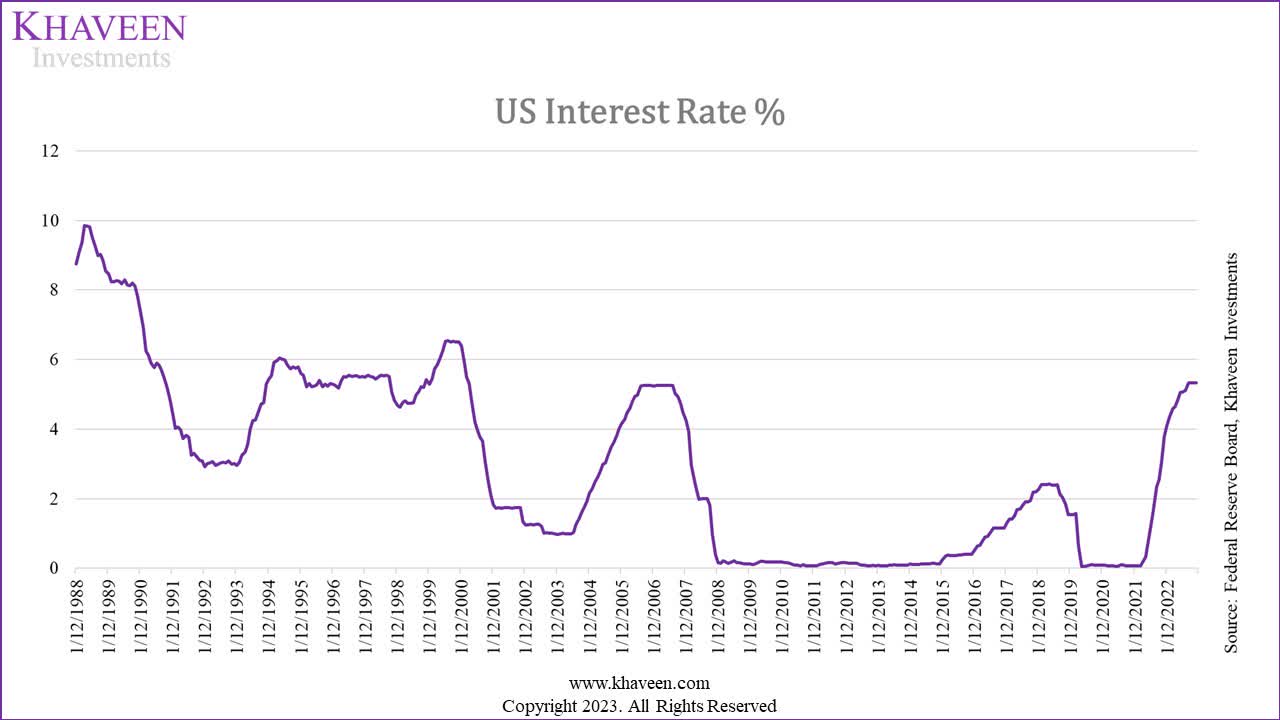
Interest Rates
Federal Reserve Board, Khaveen Investments
In terms of interest rates , the U.S. Fed funds rate has increased from almost 0% since the start of 2021 and peaked at 5.33% in August 2023. However, based on our projections and the Federal Reserve dot plot, rates are expected to be peaking.
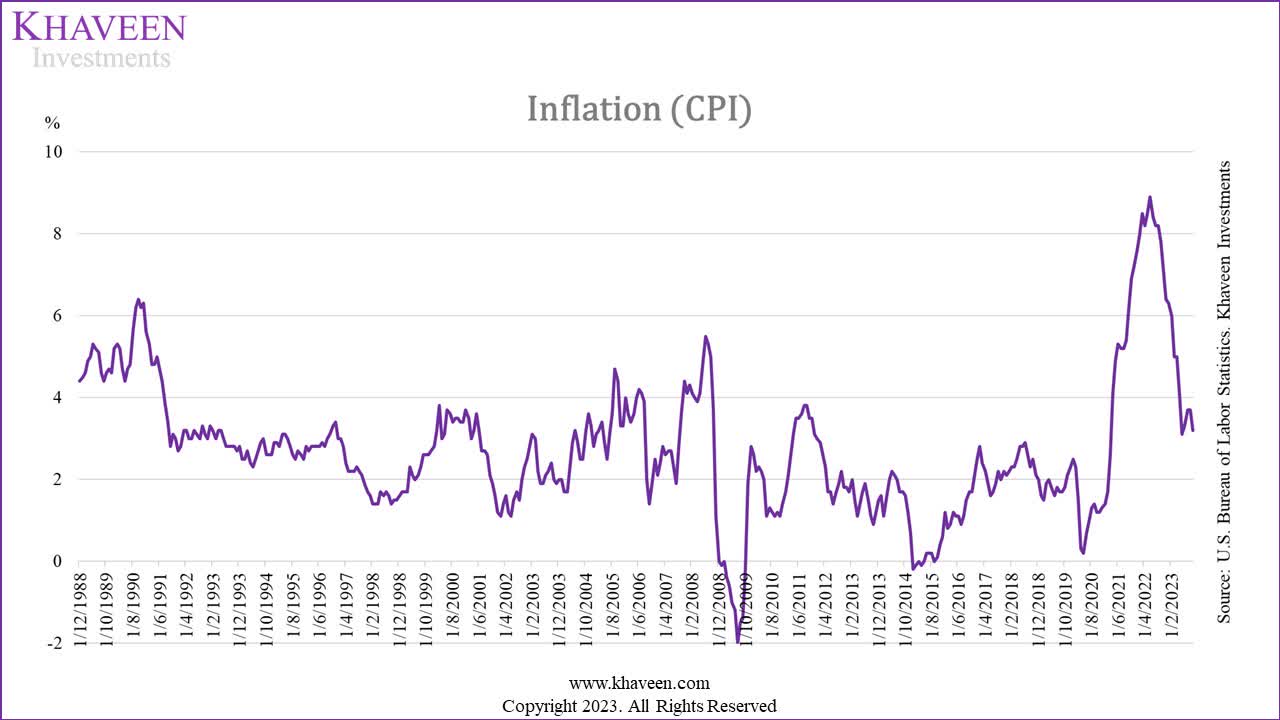
Inflation
U.S Bureau of Labor Statistics, Khaveen Investments
For inflation , while there was a spike in U.S. CPI to 8.9% during the pandemic, it has been declining since April 2022 and is anticipated to continue decreasing going into 2024 at slightly above 2% based on the Federal Reserve projections as mentioned above.
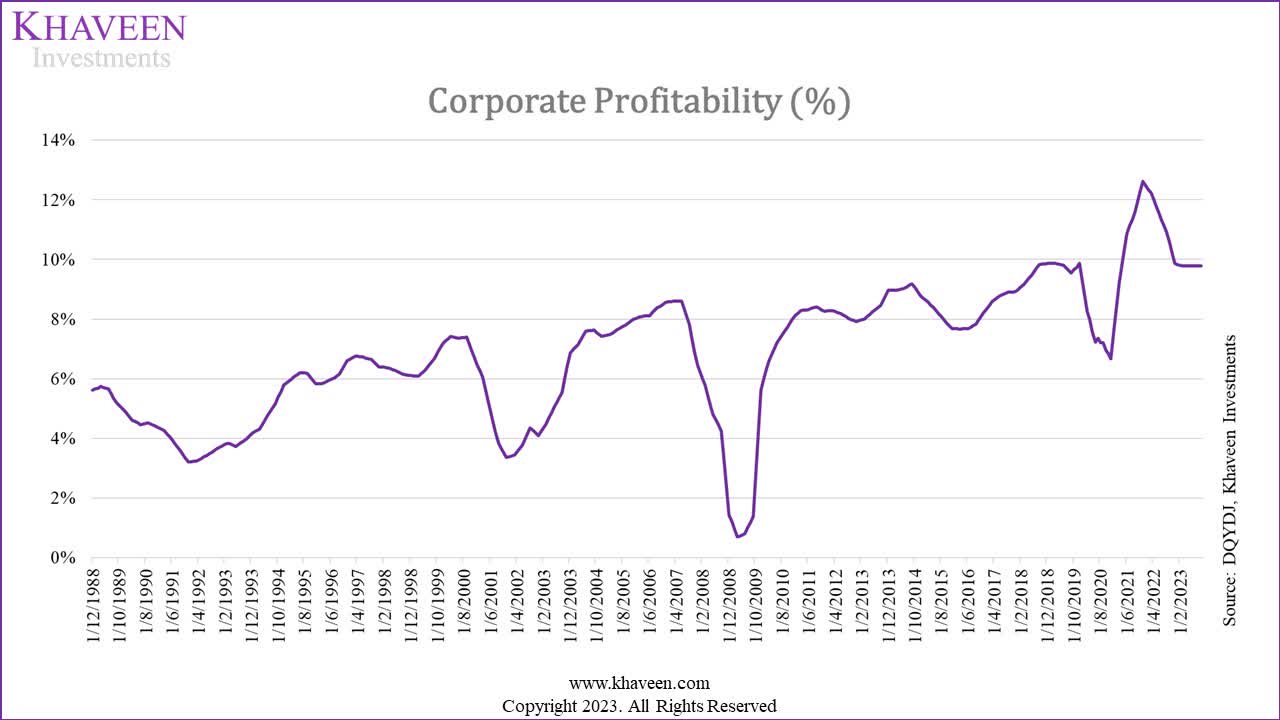
Corporate Profitability
In terms of Corporate Profitability , despite fluctuations in the average S&P profit margin over the past decade, there has been a long-term upward trend, reaching 10% in 2023 from an initial 8% in 2013. While the margin has moderated since 2022, it appears to have stabilized in 2023.
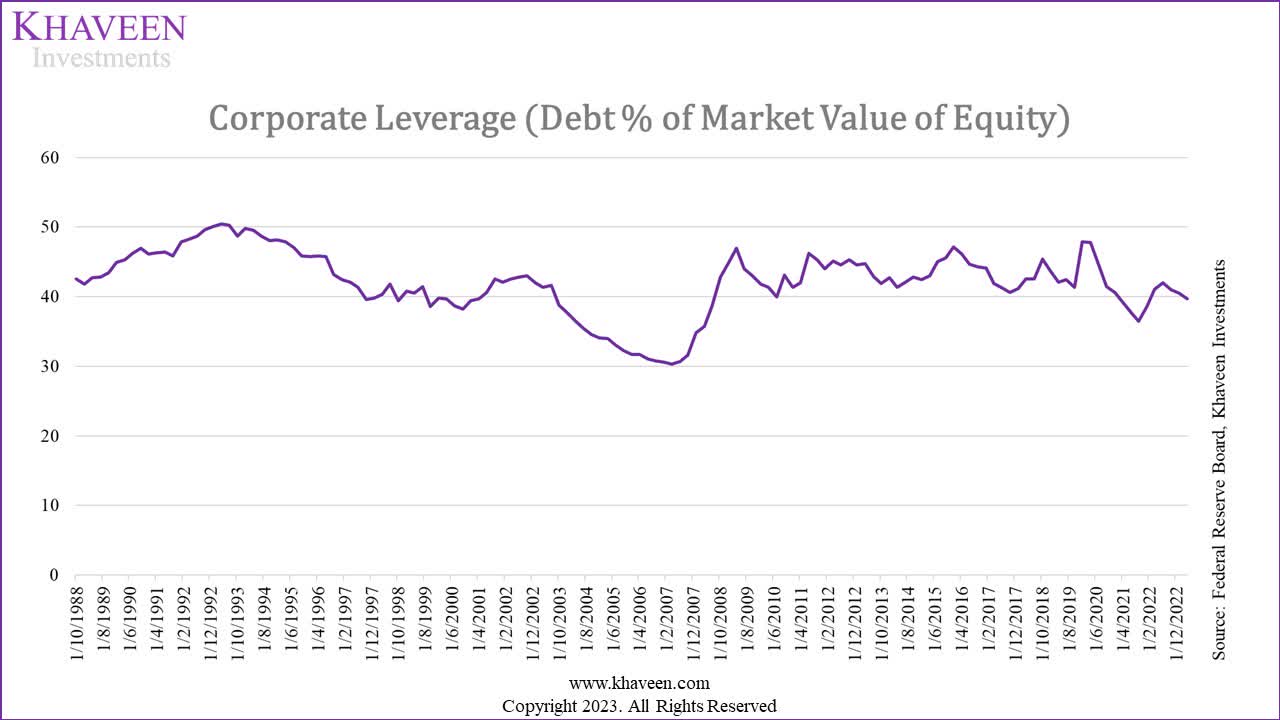
Corporate Leverage
Federal Reserve Board, Khaveen Investments
Whereas for Corporate Leverage measured as debt as % of total market value of equity, it has been fairly stable in the past 10 years with an average of 42.5% but appears to be falling in 2023.
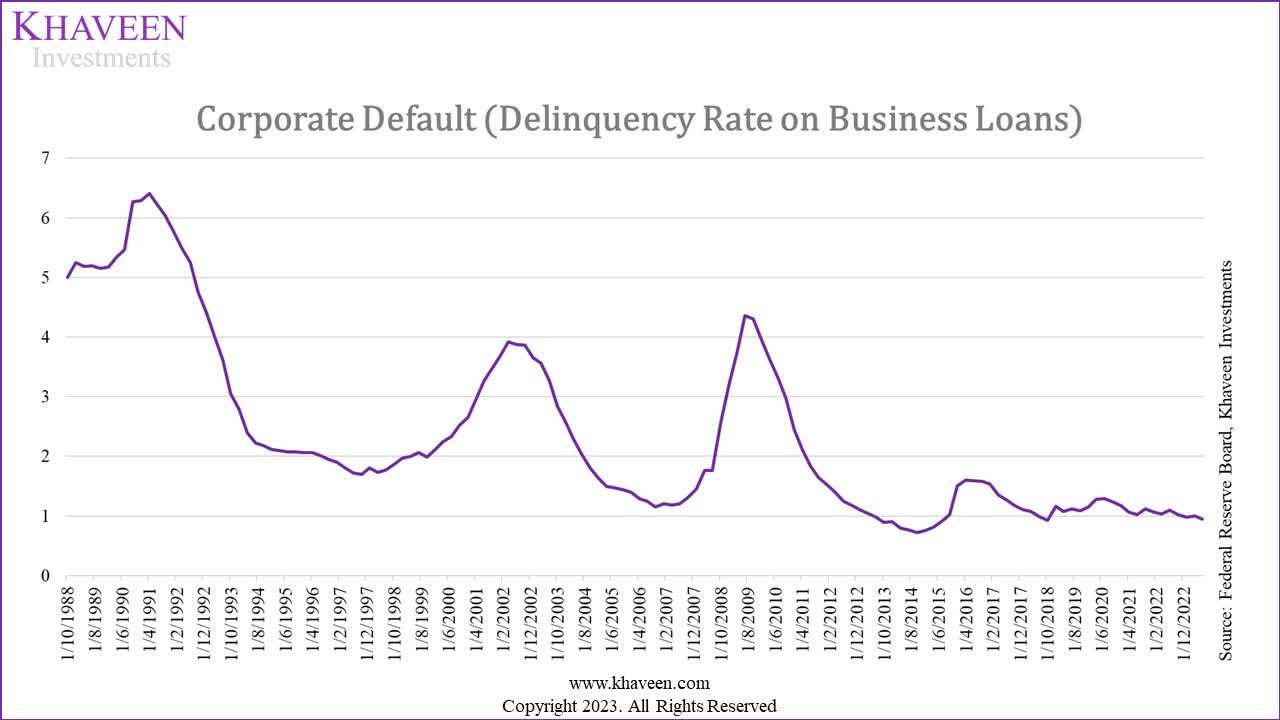
Corporate Default
Federal Reserve Board, Khaveen Investments
Corporate Defaults , based on the delinquency rate of business loans, are highly volatile with periods of sharp increases followed by gradual decreases. Corporate Default has been trending downwards, declining from 4.4% to around 1% over the past few years.
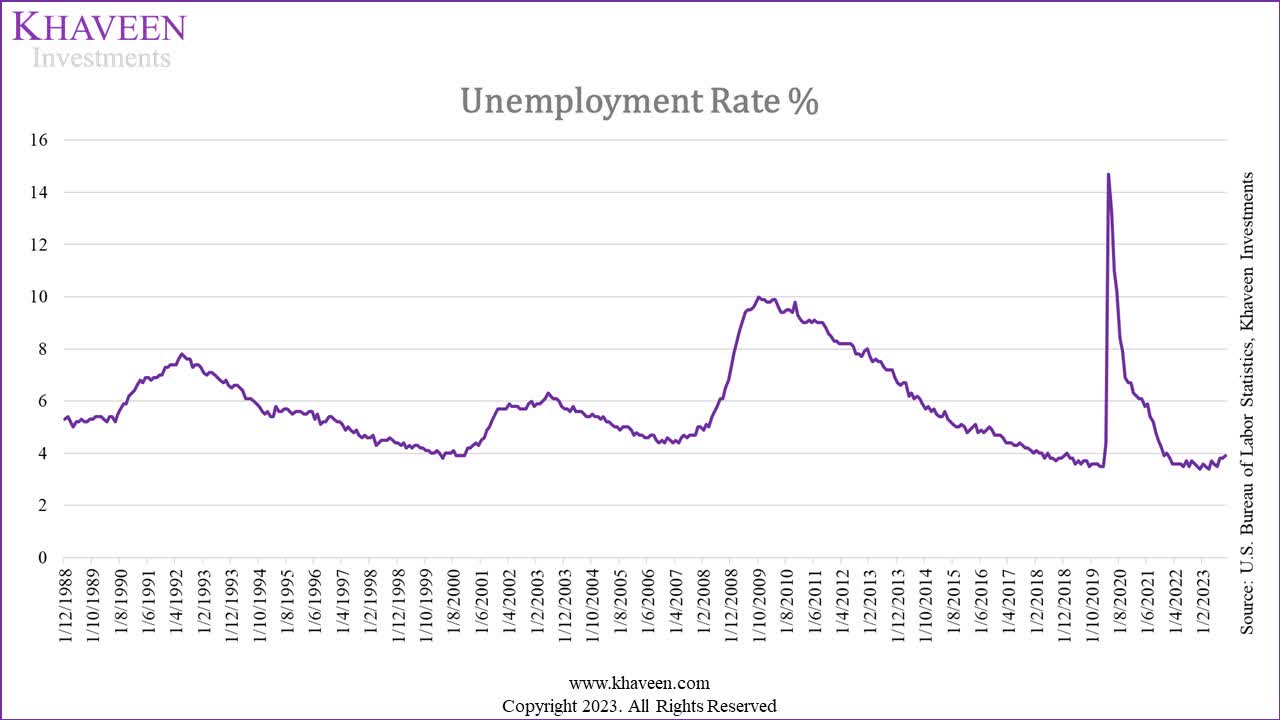
Unemployment
U.S Bureau of Labor Statistics, Khaveen Investments
Finally, in terms of the U.S. unemployment rate , following the sharp rise during the pandemic in 2020 and gradual recovery, it has been rising slightly since Aug 2023 to 3.9% in October 2023, indicating it could be bottoming out.
Outlook
In conclusion, we have analyzed the latest market crash characteristics using the indicators and compared them with the present indicators as of December 2023. We emphasized the indicators by color-coding them, with 80% above denoted in red, 60% to 80% in orange, and 50% to 60% yellow and below 50% in green. As seen, the most important indicator appears to be corporate leverage in a Tier 1 crash, with it matching the current corporate leverage trend which is also falling, as well as yield curve inversion in recession periods. The rest of the indicators are less important (a mix of orange, yellow and green but no red-coded indicators), with 2 indicators (peaking interest rates and falling corporate defaults) matching current trends.
Using this information, we derived a probability of a market crash in 2024 based on a weighted average probability looking at the correlation of current conditions to the most common conditions of the crashes, by comparing current indicators with indicators across the 3 different crash types and recession where Tier 1 only crashes have the highest weight. Moreover, we weighted the indicators with interest rates, inflation and yield curve indicators at a combined 50% weight, corporate profitability, defaults and leverage at a 40% combined weight and unemployment with the remaining 10% weight.
In total, we derived a weighted average probability of 32% of a market crash in 2024 from our model. In comparison, Goldman Sachs ( GS ) sees a 15% probability of a U.S. recession, while Bloomberg consensus was 60%. Moreover, JPMorgan Chase ( JPM ) sees “a 50/50 chance of a recession starting by the end of 2024, and a greater chance of a recession in 2025 if one fails to materialize earlier.”
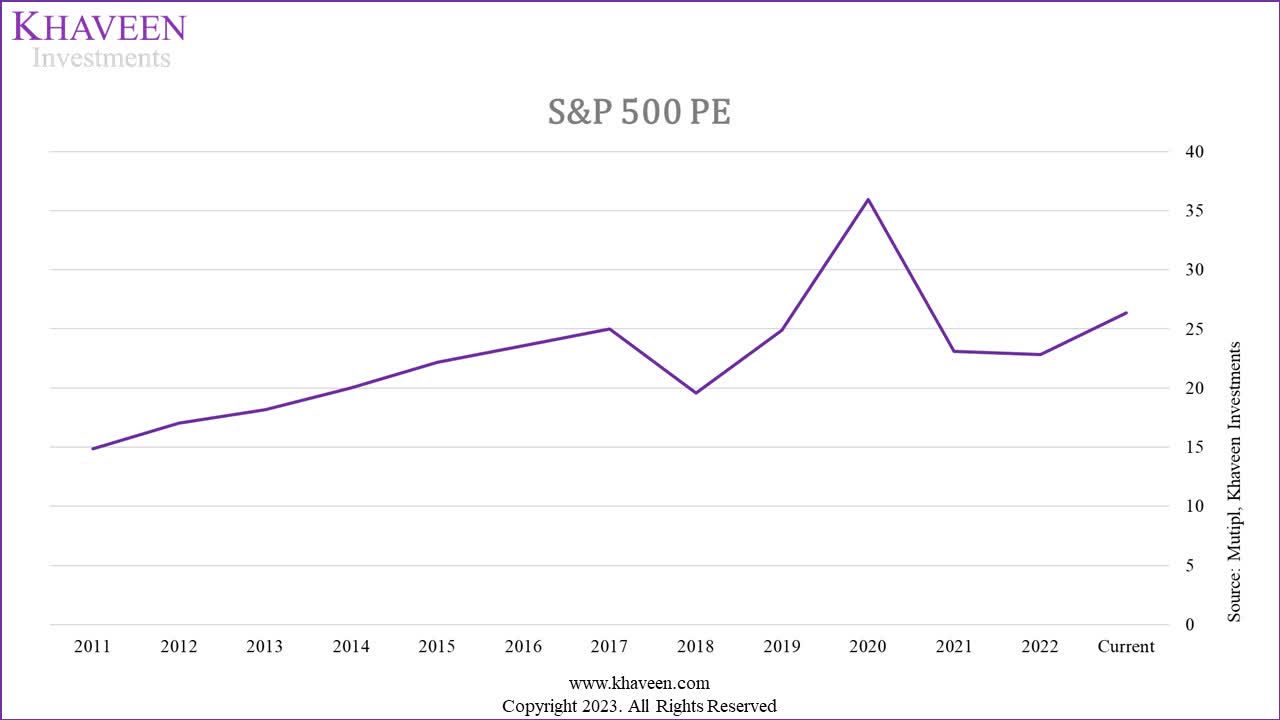
S&P 500 2024 Valuation
In our previous market prediction for 2023, we derived a price target of 5,213 for the S&P 500 which is an upside of 35.8% compared to 2022. As of December 20, the S&P 500 was 4,768, an increase of 24.2% YTD. Based on the current PE of 26.34x, the estimated EPS is $181, which is lower compared to our forecasted EPS of $211.50. This is because we previously based our 2023 forecast of FactSet’s analyst consensus growth of 5.5% on the estimated 2022 operating EPS of $200.49 which is inaccurate as we calculate the actual 2022 EPS at $172.80. Had we used the 2022 reported EPS instead of operating EPS, our forecast would have been in line ($182.3 vs $181 current).
| Comparison of Our Forecast with Actual |
| Our Previous Forecast (2023) |
| Current (2023) |
| Actual (2022) |
| EPS Estimate |
| $211.5 |
| $181.0 |
| $172.8 |
| P/E |
| 24.65x |
| 26.34x |
| 22.2x |
| S&P 500 |
| 5,213 |
| 4,768 |
| 3,840 |
| Change % |
| 35.8% |
| 24.2% |
| -19.4% |
Source: Mutipl, S&P Global, Seeking Alpha, Khaveen Investments.
Valuation
The chart shows the P/E ratio of the S&P 500 had increased to 26.34x, with its 5-year average of 26.62x. We updated our forecast of deriving our S&P price target based on a 2024 EPS multiplied by the market P/E.
In our updated valuation of the S&P 500, we applied the analysts’ consensus EPS growth forecast of 11.5% from FactSet . Incorporating the 5-year average P/E ratio of 26.62x, we derived the forecasted 2024 EPS of $201.85.
| S&P 500 Valuation |
| 5-year Average P/E Ratio |
| 26.62x |
| EPS Growth % |
| 11.50% |
| 2024F EPS |
| $201.85 |
| S&P 500 Price Target |
| 5,374 |
| Upside |
| 12.7% |
Source: Factset , Khaveen Investments.
As summarized above, we modeled an upside of 12.7% at a price target of 5,374 for the S&P 500 in 2024.
Outlook
The S&P500's P/E ratio has risen to 26.34x, aligning closely with the 5-year average of 26.62x. We adjusted our S&P price target based on our 2024 forecasted EPS and 5-year average market P/E. In total, we predict a 12.7% upside for the S&P 500. However, in our Tech Sector Outlook, we highlighted the limited upside of the Tech Sector which accounts for 29% of the S&P500 weightage, and derived a weighted average upside of 8.6% for the sector, factoring the constrained upside of the major holdings like Apple ( AAPL ) (-1.1% upside), which accounted for 21.6% of total sector weightage.
Risk: Global Risks
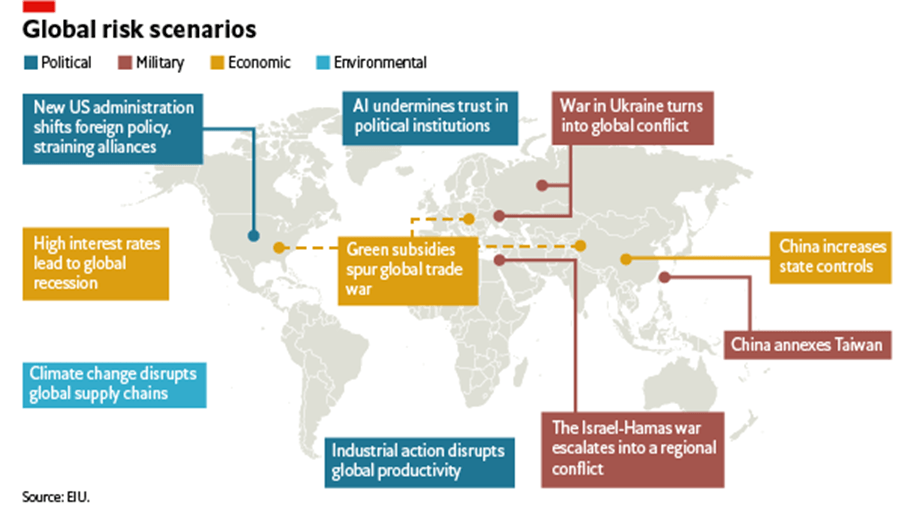
In the upcoming year, the Economist Intelligence Unit ((EIU)) foresees persistent challenges posed by geopolitical tensions, monetary tightening and supply chain disruptions that may exert considerable pressure on the global economy. Specifically, there is a risk of regional escalation if the Israel-Hamas conflict persists. Due to recent reported attacks on commercial shipping vessels, large shipping companies have been avoiding the Red Sea, affecting global logistics. Additionally, prolonged conflict in Ukraine could pose risks to commodity prices as Russia terminated a grain deal in mid-2023. Furthermore, the global supply chain is likely to be disrupted due to extreme weather events such as El Nino which could affect food prices and commodities. Additionally, S&P Global Market Intelligence anticipates that economic and geopolitical volatility will contribute to sustained global segmentation in 2024.
Verdict
In summary, our expected GDP growth range is 1.7% to 2.12%, in line with our long-term U.S. GDP growth projections at 2.28%. Additionally, we also expect interest rates to range from 4.39% to 4.6%. Furthermore, based on our historical market crash analysis along with current economic indicators, we estimate a 32% probability of a market crash in 2024. For our valuation based on the S&P 500's P/E 5-year average ratio at 26.62x and analyst consensus EPS growth forecasts of 11.5%, we derived a 12.7% upside. However, our Tech Sector Outlook suggests a limited 8.6% weighted average upside, with Apple at -1.1% (21.6% of the total), thus we believe other sectors could support the upside in 2024. Overall, we rate the S&P500 as a Buy with a price target of 5,374 at an upside of 12.7%.
Editor's Note : This article was submitted as part of Seeking Alpha's 2024 Market Prediction competition , which runs through December 20. With cash prizes, this competition -- open to all contributors -- is one you don't want to miss. If you are interested in becoming a contributor and taking part in the competition, click here to find out more and submit your article today!
For further details see:
S&P 500: Positive Run Into 2024