IWM - S&P 500 Top Likely At 4450 Get Ready For The Bear Market Phase 2
2023-06-23 10:45:47 ET
Summary
- The bear market rally in the S&P 500 likely peaked on June 16th due to imminent recession and market microstructure model indicators.
- Recession indicators include a weakening labor market and stalled consumer spending, with a possible recession already underway since Q4 2022.
- Market microstructure model suggests that the breakout above the 4200 level has reversed, and profit-taking is likely occurring.
The recent bear market rally in the S&P 500 ( SP500 ) likely peaked at 4450 intraday on June 16th. There are two good reasons why I think the top is likely in, and that Phase 2 of the bear market is approaching.
The Phase 1 of the bear market
But first, as I have been explaining , the bear market that started in January 2022 was a liquidity-based selloff due to the expected increase in the Federal Funds rate. During the Phase 1 of the full bear market cycle, the P/E ratio contracted, and marginal bubbles busted, such as the meme stocks, including the cryptocurrencies.
The liquidity selloff reached a peak in October 2022 when the market started pricing the ending of the Fed's interest rate hiking cycle and the elusive Fed pivot. Thus, the S&P 500 found the bottom at the key technical resistance 200wma, the U.S. dollar started to weaken - and the shorts started to cover their bearish positions.
The bear market rally
Thus, the bear market rally kicked off. Within my model, the bear market rally lasts until the lagged effects of the monetary policy tightening start to confirm a recession. The Phase 2 of the full bear market is a recessionary selloff, driven mostly by a downgrade in earnings projections due to a recession.
Most economic models expected the recession to start early in 2023, either Q1 2023 or Q2 2023 - and thus the bear market rally to be short-lived. However, January 2023 brought surprising economic strength, which possibly suggested that the expected recession could be delayed to Q3 2023. But more importantly, the emergence of the generative AI theme with the Microsoft's (MSFT) huge investment in ChatGPT kicked off a major AI rally in the 7 megacap tech stocks, which pushed the tech-heavy Invesco QQQ Trust ETF ( QQQ ) to near all-time highs, and significantly extended the bear market rally in the S&P 500 ( SPY , VOO ).
The Phase 2 of the bear market
There are two good reasons to believe that the bear market rally ended on June 16th. First, the recession is now likely imminent in Q3 2023, or possibly already is underway - thus, the Phase 2 recessionary selloff is approaching. Second, my market microstructure model suggests that the induced market breakout above the 4200 level has likely reversed and the "winners" have been likely taking profits.
The recession indicators
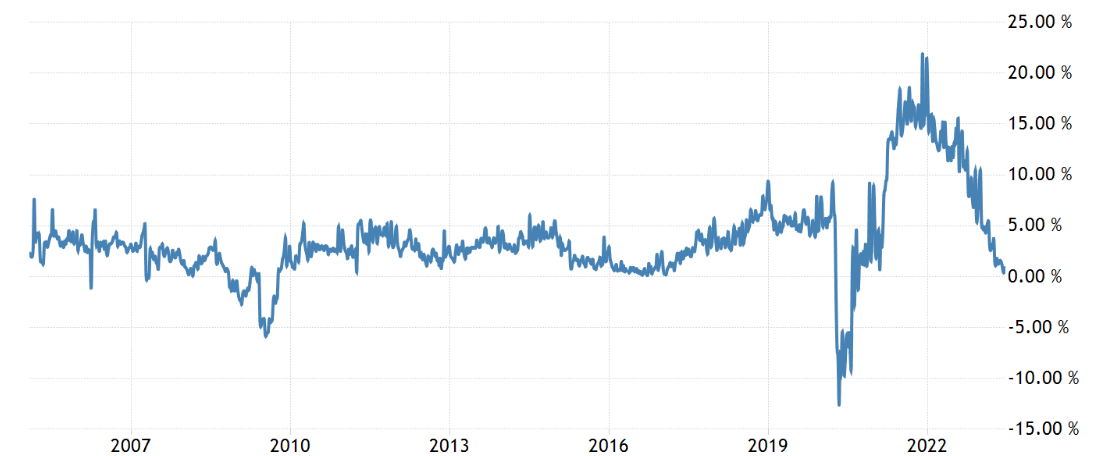
The recession has been delayed mostly due to a very resilient labor market. The unemployment rate has actually been decreasing, reaching the historically low level of 3.4% in April, which supported the growth in U.S/ consumption. However, the leading indicators of the labor market strength have been pointing to weaker conditions associated with a recession.
Specifically, initial claims for unemployment spiked above the key 250K level, and remained elevated, which suggests a further weakening in the labor market.
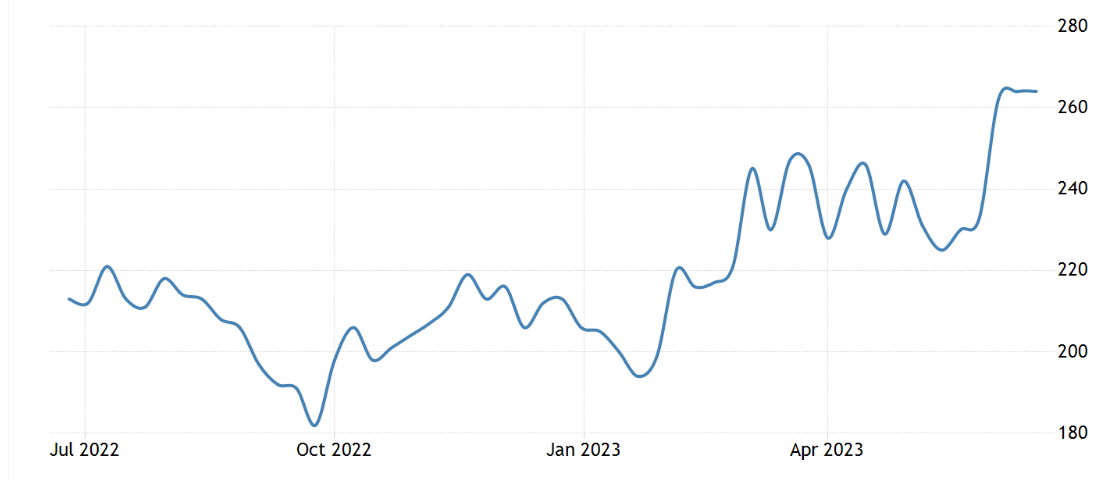
But more importantly, the retail sales are approaching the 0% growth level over the last year, which suggests that the growth is likely to drop to below 0% soon, pointing to a weakness in consumer spending associated with a recession. Here is the chart of the retail sales based on the Redbook Index weekly indicator:
Based on these leading weekly indicators, the labor market is weakening, and consumer spending is at the stall level, both associated with an imminent recession. But also note, that we could already be in a recession since Q4 2022 based on the Gross Domestic Income ((GDI)) measure, which has been contracting in Q4-22 and Q1-23. The National Bureau of Economic Research ("NBER") is looking at the average between GDP and GDI to mark the beginning of a recession, so we could already be in a recession. This is also supported by the fact that corporate earnings have also been declining since Q4 2022.
The market microstructure model
The recession-based indicators suggest that earnings downgrades are likely, but this is not a good timing tool. Markets over short term can be irrational and trade based on the interaction of market participants.
As I explained , my market microstructure model is based on the "rational speculation," whereby an informed large speculator (rational speculator) triggers an artificial pattern to invite a large group of uninformed trend-followers to participate, and to induce short covering of another group called rational arbitrageur. The resulting bubble ends as the "rational speculator" sells to take profit, and the "rational arbitrageur" is forced to cover at loss.
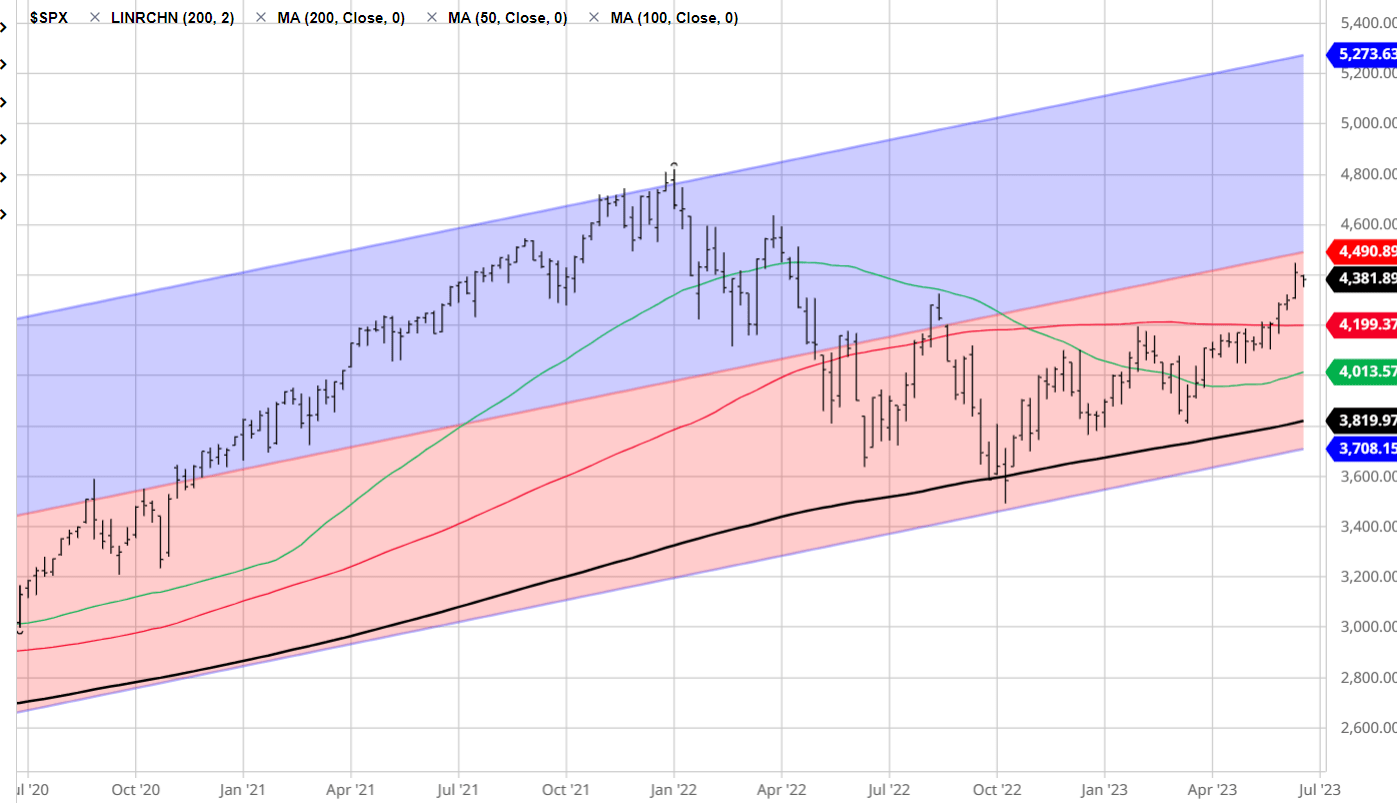
The S&P 500 had a major breakout above the 100wma level (in red). In my view, this was triggered by the rational speculator, and the trend-followers took the bite, while most fundamentally-oriented shorts were forced to cover.
Specifically, I look at Goldman calls. Just as the S&P 500 crossed the key resistance level, Goldman issued three upgrades on S&P 500 price.
First, on June 6th, Goldman lowers the recession probability only to 25%, based on the prediction that the banking crisis is mostly over:
...regional bank stock prices have stabilized, deposit outflows have slowed, lending volumes have held up, and lending surveys point to only limited tightening ahead
Next, on June 7th the macro team at Goldman upgraded the S&P 500 to 4700 - based on the AI boom, and effect of AI adoption on earnings in 10 years.
We assume that widespread AI adoption occurs in 10 years and lifts trend real GDP growth by 1.1 percentage point for 10 years. In this scenario, earnings per share in 20 years would be 11% greater than our current assumption and the S&P 500 fair value would be 9% higher than today, holding all else equal
Finally, on June 12th, the equity team at Goldman upgraded S&P 500 to 4500 based on the soft-landing thesis:
Our unchanged 2023 EPS forecast of $224 assumes a soft landing and is above the top-down consensus of $206. GS Economics assigns a 25% probability of recession in the next 12 months, compared with 65% for consensus. The P/E multiple of 19x is greater than we expected, led by a few mega cap stocks. But prior episodes of sharply narrowing breadth have been followed by a "catch-up" from a broader valuation re-rating.
However, on June 21, Goldman walked all that back and said :
Investors should consider hedging the rally in the S&P 500 for recession-related risks...Bullish option positions look crowded, the rally has been narrow, valuations remain high, overly optimistic growth expectations are being priced in and overall investor posture isn't light anymore.
The Goldman's June 21 note in my view signals the end of the "June hype" and the top of the bear market rally. The June 16th top was also the futures/options expiration date, when most vulnerable shorts were forced to cover. Goldman actually acknowledges the high probability of an imminent recessionary selloff.
Implications
Goldman said it perfectly in the quote above: get ready for the recessionary selloff. Goldman sees the S&P 500 down to 3400 if the recession materializes:
There's a one in four chance of recession over the next 12 months and if that prospect become more likely, the S&P 500 could decline to 3,400.
In my view, the probability of a recession is near certainty, given the record inversion of the yield curve, and especially given that the Fed is still not done increasing the interest rates. While we are waiting for the lagged effects of the cumulative 500bpt of the Fed's recent hikes, the Fed still has at least 50bpt in additional hikes.
It seems like growth is stalling, while the core inflation still remains sticky at a very high level. Thus, the Fed could be forced to hike while the economy is entering a recession. This supports the hard-landing scenario, with a longer and deeper recession than currently expected, and likely puts the S&P 500 below the 3000 level.
For further details see:
S&P 500 Top Likely At 4450, Get Ready For The Bear Market Phase 2