QVML - S&P 500: Volatility Returns And Tsunami Brews
Summary
- To us, last Friday’s bloodbath signals that high volatility is back. Equity tends to suffer under high volatility.
- Furthermore, our view is that such high volatility could persist due to several fundamental forces at play, ranging from inflation, to interest rates, and to the housing market.
- We see these forces similar to those that brewed during the 2008 financial tsunami.
- The combination of inflation and surging mortgage rates alone could put housing affordability in serious jeopardy and delinquencies could surge.
- And our action plan is to hold onto a sufficient level of cash reserve, and at the same do not use (or not increase) leverage.
Thesis
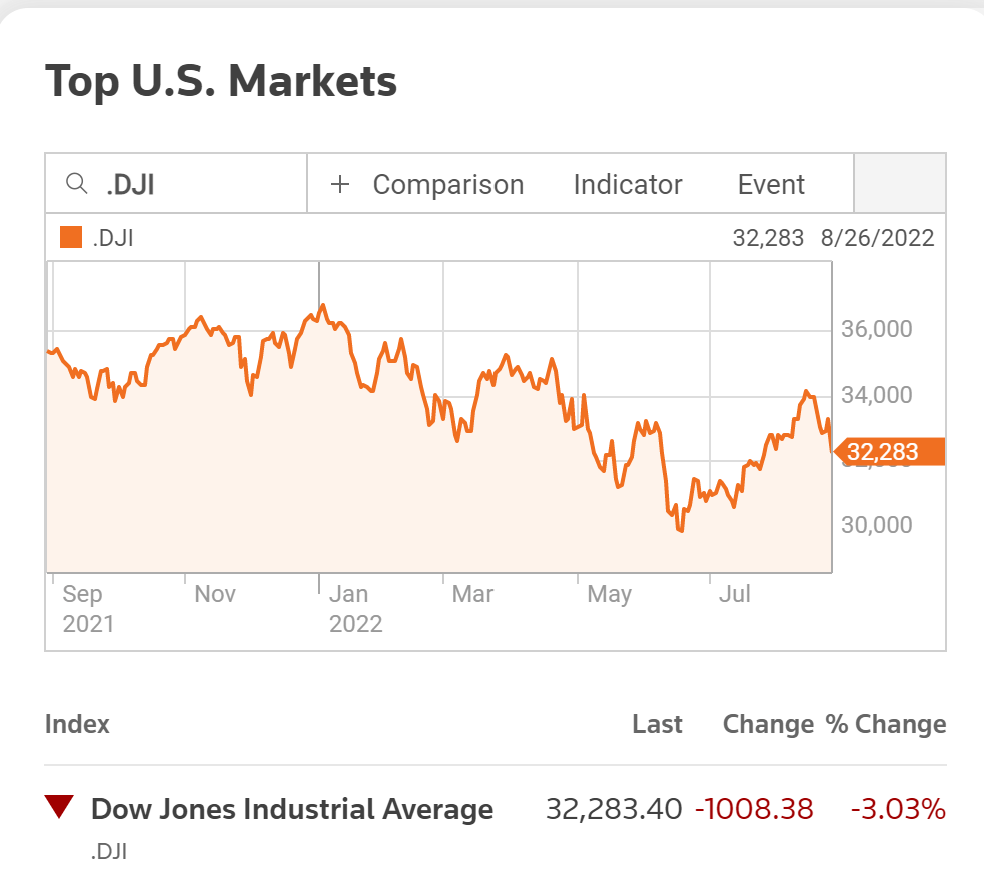
The US stock market has experienced a short-term “bull market” from the end of June till last Friday. Volatility decreased from the 35 levels in mid-June to a bottom of below 20 in mid August as you can see from the following chart. Under this perspective, you can see that the market spent the first half of the year under extreme nervousness, with the volatility hovering above the 90% percentile of its historical levels most of the time and many trading sessions even above the 96% percentile. The market’s nerves finally calmed down a bit in July. Then came last Friday. Volatility surged from as low as about 19 a few days ago to a peak level of about 27.5. At the same time, the S&P 500 ( SP500 ) plunged and the Dow Jones Industrial Average lost more than 1000 points in one day as you can see from the second chart below.
And the thesis of this article is two-fold. First, we believe such heightened volatility will persist further into the future, for several fundamental reasons. You will see in the remainder of this article that the reasons include inflation’s upward spiral, Fed’s hawkish rate plans, and also pressure from the labor and housing markets. Second, both backtest results and our own experiences have shown that high volatilities are bad for equities. Therefore, as an action, we will be holding onto a healthy level of cash reserves (we will elaborate more on our cash reserve strategy a bit later) in the months ahead and at the same avoid increasing leverage. And we recommend you do the same.
And we will examine the first underlying macroconditions immediately below: Inflation.
Yahoo Finance
Source: Reuters
Persisting Inflation
The catalysts for the mini bull run since July have been multi-fold, with the major factor being the decline of inflation expectations together with the fiscal policy booster. And a highlight involves the passing of the Inflation Reduction Act.
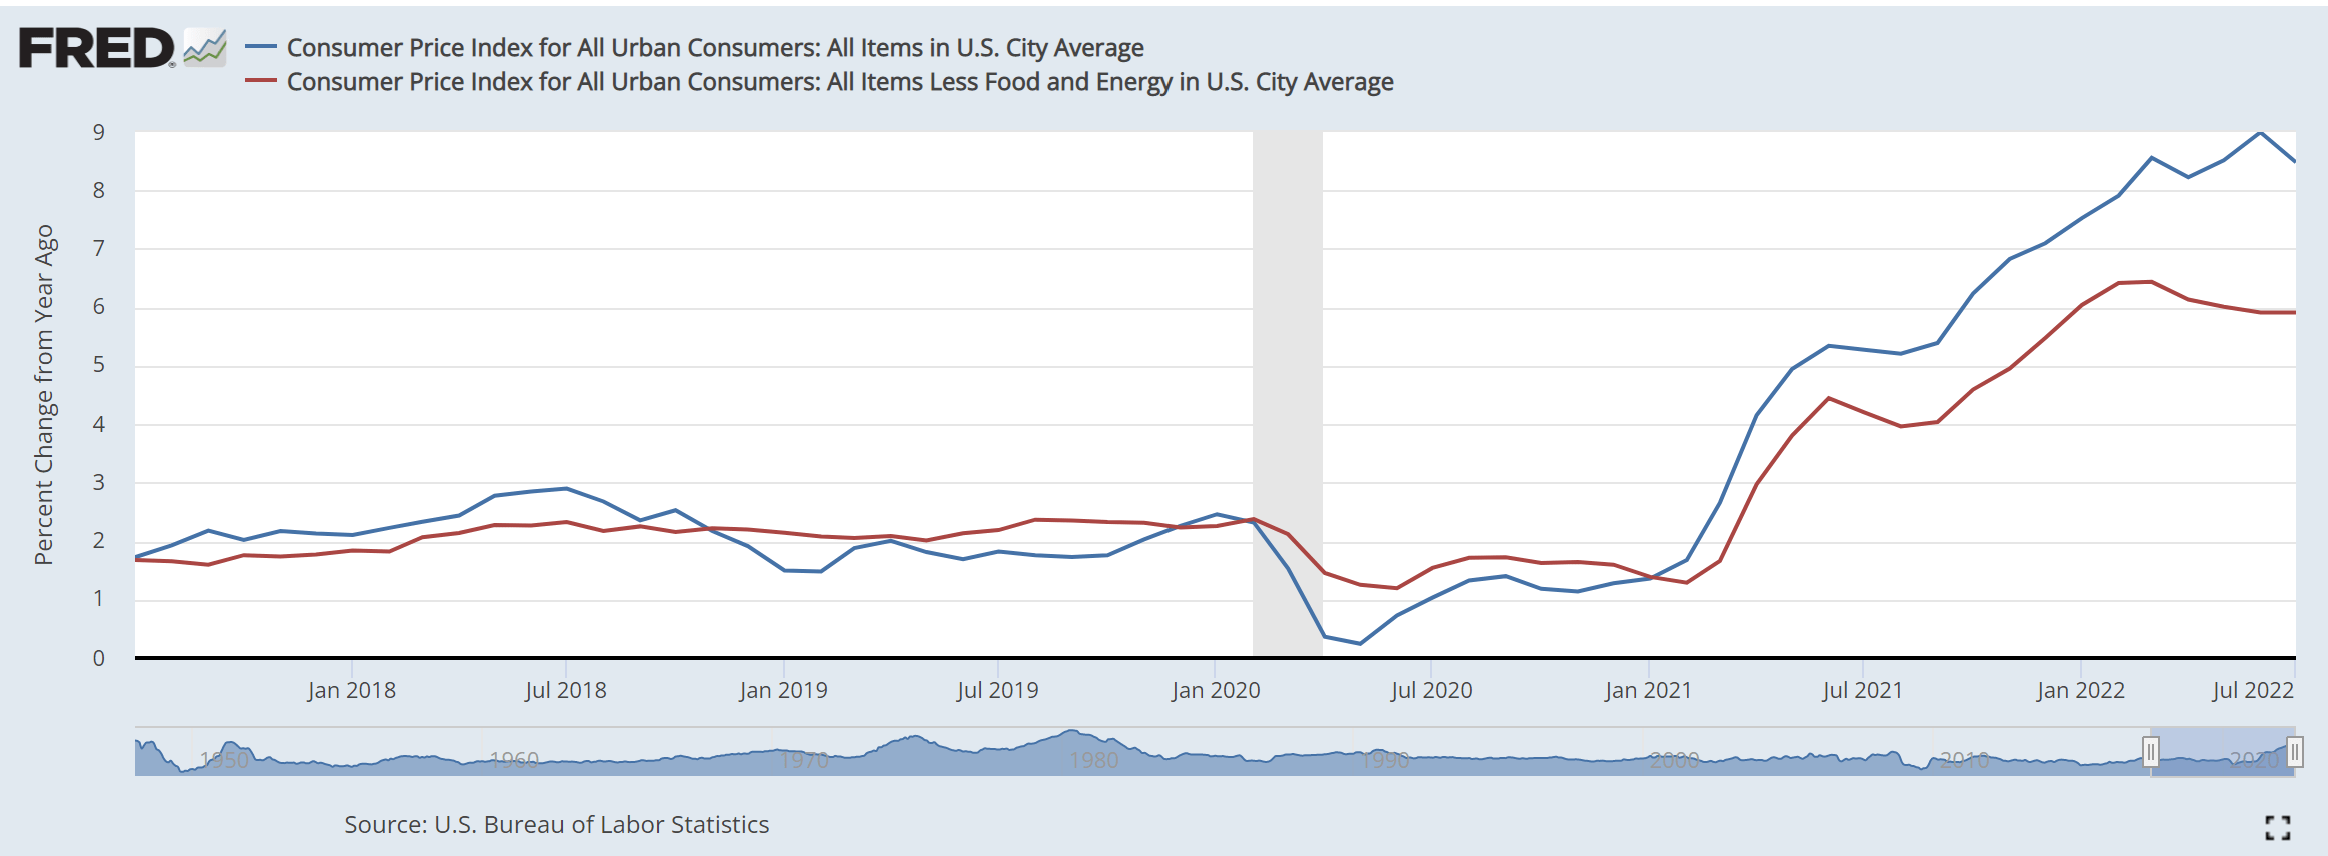
However, the last data show that the inflation expectation might be a bit too optimistic. See the data below that FRED published on the Consumer Price Index (“CPI”) for All Urban Consumers, reflecting the current level of inflation in the U.S. Following the year-over-year change of 8.3 percent in the first quarter of 2022, this Index increased by 9.1 percent in the second quarter again. The 9.1-percent increase in the all-items index was the largest 12-month increase since the 12-month period ending November 1981. From the chart below, you can also see that energy is the major contributor to this increase. Energy prices rose 41.6 percent over the last year, the largest 12-month increase since April 1980.
FRED
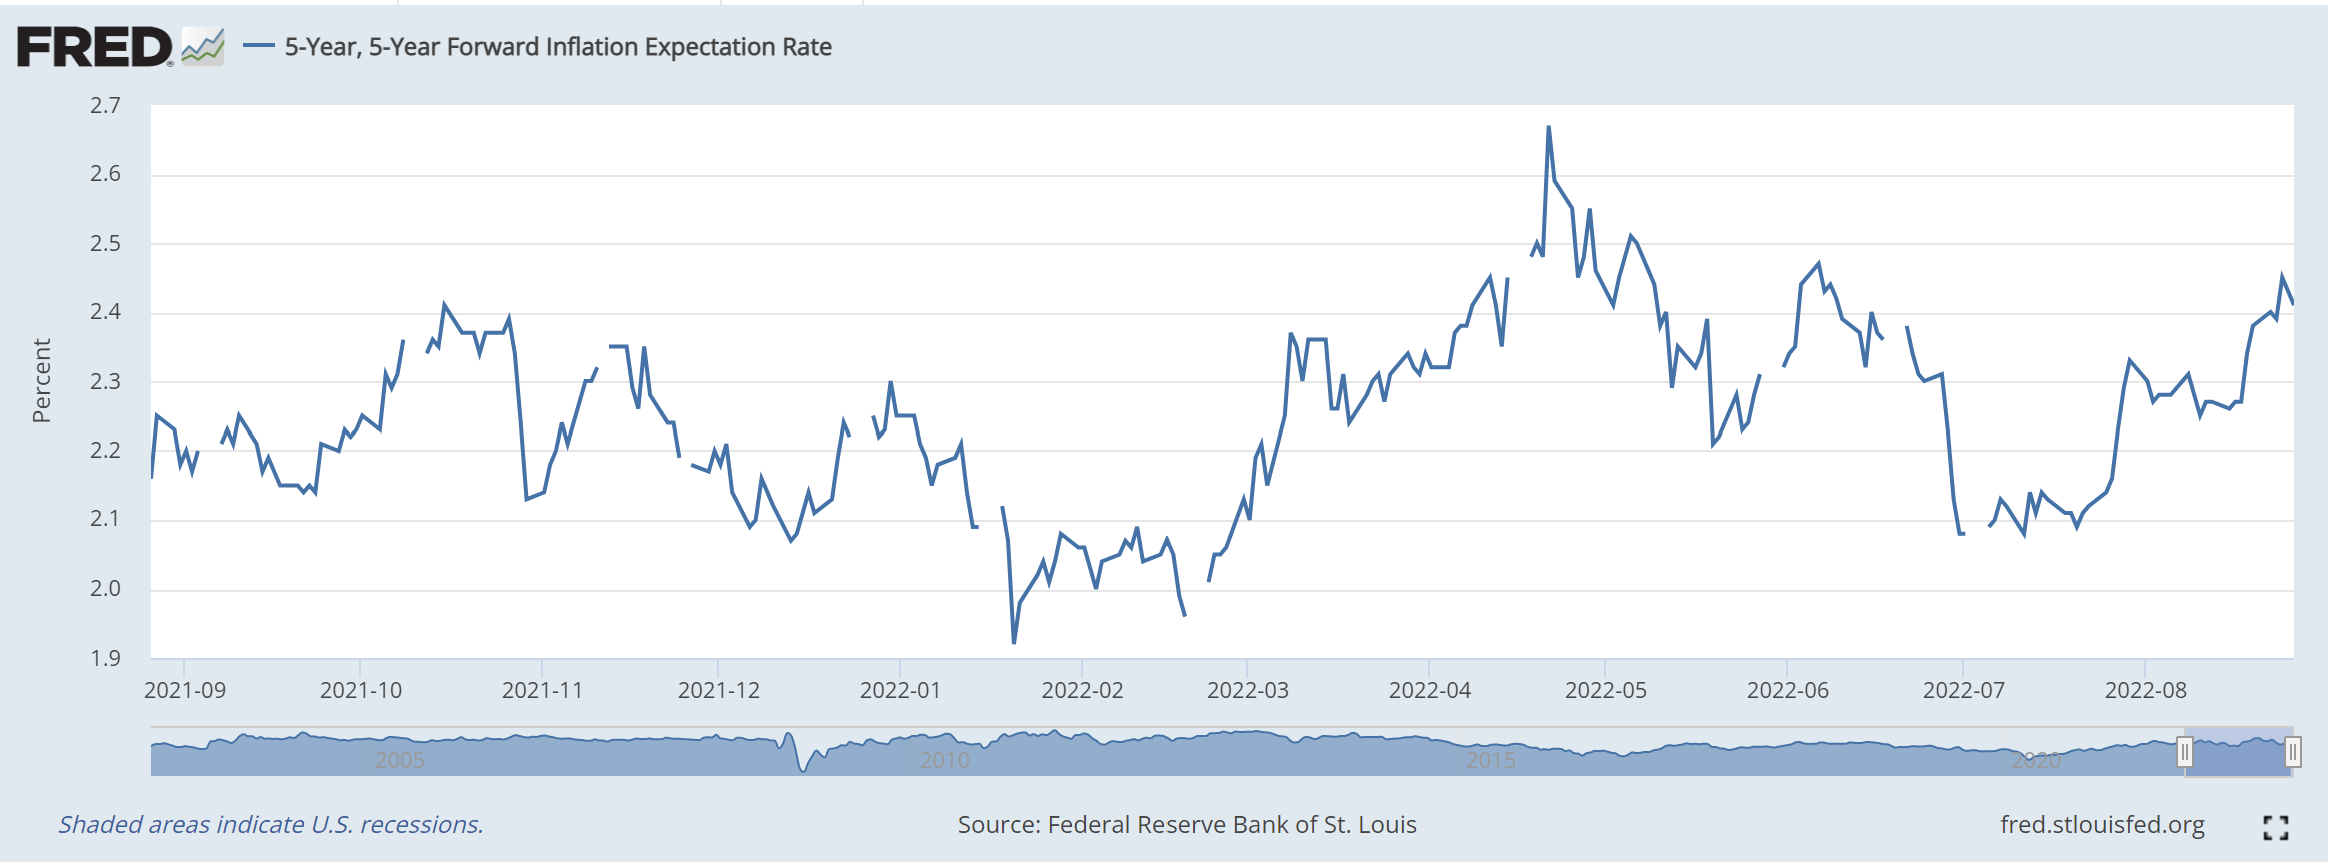
In the next chart, you can see how the market expected inflation to quiet down in July. The expectation curve dropped sharply to the 2.1 percent range in July. The five-year forward inflation rate curve fell at the beginning of June and became flat in August. Then we all know what has happened to this expectation. Following the multiple rate hikes in the past few months, the Federal Reserve reiterated its hawkish plan and the determination to keep raising rates to fight inflation "until the job is done." The market then had to adjust its inflation expectations and the expectation curve immediately picked up as you can see from the chart below.
Looking forward, we see a high level of inflation persisting or even further spiral up. Energy costs might resume their runaway increases as the Russian/Ukraine situation continues. Prices of food, fertilizer, and basic materials might further escalate too due to a combination of the Russian/Ukraine war, global supply chain disruptions, and pandemics.
FRED
Hawkish Interest Rate Plans
The second reason that made us believe high volatility will persist - interest rates.
Two of the most potent tools in the Federal Reserve’s toolbox to combat inflation are interest rates and open market operations. But there's the possibility that the current ongoing inflation is partly due to an overly expansive monetary and fiscal policy to start with. In this case, my view is that the raises in an interest rate now would be less effective based on data from historical cycles.
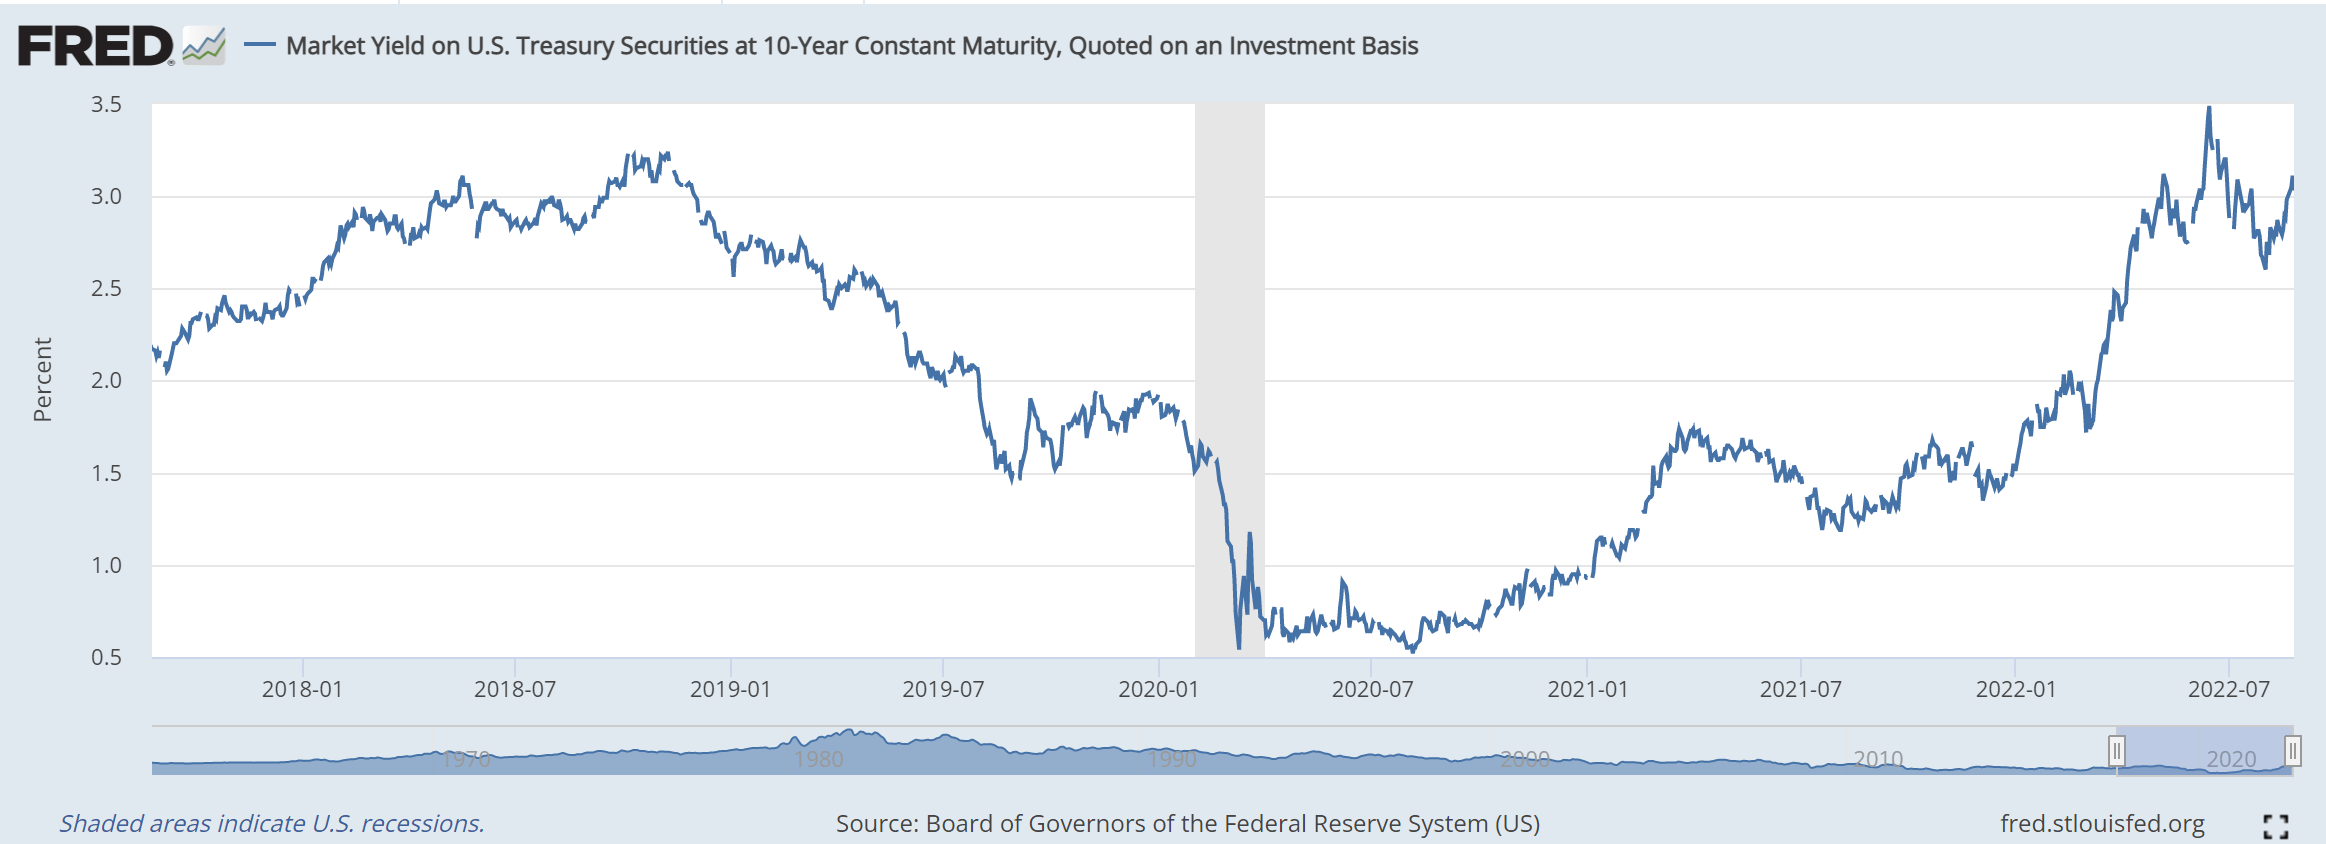
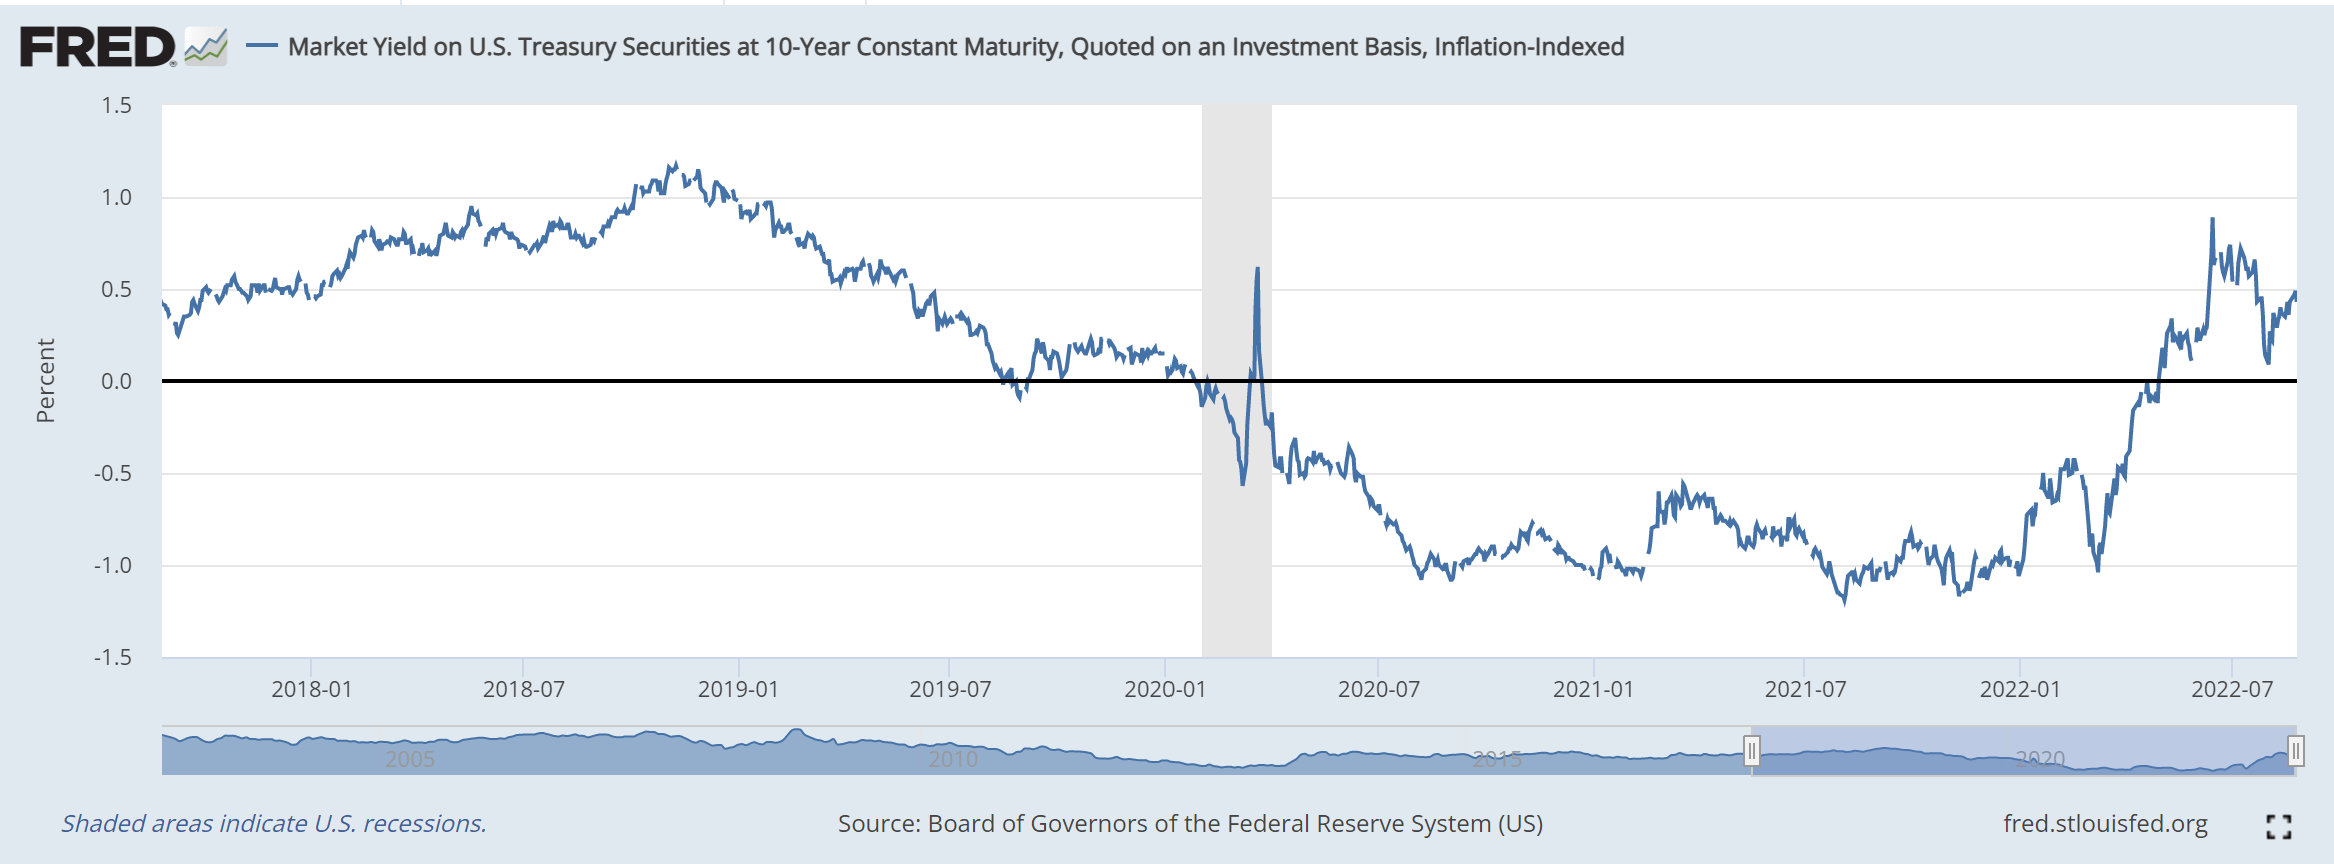
The charts below show the nominal and real interest rate curve for the 10-year treasury bill from 2018 to now. The last trough of interest rates occurred in early 2020, which occurred when the Federal Reserve decided to lower the Federal funds rate to zero to fight the COVID-related market crash. The 10-year real interest rate reached -1.17% in early November 2021, which also is the lowest level since 1997. Starting in 2022, the Treasury Department has been executing a fiscal policy of reversal together with the Fed. The Fed has added 225 basis points to the Federal Funds Rate, together with a shrink of its balance sheet. The market already has priced in the Fed's rate hike and balance sheet reduction in 2022. However, the reduction of the balance sheet at this scale does not have many comparable historical reference points, and the market's pricing on this is actually very vague.
FRED
FRED
So here let’s just speculate on a few outcome scenarios if the Fed continues shrinking its balance sheet. Compared with the last round of reduction of the Fed's balance sheet (from the fourth quarter of 2017 to the fourth quarter of 2018), we see the following three potential differences this round and all these potential differences point to higher interest rates.
- Liquidity. The Fed's overnight reverse repurchase program currently implies at least 2 trillion of excess liquidity in the market. However, when the balance sheet was reduced in 2018, the liquidity was about zero. So, this round, when compared to the previous round, feels to me like using a small bowl to scoop out water from a large bathtub. And it could take a long time to affect liquidity and/or inflation in the end.
- Real interest rates. The current real interest rate is lower than when the balance sheet reduction ended in 2018, but the possibility of long-term real interest rates rising in the next 12 to 18 months has increased in my view. For example, if the crude oil price continues to rise after consolidating at the current position, then inflation will keep picking up, and the interest rate of government bonds will have to continue to rise.
- Mortgage rates. It has been three months since the Fed called for shrinking its balance sheet in May, but I have not observed the apparent effects yet. Mortgage rates have risen by 300 basis points, and 90% of the Fed’s mortgage-backed securities have an interest rate lower than the current mortgage rates. Unless due to relocation, most people don't have the incentive to repay at high prices and high-interest rate home loans. Therefore, the Fed's hope to rely on prepayment of home loans to shrink its balance sheet is likely to fail. And I will elaborate on the role of the mortgage rates and the housing market a bit more in the next section.
Labor Market and Housing Market
The third factor that could cause high volatility involves the uncertainties that the labor market and housing market are facing.
The labor market plays a vital role in the Fed's policy in balancing employment stability and price stability. Tracking the Q2 labor report released by BLS helps to understand why I expect more rate hikes. The U.S. economy added 528k jobs in July 2022, much better than the market forecasts of 250k and above an upwardly revised 398k in June. Because of the strong labor demand and continued constraints in labor supply, labor costs soared while labor productivity continues to tumble. Compared to the same quarter a year ago, unit labor costs were up by 9.5%, reflecting the largest increase since the first quarter of 1982.
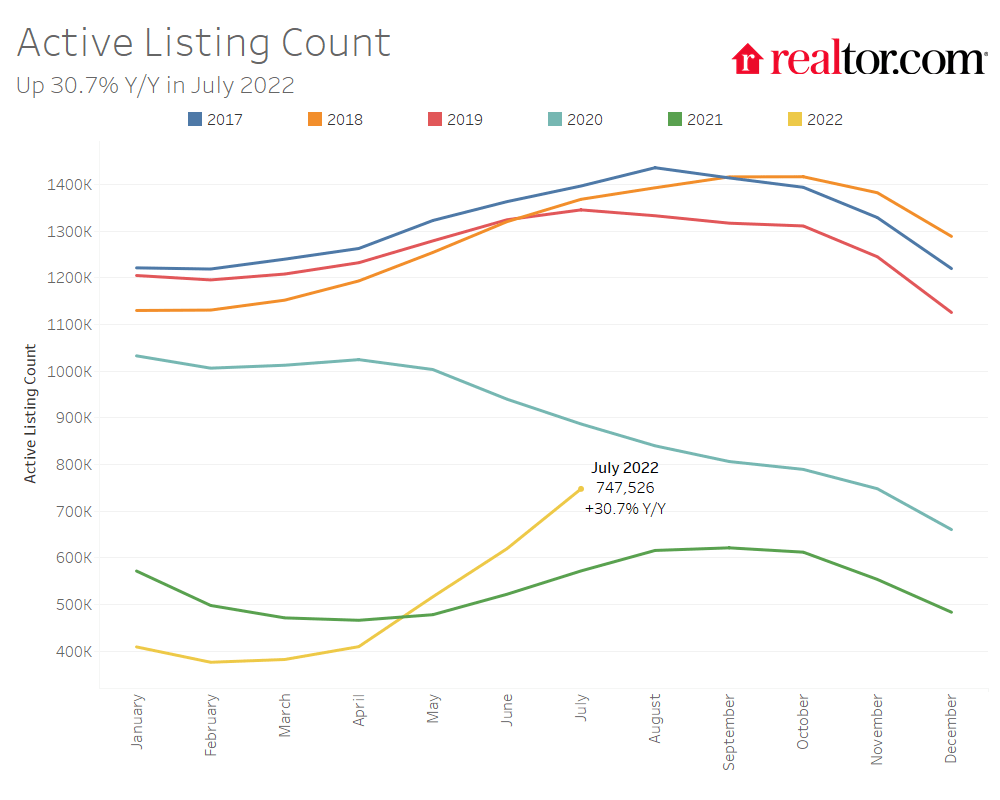
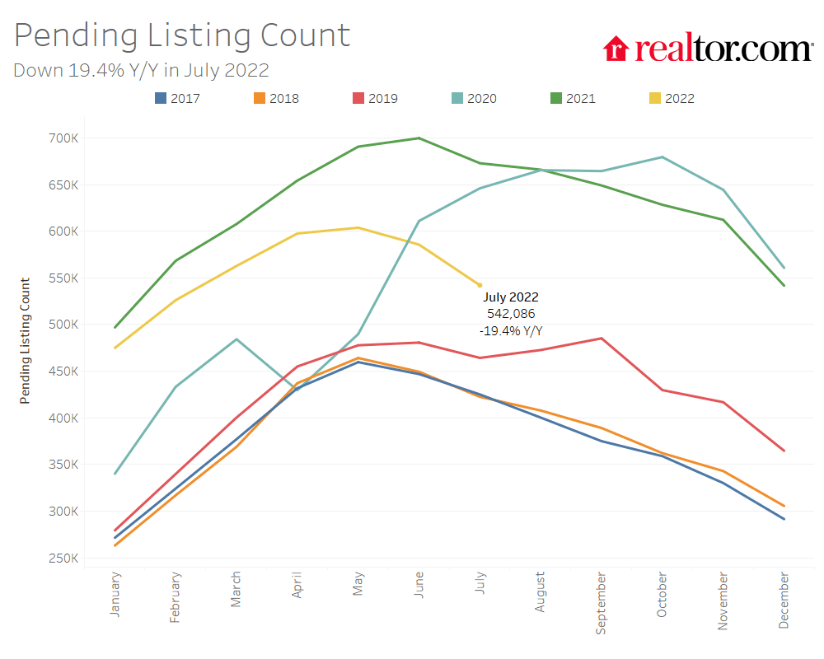
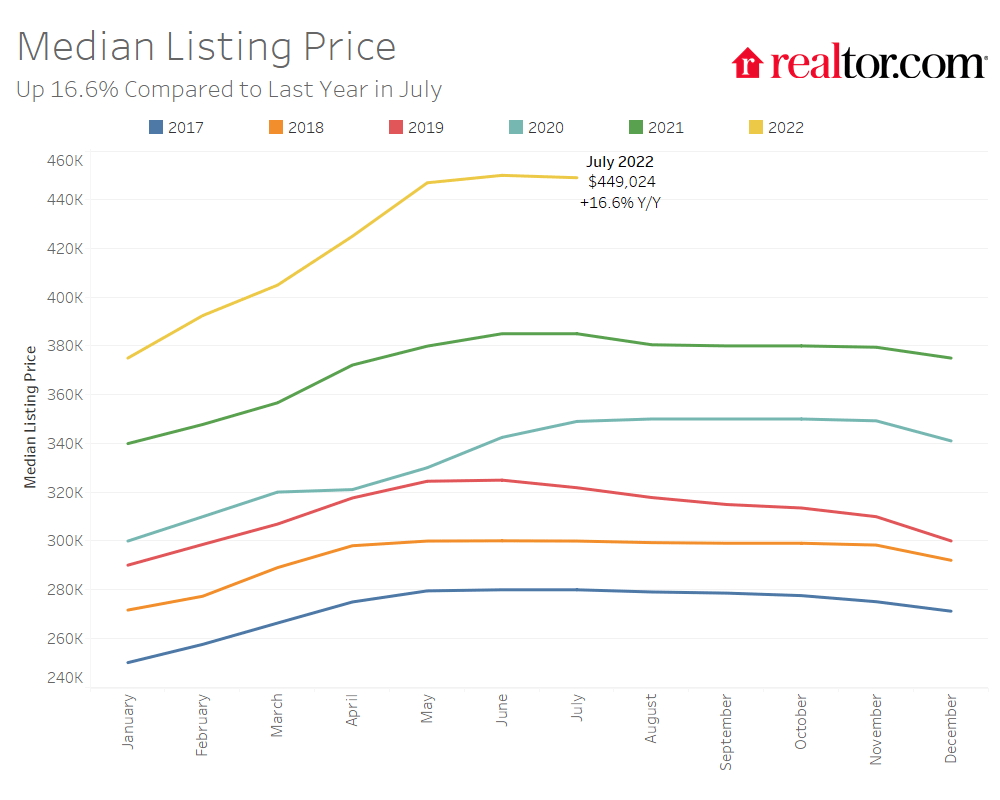
Next, let’s take a look at the housing market to see if the supply constraints have been eased by increased interest rates. In July 2022, the number of homes for sale in the United States increased by 30.7% over the same period of the year as you can see from the first chart below. But it was still 15.7% less than in 2020, and 45.4% less than the normal year of 2017-2019 before the epidemic. Pending listings fell 19.4% from a year earlier, compared with a 16.3% drop in June as you can see from the second chart below. And as shown in the third chart, the median house price was still up 16.6 percent to $449,000. All told, the net result is that buyers have been affected by rising interest rates and rising housing prices at the same time. They have been making 80% of home purchase costs 53% more expensive than a year ago.
To me, this represents a huge risk going forward. If/when interest rates go up further, mortgage rates will likely follow in tandem. Coupled with persisting inflation, housing affordability could be in serious jeopardy and delinquencies could surge. In the end, we could be facing a financial tsunami, not unlike the one in 2008.
Source: Realtor.com
Source: Realtor.com
Source: Realtor.com
Final thoughts and action plan
In summary, historical data have shown that high volatility tends to hurt equity performance. And we're seeing several fundamental forces that could cause high volatility to persist or even further elevate in the near future. The inflation expectation rate has picked up, energy prices continue to lead the upward spiral, and the Fed needs to raise rates aggressively to reduce the excess liquidity in the market. Labor costs soared while labor productivity continues to tumble. Housing supply and demand discrepancies are not fully eased by the fiscal and monetary policies thus far.
This gloomy combination reminds us of the market forces that led to the 2008 financial crisis. To us, we feel the combination of inflation, high housing price, and high mortgage rates alone could put housing affordability in serious jeopardy and delinquencies could surge.
O ur action plan - we will hold onto a sufficient level of cash reserve, and at the same do not use (or do not increase) leverage. High volatility will inevitably create many tempting opportunities for investors to attempt to catch the market "at its bottom." And we urge you to fight such temptations and stay disciplined. Capital preservation becomes a high priority considering the combination of historical volatility and high uncertainties ahead.
As a simple way to allocate cash reserves in a disciplined way, investors could monitor the summation of stock yield and Treasury bond yield. The summation provides a measure of the overall opportunity cost of holding cash (hope this is quite intuitive and self explaining). If the summation is high, it means the opportunity cost of holding cash is high, because you could earn a high yield if the cash is invested either from bonds or stock. And you should hold less cash in this case. And vice versa. Hope the idea is quite intuitive and self explaining (if not, more details can be found in my earlier article on dynamic cash allocation ). And it's quite simple to execute in practice. You just need to monitor the summation, set a few trigger points based on this summation, and stick to those trigger points to deploy/reserve your cash.
For further details see:
S&P 500: Volatility Returns And Tsunami Brews