VOO - S&P 600 Vs. S&P 400 Vs. S&P 500: Future Looks Bright For Mid And Small Caps
2023-05-25 07:16:24 ET
Summary
- Historically, we have seen strong outperformance by the S&P 400.
- However, over the past 10 years, the S&P 500 has dominated the other two indices and is likely to do so in a recession.
- When times are tough, it is a good time to build a position in small and mid-caps, as they are very likely to outperform in a normal environment.
Thesis
The first time I read about the outperformance of small-cap indices was in A Man for All Markets by Edward Thorp. Since then, I have had the S&P 400 ( IVOO ) and S&P 600 ( VIOO ) in my portfolio, and although I do stock-picking most of the time, I still have a portion of my portfolio allocated to ETFs.
And in the next few chapters I will show you why I think now is a good time to build a position in the small and mid caps, rather than buying their big brother, the S&P 500 ( VOO ). Given their current historically low P/E and their historical outperformance after economic difficulties, they are well placed to outperform the S&P 500 over the long term, as they have done in the past.
Analysis
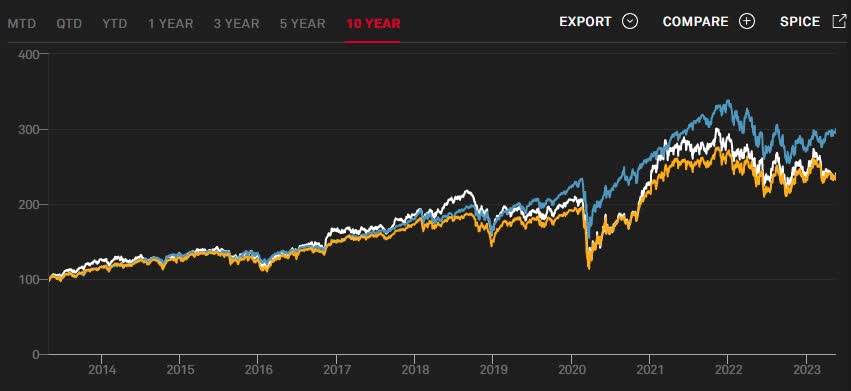
Here we can see that the three indices were almost identical until the end of 2019, when the outperformance of the S&P 500 began and was even more pronounced in 2020 and thereafter.
This has resulted in the following 10-year returns on an annualized basis:
- S&P 500: 12.24%
- S&P 600: 9.87%
- S&P 400: 9.80%
However, if we look at the long-term period analyzed by S&P ( SPGI ) from 1994 to May 2019, we see that small caps and especially mid caps have outperformed large caps by around 1-2% per year .
Since 1994, returns have been as follows:
- S&P 500: 9.67%
- S&P 600: 10.78%
- S&P 400: 11.70%
However, these higher returns have been accompanied by higher volatility.
- S&P 500: 14.64%
- S&P 600: 18.41%
- S&P 400: 16.98%
We clearly see that small caps are the most volatile, which is understandable given their size, and that both are more than 15% more volatile than their big brother. Moreover, most of the outperformance has been in up markets, as small and mid caps are more sensitive to macroeconomic conditions and therefore underperform in down markets.
This long-term outperformance is explained by lower liquidity and higher volatility, resulting in a risk premium and potentially greater growth opportunities.
Sector Breakdown
Author, Data from S&P Indices
As we can see, the sector breakdown of the S&P 400 and S&P 600 is very similar, with the top 3 sectors being Industrials, Consumer Discretionary and Financials, while the S&P 500 is dominated by Information Technology, Healthcare and Financials.
In general, based on these sector weights, I would say that the S&P 600 is probably the most diversified and this is even more evident when we look at the weight of the largest component and the weight of the top 10.
- S&P 500 : Largest: 7.2% / Top 10: 27.9%
- S&P 400 : Largest: 0.7% / Top 10: 6.1%
- S&P 600 : Largest: 0.6% / Top 10: 5.6%
Here we can clearly see the risk of a high dependence on the top 10 in the S&P 500, but we must add that this is also due to the fact that if companies grow strongly and quickly, they will be promoted to the next larger index, and as the S&P 500 is the largest, there is no room for promotion, so the winners are left to grow.
But for some people that kind of risk is not what they like and they like more diversified ones like the small and mid caps, but even with the S&P 500 they have the opportunity to get the equal weighted ones.
Earnings Growth Rate
Comparing 5-year annual earnings growth rates, the S&P 500 has the highest at 17.8% versus 15.4% for the S&P 400 and 14.5% for the S&P 600 . However, the long-term earnings growth rate for the S&P 500 is closer to 7%. Therefore, for my calculations I will use 7% for the S&P 500, 6% for the S&P 400 and 5% for the S&P 600.
- S&P 500: 1.97x after 10 years
- S&P 400: 1.79x after 10 years
- S&P 600: 1.63x after 10 years
Dividends
Here you can see the dividend yields over the last 10 years and I think I can use 1.7% for the S&P 500, 1.5% for the S&P 400 and 1.2% for the S&P 600 as a good guideline for the next 10 years. This gives us the following multiples.
- S&P 500: 1.18x
- S&P 400: 1.16x
- S&P 600: 1.13x
Multiple Expansion
This is where it gets interesting , as both the S&P 600 and 400 are below their 10-year medians and therefore have the potential for multiple expansions, while the S&P is above its 20-year median and therefore has the potential for multiple compressions.
- S&P 500: Median: 16.0x Today: 23.0x = 0.70x
- S&P 400: Median: 17.0x Today: 11.8x = 1.45x
- S&P 600: Median: 18.4x Today 13.3x = 1.39x
Potential 10-year Return
- S&P 500: 1.97 x 1.18 x 0.70 = 1.63x or 5.00% annual
- S&P 400: 1.79 x 1.16 x 1.45 = 3.01x or 11.65% annual
- S&P 600: 1.63 x 1.13 x 1.39 = 2.56x or 9.86% annual
Conclusion
Because of the potential for multiple expansion, the S&P 400 currently has the best long-term prospects, and the S&P 500 could have a weaker-than-expected 10-year return because of its currently elevated multiple.
However, it is important to remember that small and mid caps are more vulnerable to recessions and could therefore fall further, while the S&P 500 is more recession-proof due to its more established companies.
It is also a question of whether an investor can stomach the higher volatility or whether they like the sector mix. But all in all, in difficult times it is a good idea to build up a position in small and mid caps, as they are likely to outperform once the economy recovers.
For further details see:
S&P 600 Vs. S&P 400 Vs. S&P 500: Future Looks Bright For Mid And Small Caps