RGLD - Sandstorm Gold: Trading In A Tight Range
2023-04-06 12:21:53 ET
Summary
- Sandstorm Gold sold approximately 28,400 attributable GEOs and realized preliminary revenue of $44.0 million in 1Q23.
- Total revenues, including sales, Royalties, and income from other investments, were $54.0 million. It is a significant revenue jump, but will it be enough to justify the massive investment?
- I recommend buying SAND between $5.49 and $5.30, with possible lower support at $4.75.
Introduction
Vancouver-based Sandstorm Gold ( SAND ) released its preliminary 1Q23 production results on April 5, 2023.
Note: This article updates my previous article on Sandstorm Gold, published on February 22, 2023. I have been following SAND's quarterly results since 2015.
1 - 1Q23 Production and preliminary revenues
- Sandstorm Gold sold approximately 28,400 attributable GEOs and realized preliminary revenue of $44.0 million in 1Q23 (18,741 attributable GEOs and $35.4 million in revenue for the comparable period in 2022). However, Total Revenues, including sales, royalties, and income from other interests, were $54.0 million.
- The preliminary cost of sales, excluding depletion for the 1Q23 year, was $6.5 million resulting in cash operating margins of approximately $1,650 per attributable gold equivalent ounce ($5.3 million and $1,604 per attributable GEOs for the comparable period in 2022).
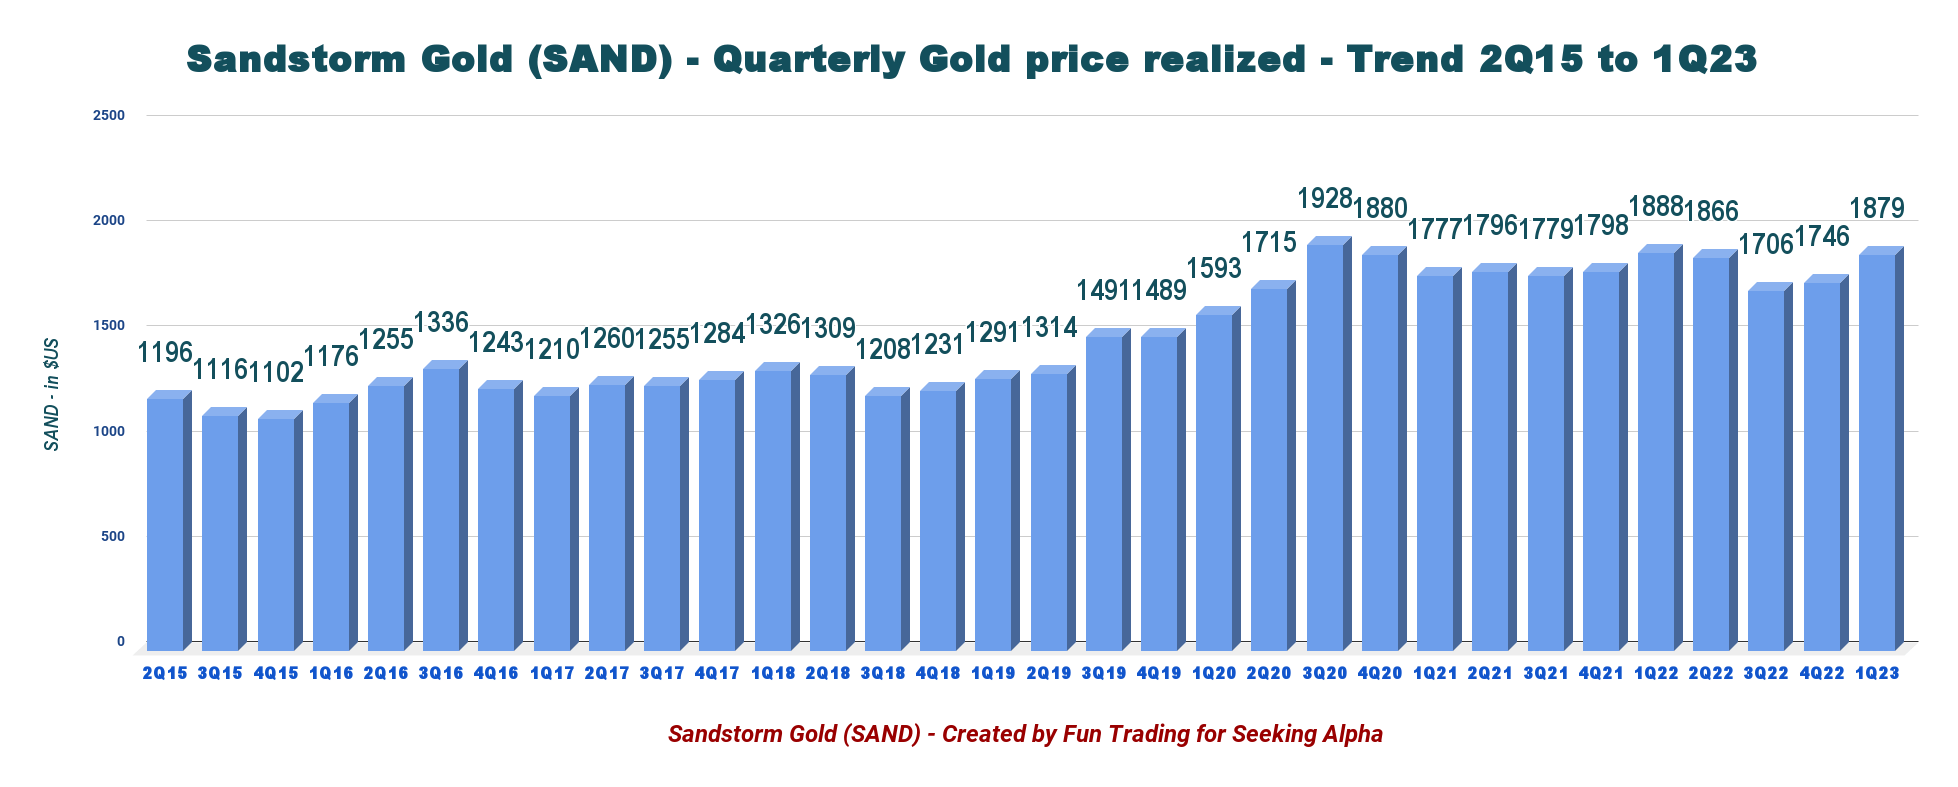
- The Company's Gold price for the 1Q23 was estimated at $1,879 per ounce .
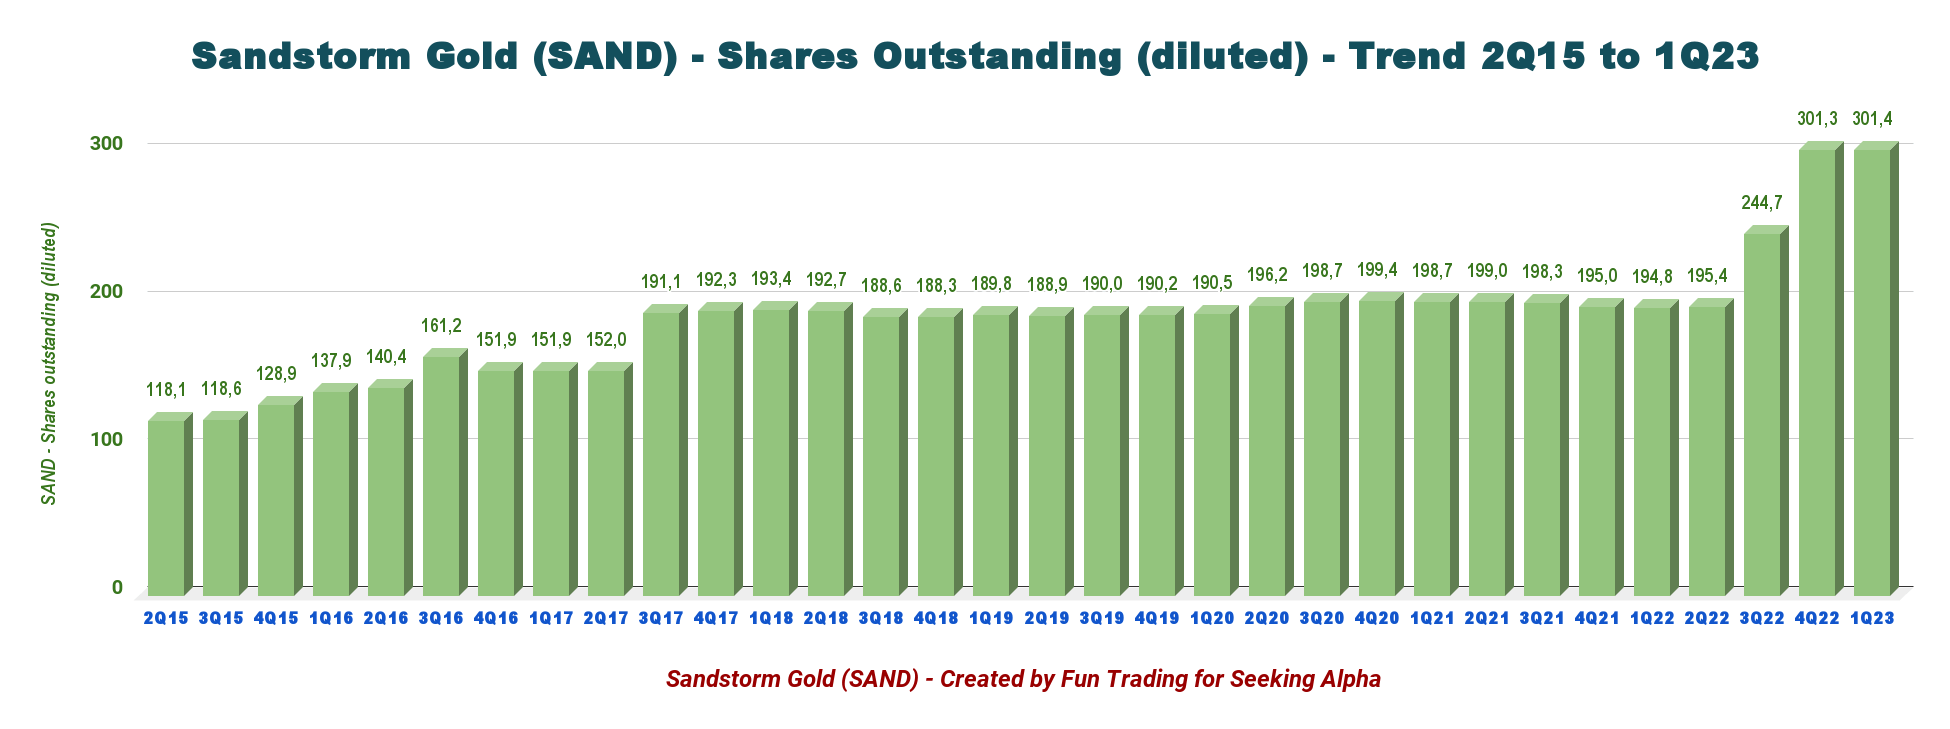
- As of March 31, 2023, the Company had 298,740,427 Common Shares issued and outstanding, 247,355,113 of which made up the “Public Float” (within the meaning of the rules of the Toronto Stock Exchange) and the 24.0 million Common Shares purchasable under the NCIB represents approximately 9.7% of the Company’s Public Float. However, the company shares outstanding diluted is estimated at 301.44 million shares.
SAND Quarterly Shares outstanding diluted history (Fun Trading)
Dilution is a constant issue for SAND.
SAND is buying back shares and indicated in the press release that:
In the last twelve months, the Company has purchased 336,201 Common Shares pursuant to its NCIB at a volume-weighted average price of approximately C$6.69 per common share on the TSX and alternative Canadian trading systems and approximately US$5.00 per common share on the NYSE and alternative US trading systems.
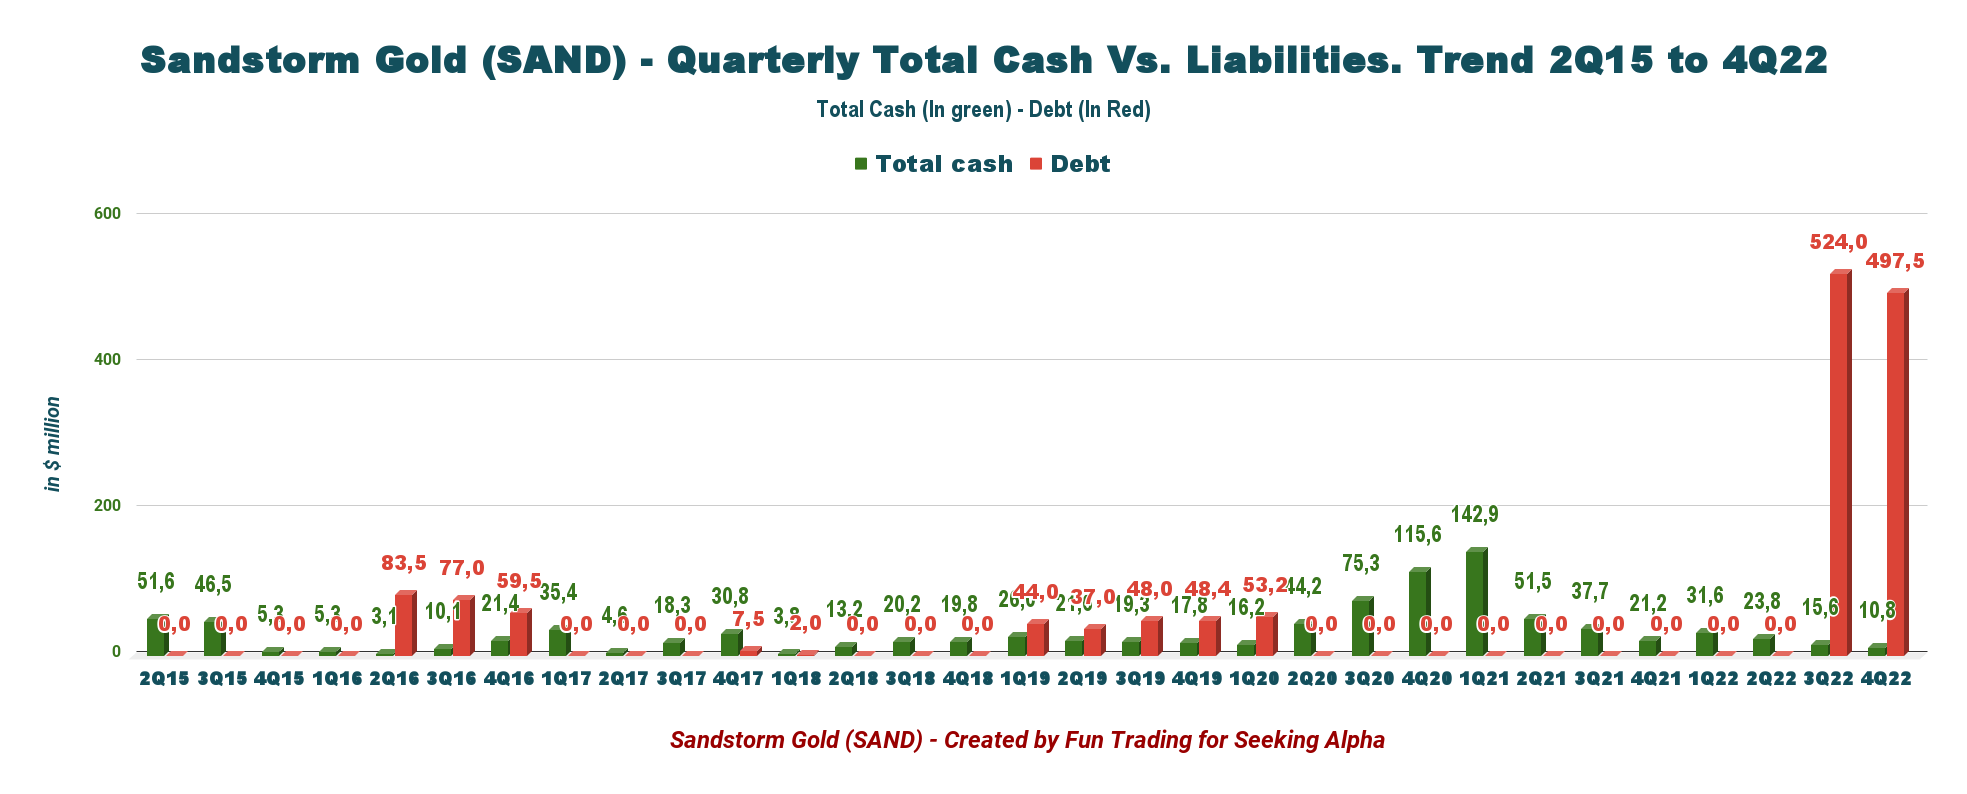
The chart above makes it hard to understand why management is using such cash to buy back shares. Instead, this cash would have been used to reduce debt which jumped to nearly $500 million in 4Q22.
SAND Quarterly Debt versus cash history (Fun Trading)
Note: Under the renewed NCIB on April 6, 2022, Sandstorm may purchase up to $24.0 million of its Common Shares, representing approximately 8% of the Company’s issued and outstanding Common Shares.
2 - Stock Performance
Sandstorm Gold is still one of the worst performers in this segment and is down 29.5% on a one-year basis. Seeing such a dismal performance when gold now reaches $2,020 per ounce is quite disheartening.
3 - Investment Thesis
As I said in my previous articles, SAND is an excellent trading tool, but I am less confident about the stock's long-term outlook, even though the gold price has rallied significantly for the past few weeks and is now $2,020 per ounce. My three streamers of choice are Franco-Nevada ( FNV ), Royal Gold ( RGLD ), and Wheaton Precious Metals ( WPM ).
However, I did not drop SAND entirely and hold a long-term position expecting some turnaround later in 2023 fueled by a bullish gold price. As we all say, a rising tide lifts all boats.
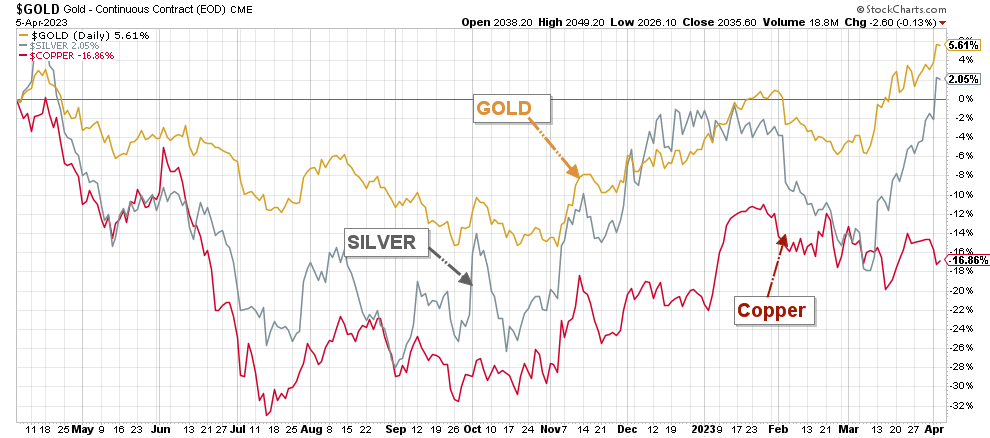
Gold and silver prices are performing very well, breaking the $2,000 mark for the first time since early 2022, as market instability caused by the failure of Silicon Valley Bank and First Imperial Bank, coupled with the resulting Credit Suisse takeover by UBS, shocked investors’ confidence.
SAND 1-Year gold silver prices performance (Fun Trading StockCharts)
The number one negative matter attached to Sandstorm Gold is the ongoing need to grow bigger by using common shares as an easy currency creating stock dilution and, subsequently, a long period of underperformance that seems never-ending no matter what. The immediate effect is that the stock trades in a tight range and never seems to break out, which is positive when trading LIFO.
Also, despite the large transaction size, over $1 billion, the final outcome is far from what shareholders should expect. Not even mention the risk of failure to deliver.
Consequently, one working strategy I often suggest, especially for SAND, is trading LIFO a minimum of 50% of your total position and keeping a core long-term position for a much higher payday if the company can succeed.
Gold Production And Balance Sheet Details
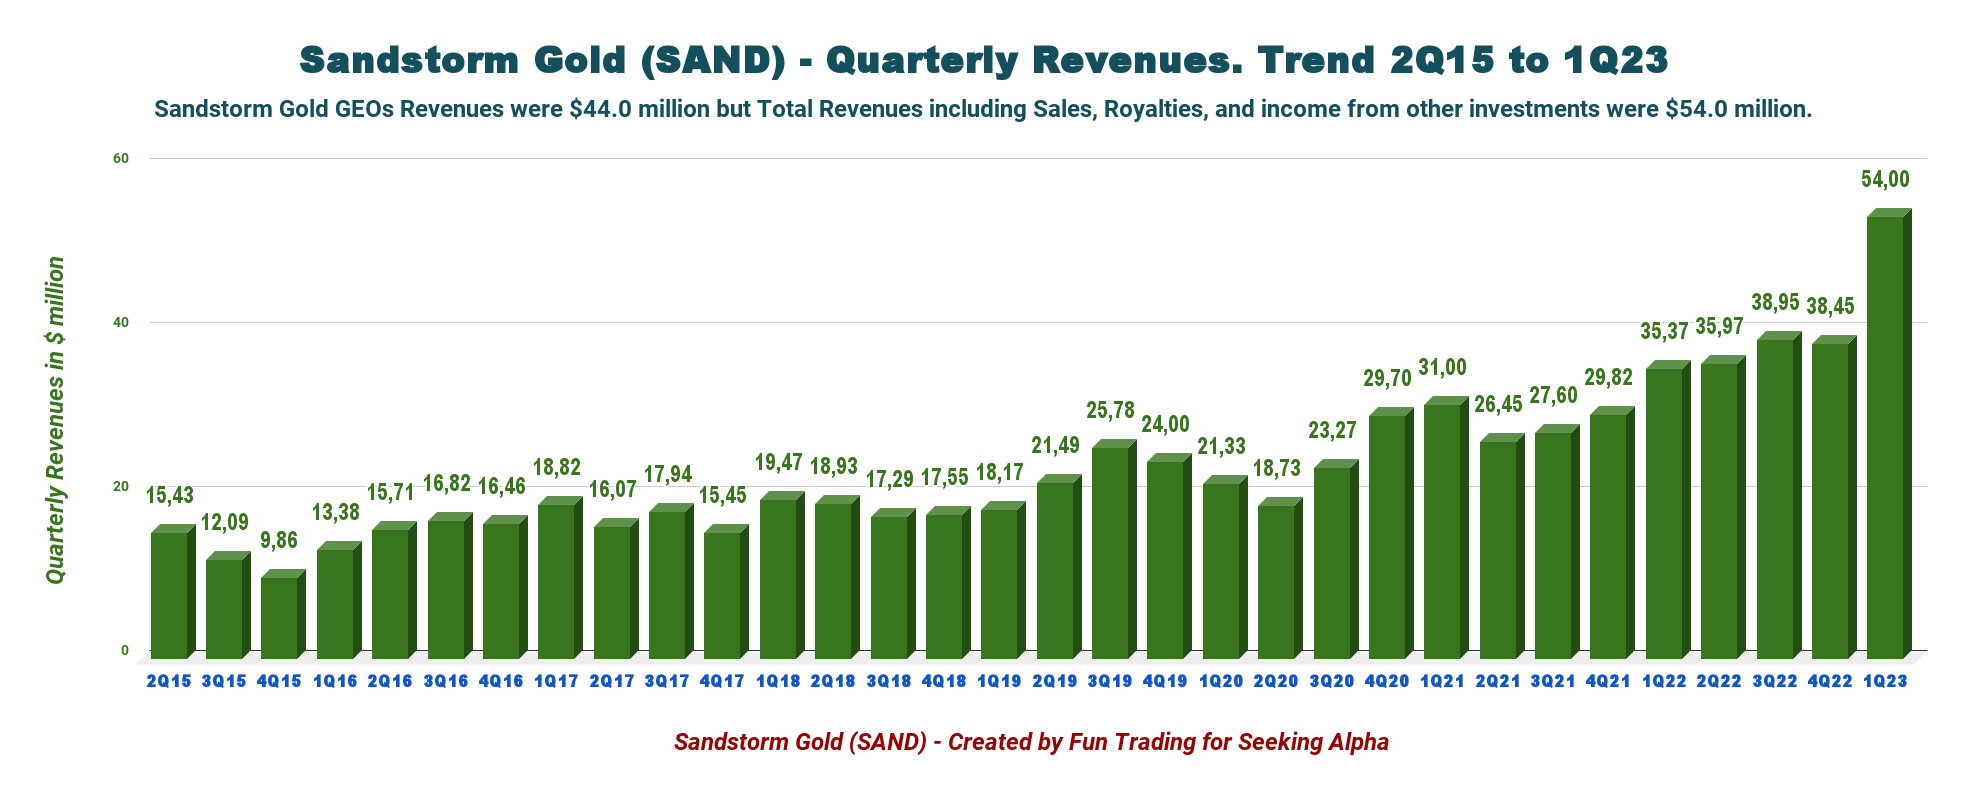
1 - Quarterly Total Revenues and Trends - Preliminary Revenues were a record of $54.0 million in 1Q23, with preliminary GEOs revenue of $44.0 million.
SAND Quarterly Revenues history (Fun Trading)
Sandstorm Gold sold approximately 28,400 attributable GEOs and realized preliminary GEOs revenue of $44.0 million in 1Q23, compared with $35.37 million for the comparable period in 2021.
Also, total revenues, including sales, Royalties, and income from other investments, were $54.0 million. It is a significant revenue jump, but will it be enough to justify the massive investment? I let the market decide.
The estimated cash costs per attributable ounce have decreased this quarter to about $229 per GEO after applying an operating cash margin of $1,650 per ounce indicated by SAND. Thus, the gold price realized by Sandstorm Gold is estimated at $1,879 per ounce.
SAND Quarterly gold price history (Fun Trading)
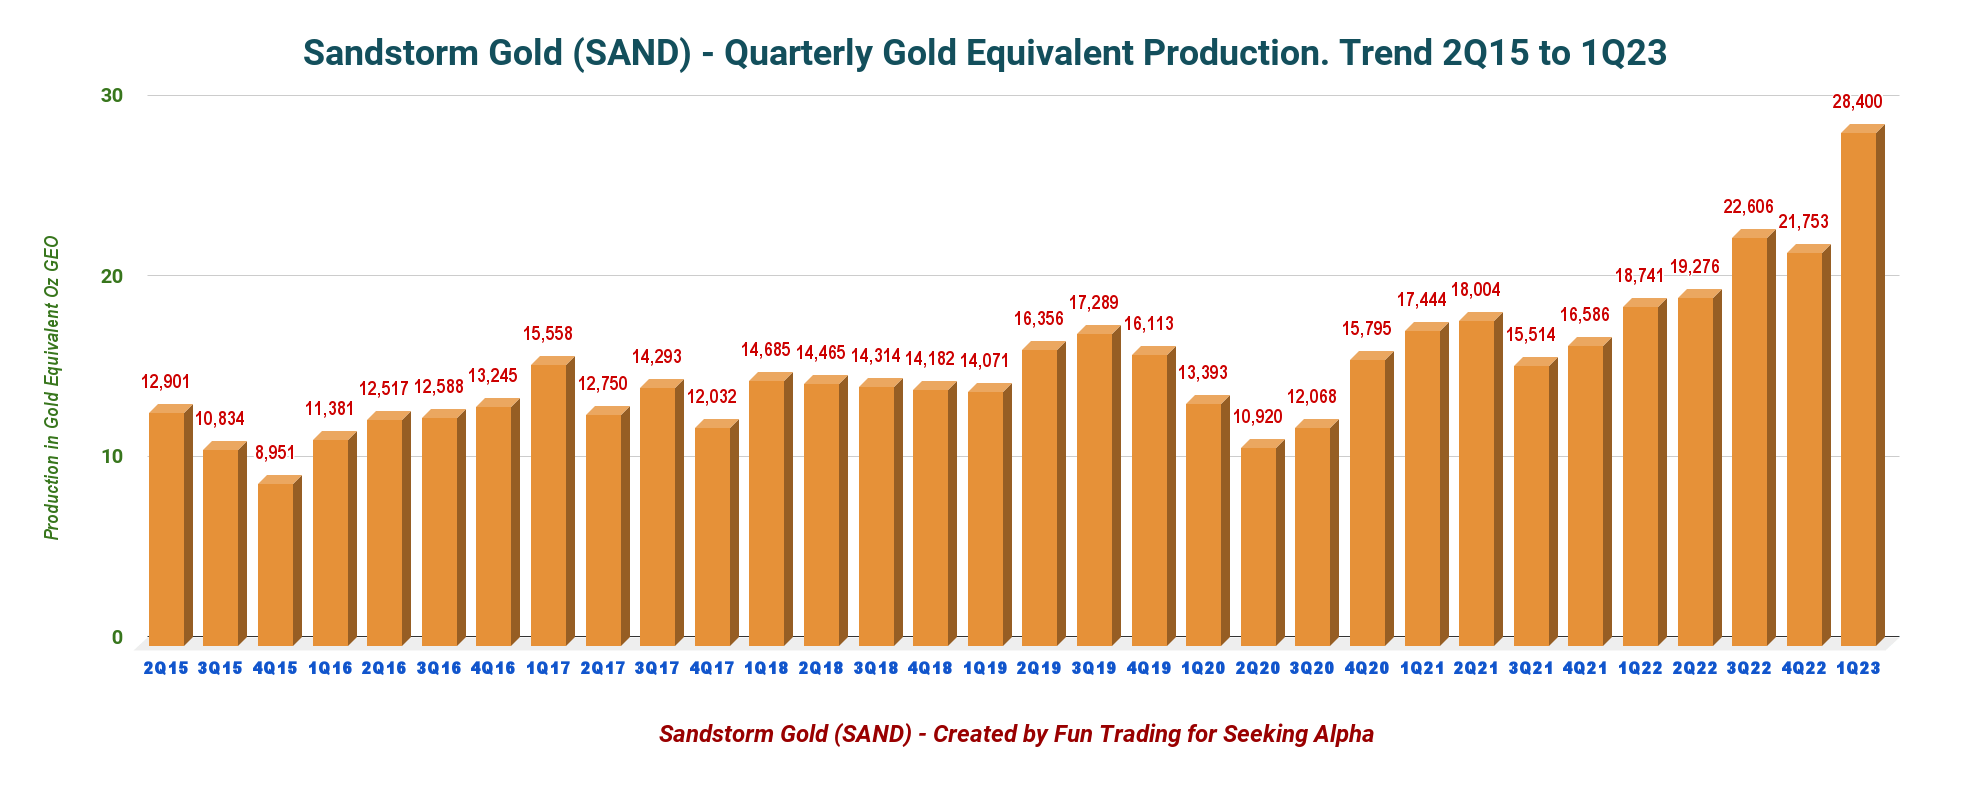
2 - Gold production details - Record production this quarter but no magic bullet.
SAND Quarterly GEO Production history (Fun Trading)
Attributable gold equivalent ounces sold for the quarter that ended March 31, 2023, were 28,400 ounces, compared with 18,741 ounces for the comparable period in 2022. A significant increase sequentially as well. SAND gold equivalent production was 30.6% higher than in the preceding quarter.
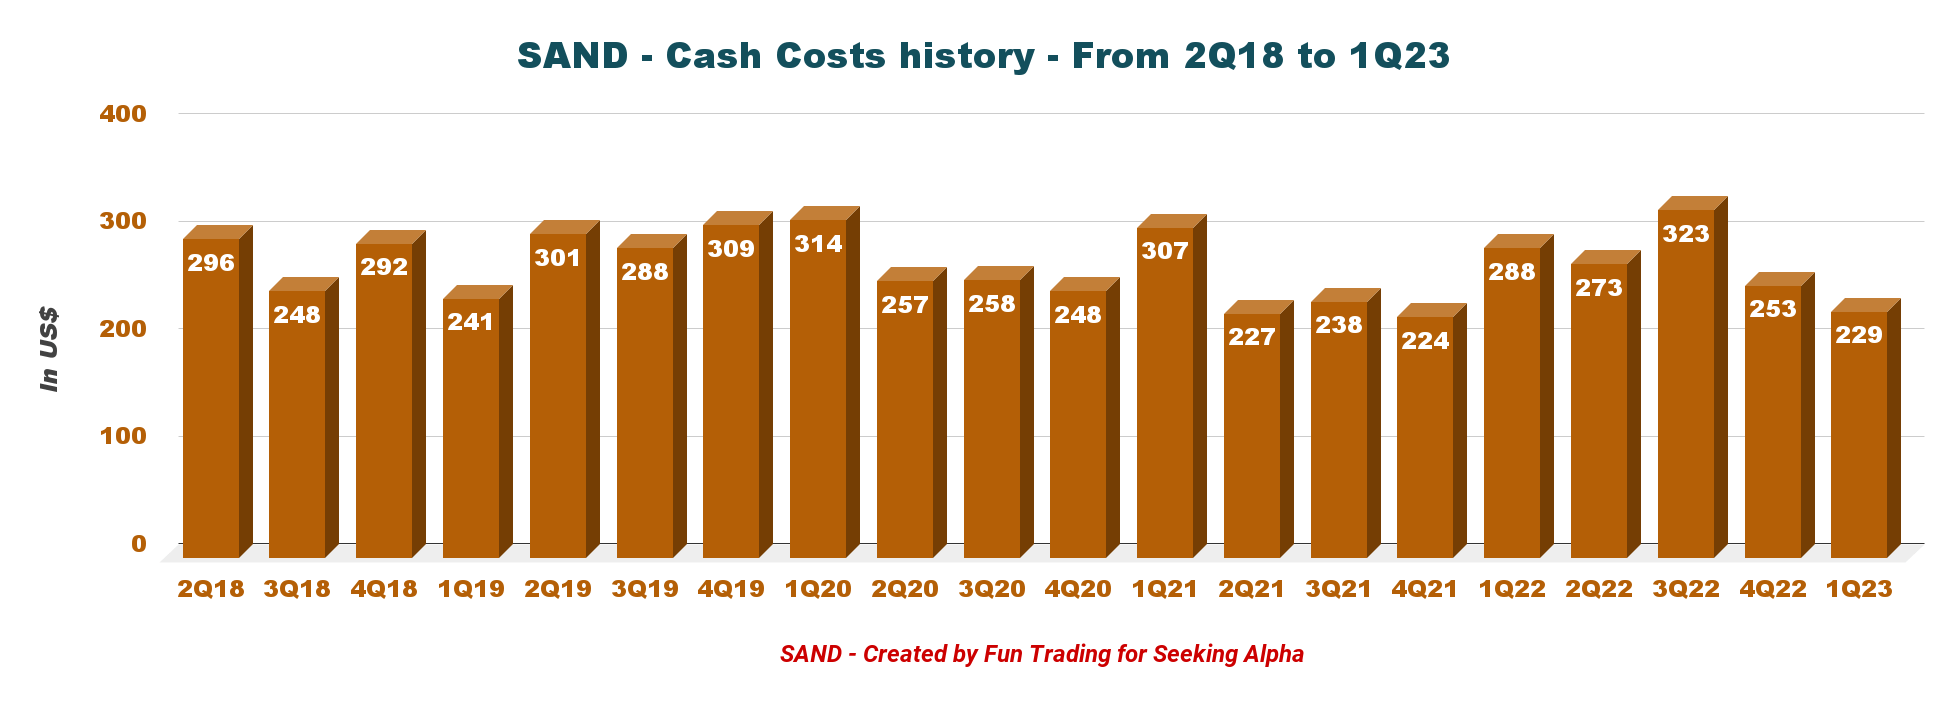
The quarterly cash costs decreased again to $229 per GEO, noticeable progress sequentially and among the best since 2018, as shown in the chart below.
SAND Cost of sales history (Fun Trading)
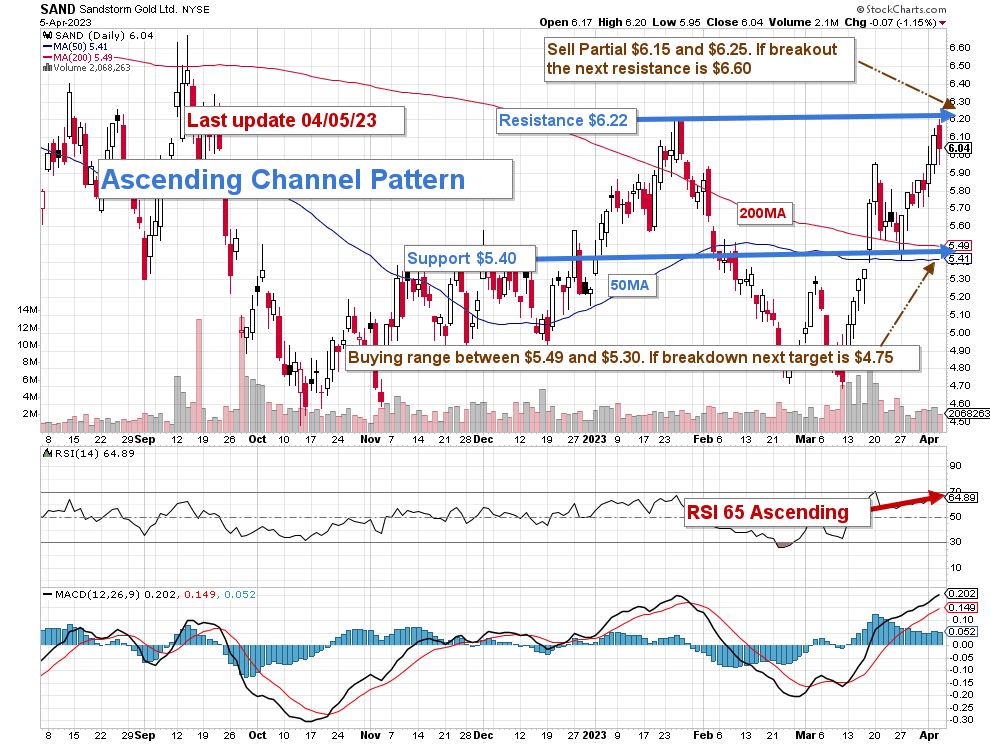
Technical Analysis And Commentary
SAND TA Chart short-term (Fun Trading StockCharts)
Note: The chart is adjusted from the dividend.
SAND forms an ascending channel pattern, with resistance at $6.22 and support at $5.40.
Ascending channel patterns or rising channels are short-term bullish in that a stock moves higher within an ascending channel, but these patterns often form within longer-term downtrends as continuation patterns. The ascending channel pattern is often followed by lower prices.
The trading strategy is to sell at a resistance range of $6.15 to $6.25 with higher resistance at $6.60, about 50% of your position, and sell another part on any pattern breakout above $7.
I recommend buying SAND between $5.49 and $5.30, with possible lower support at $4.75.
After declining moderately in late February, gold prices again pierced the $2,000 mark. The surge in the gold price was due to the turmoil in the banking sector after the Silicon Valley Bank collapse, causing investors to seek safe-haven assets.
However, if we look at the gold chart, we see a perfect Cup & handle pattern which suggests a pause now with a retracement that I see at $1,850 and $1,825 per ounce before resuming the uptrend. Thus, it is perhaps a good time to take profits and accumulate cash to buy back later.
Thus, watch the gold price like a hawk.
Warning: The TA chart must be updated frequently to be relevant. It is what I am doing in my stock tracker. The chart above has a possible validity of about a week. Remember, the TA chart is a tool only to help you adopt the right strategy. It is not a way to foresee the future. No one and nothing can.
For further details see:
Sandstorm Gold: Trading In A Tight Range