SCHA - SCHA ETF: Potentially Better Prospects But Not The Best Entry Point
2023-12-21 19:49:48 ET
Summary
- The small-cap large-cap ratio which has been beaten down could mean-revert as the interest rate trajectory shifts next year. Cheap valuations are an added bonus.
- SCHA, a diversified small-cap offering, is seen as a potential way to play this trade and we measure its qualities versus its largest peer-IJR.
- The weekly charts suggest that some caution may be warranted for those contemplating a long position at this juncture.
Introduction
Small-caps in general, don’t receive a great deal of positive attention when faced with an environment where money is getting dearer. Unlike their large peers which typically have more cash on their balance sheets, small-caps are typically more reliant on external funding from the capital markets.
In recent periods we’ve seen the Fed Funds rate hit its highest level in 22 years, and when you have a scenario such as this, doubts may well arise over small-cap companies’ ability to adequately fund their growth ambitions without resorting to pricey debt.
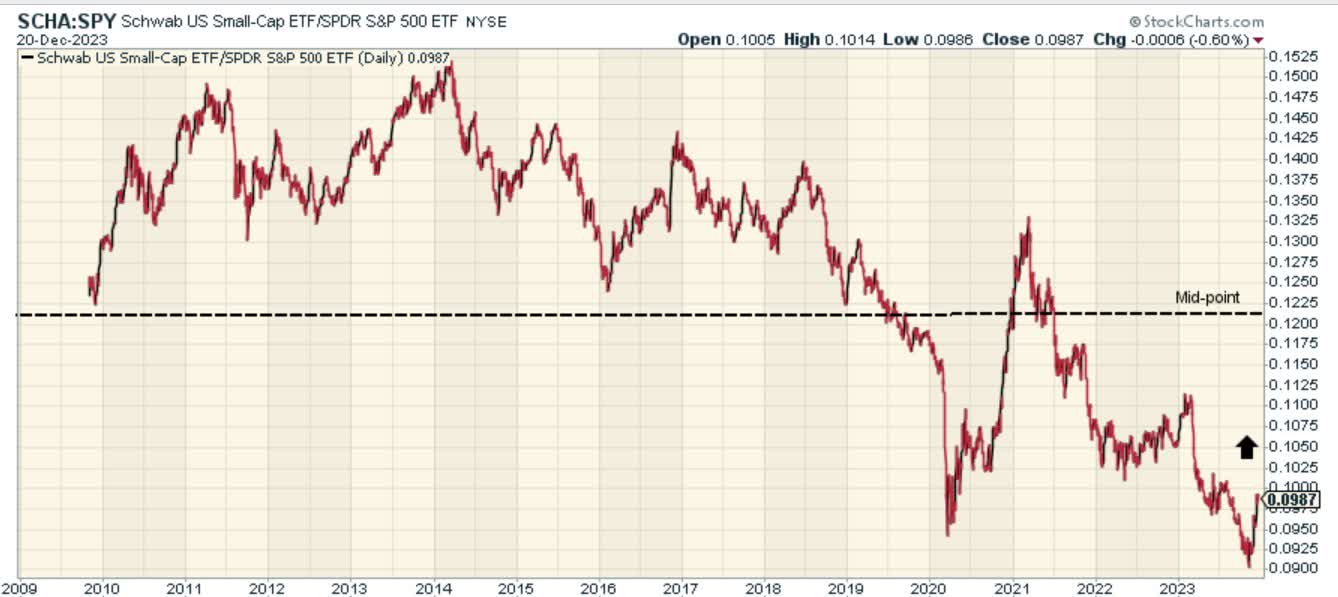
One can get a sense of this aversion to small-caps in the way the small-cap to large-cap ratio has fallen off over the last couple of years or so.
Now if you’re someone who believes in the concept of mean-reversion, the chart above also suggests that small-caps look like an attractive contrarian bet, with the small-cap to large-cap ratio trading around 20% off the mid-point of its long-term range.
Meanwhile, data from Morningstar shows that small-caps can be picked up at a 28% discount to the corresponding P/E of the S&P500, whilst at the same time offering a long-term earnings differential that is around 120-130bps higher.
Crucially, based on the FOMC’s statement last week, and the positioning of the bond market in the days since, it looks like 2024 could be the start of a slew of rate cuts with the Fed funds rate potentially dropping to 2-2.5% by 2026. All these factors make small-caps a rather intriguing bet heading into 2023.
If you’re looking to play the small-cap trade, you have a plethora of ETF options to choose from, and one of the options is the Schwab US Small-Cap ETF ( SCHA ) which has been around for the last 14 years. How good are SCHA’s credentials? To better understand that, we thought we would contextualize its qualities against the largest small-cap ETF in town - The iShares Core S&P Small-Cap ETF ( IJR ) which focuses on the S&P Small-Cap 600 Index (conversely, SCHA focuses on the Dow Jones U.S. Small-Cap Total Stock Market Index).
SCHA vs IJR
Seeking Alpha, Morningstar
IJR came to the bourses roughly around 9 years before SCHA, and since then it has managed to accumulate AUM of over $76bn, which translates to almost 5x that of SCHA’s corresponding figure. IJR’s superior popularity can also be gleaned in the daily trading volumes seen in its counter. Note that the average daily dollar volume difference between the two ETFs is well over 10x.
SCHA offers much wider reach within the small-cap space, covering close to 1750 stocks, whereas IJR covers only a little over 600 stocks. As we will see later on in this piece, having access to a wide portfolio of small-caps doesn't necessarily equate to better risk-adjusted returns. Both portfolios ought to be commended for the relative diversification they offer, and the lack of top-heaviness, with the top 10 holdings only taking a single-digit share.
However, when it comes to the structure of the vehicle, we think SCHA may have an edge. Firstly, it is the most cost-efficient way to play small-caps, with an expense ratio of only 0.04% (although IJR’s is not bad at 0.06%), and even from a tax efficiency perspective, it helps that SCHA has an inordinately low turnover ratio in the single-digit threshold. IJR is prone to a little more churn with an annual turnover ratio that is twice as much as SCHA’s.
Then from an income perspective, both products interestingly offer identical current yields of 1.43%, but what’s key is that SCHA’s current yield is around 13bps better than what you normally get, whereas IJR’s current yield lags its historical average by 5bps. This would typically point to more generous payouts by SCHA in recent years, and we can see that in growth of the respective dividends over the last 3 years; SCHA’s dividends have grown at a solid rate of 13%, whereas IJR’s growth rate during the same period has only been in single digit levels.
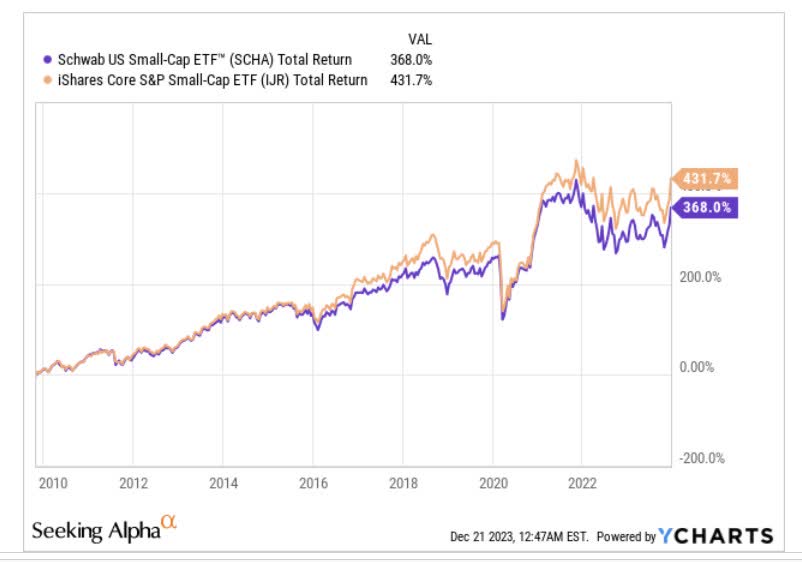
Now if one were to juxtapose the historical track record of the two products and the manner in which they juggle risk, it’s fair to say there’s only one clear winner, and that’s IJR.
Firstly note that since SCHA’s inception, IJR has outperformed the former by 1.17x.
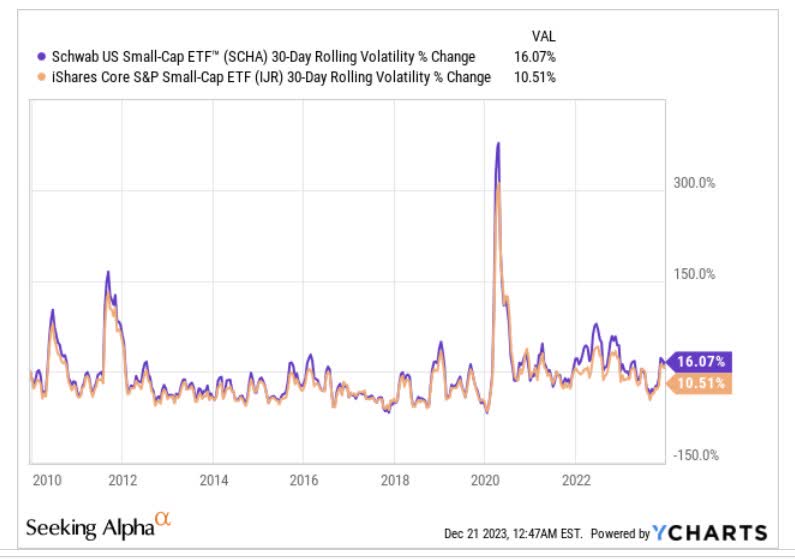
Then, ironically, despite offering far greater access to the more volatile micro-cap segment (44% of IJR’s portfolio consists of micro-caps versus only 27% for SCHA whilst the average market-cap figures of the two products too suggest that IJR focuses on the smaller names), note that IJR still has the lower volatility profile, and by quite a large margin of nearly 550bps.
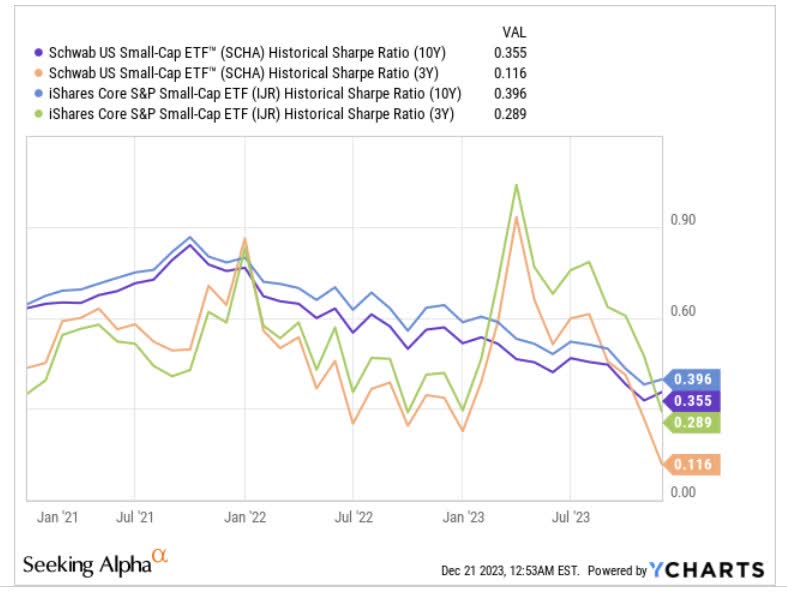
With a lower volatility profile at the denominator level, IJR doesn’t need to generate a great deal of excess returns over the risk-free rate, and we see this reflected in much superior Sharpe ratios, be it over the short-term or the long-term.
IJR's superior risk-adjusted return profile also comes through when only viewing the performance of these products in the face of downside deviation. Once again, regardless of the time period under consideration, IJR throws up better numbers than SCHA.
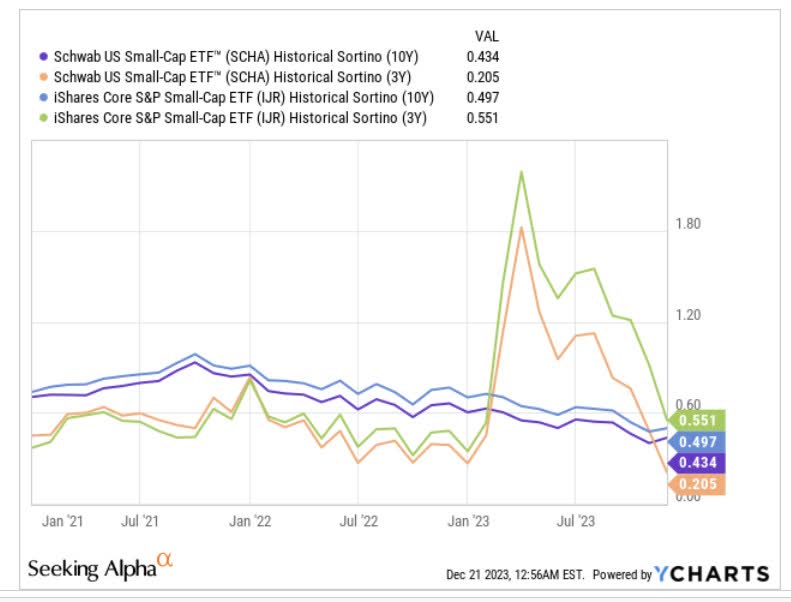
IJR's superior risk-adjusted return performance could perhaps be attributed to the fact that it levies more stringent screening standards when picking its stocks, quite unlike SCHA. For instance, IJR requires that its small-cap stocks exhibit a consistent 4 quarter-positive track record on the GAAP earnings front, including the most recent quarter.
Finally also consider that IJR is currently priced at cheaper valuations of ~8% to SCHA on a P/E basis.
Closing Thoughts- Technical Considerations
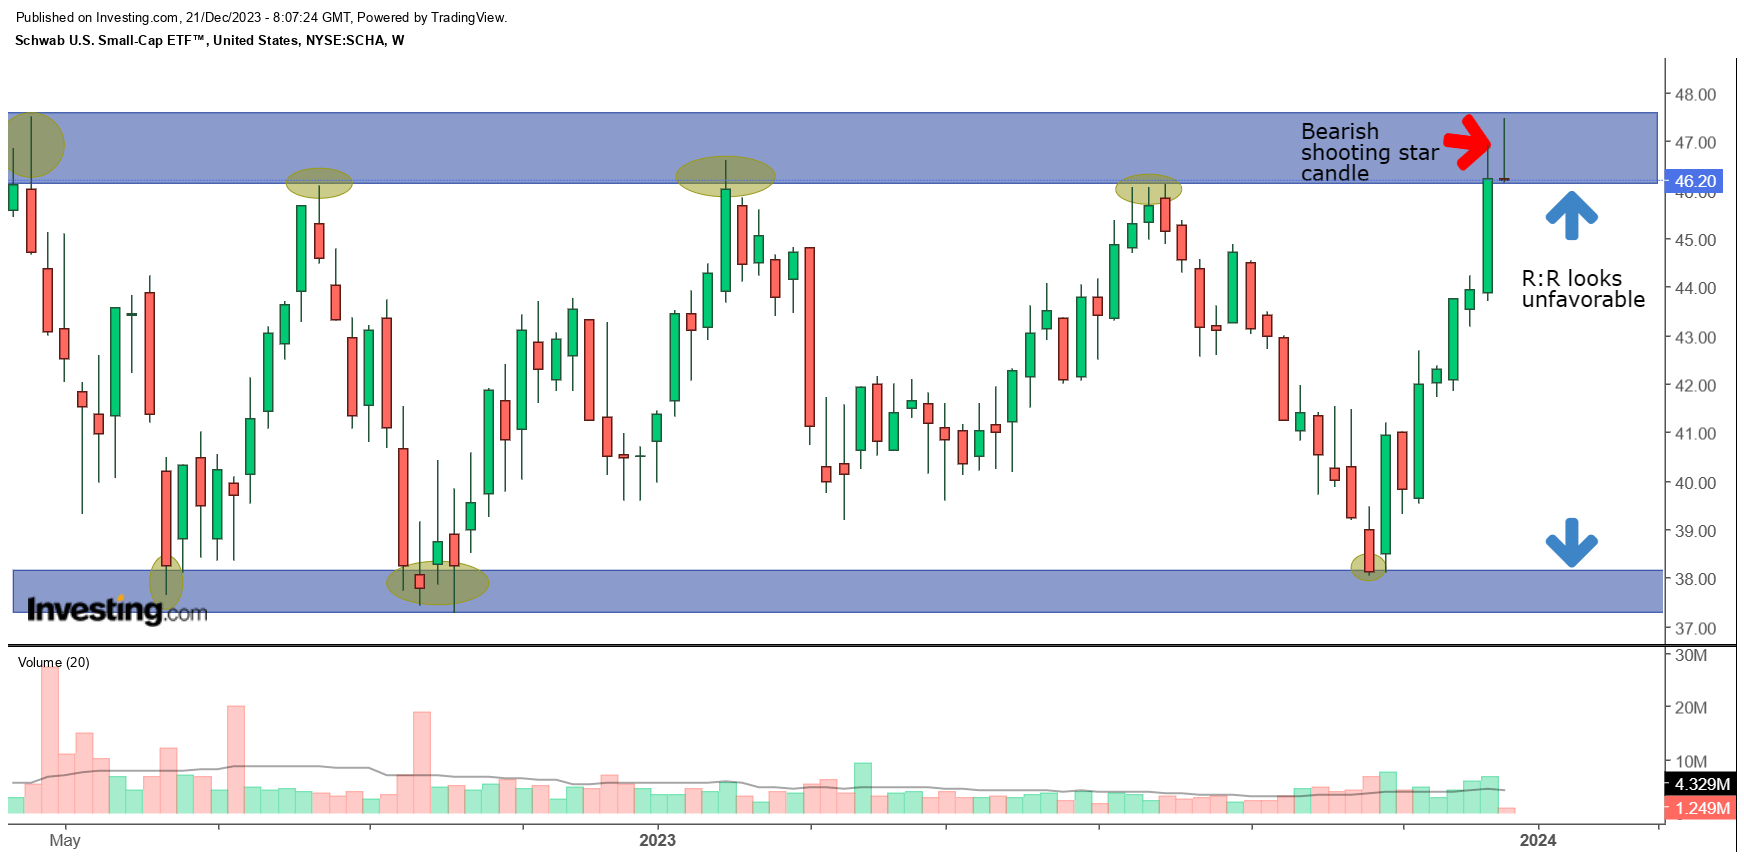
As noted at the start of this article, the current positioning of the small-cap to large-cap ratio looks quite tasty from a mean-reversion angle, but if we only focus on SCHA's weekly imprints over the last 20-odd months, it is debatable if a long position ought to be considered at this juncture.
What’s rather evident from the chart above is that SCHA has been chopping around directionless, within a certain trading range, with the upper boundary placed at the $47-$48 levels, and the lower boundary placed at the $37-$38 levels. We’ve seen multiple instances where the ETF hits these levels and the price recoils thereafter. Now after a relatively strong run in Nov and Dec, the ETF has once again revisited the upper boundary, pointing to unfavorable risk-reward. Crucially it also looks like this week may well end up seeing a shooting-star candle pattern, which forms after an uptrend and typically points to a reversal in fortunes.
For further details see:
SCHA ETF: Potentially Better Prospects, But Not The Best Entry Point