VIOO - SCHA Vs. IJR: Schwab's Small-Cap ETF Underperforming The Big Dog
Summary
- Schwab U.S. Small-Cap ETF, SCHA, seeks to track the performance of the Dow Jones U.S. Small-Cap Total Stock Market Index.
- iShares Core S&P Small-Cap ETF, IJR, seeks to track the performance of the S&P SmallCap 600 Index.
- Both ETFs and their underlying indices are examined in detail. Unlike other comparisons I’ve done, here the better-known ETF is the better choice. I list others to consider, too.
(This article was co-produced with Hoya Capital Real Estate . )
Introduction
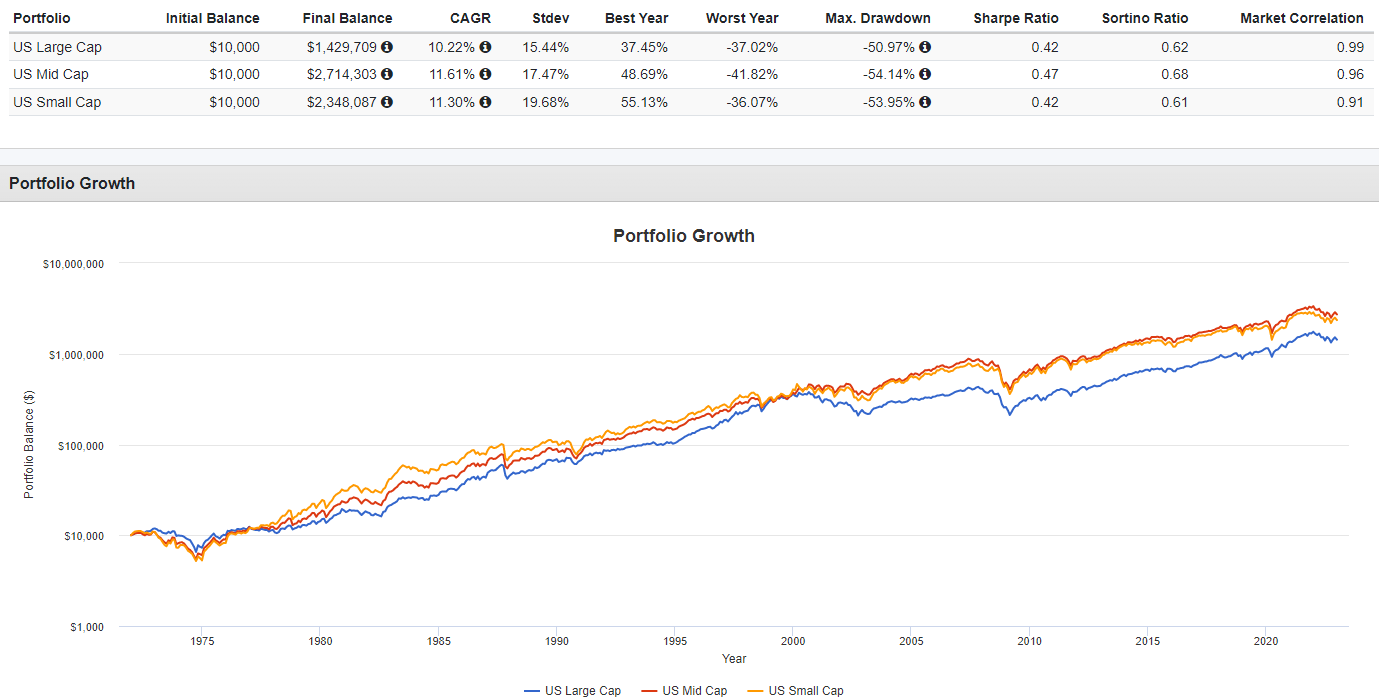
This article will review both the Schwab U.S. Small-Cap ETF ( SCHA ), the iShares Core S&P Small-Cap ETF ( IJR ), plus each index used. This segment of the U.S. equity market doesn't get as much attention in the media or other places like the S&P 500 Index (SP500) or Dow Jones Industrial Average (DJI) stocks do. That can lead to missed opportunities. Since 1972, small-cap stocks have better results than large-cap stocks where most individuals and large institutions are heavily invested.
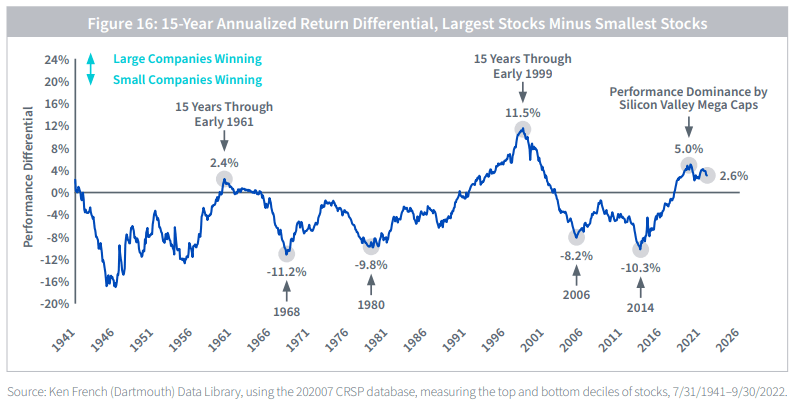
That said, the forgotten stocks in the middle have had the best results. That changes when looking at the last decade, a time when large-cap stocks are the clear winner.
Reversion-to-the-mean investors would look at both charts and possibly jump into small-cap stocks with both feet. The next chart from WisdomTree shows that could have started already.
wisdomtree.com: Market outlook
Where returns have come from over the past decade potentially supports this idea, as large-cap performance was dependent on the high P/E stocks, whereas small-cap results were driven by stocks where the company lost money.
wisdomtree.com: Market outlook
Many expectations are for 2023 earnings to be depressed from 2022 due to ongoing supply issues, including labor, but also the increasing cost of those employees they do have.
Schroders notes the rotation started in early 2022, despite historical economic conditions favoring large-cap stocks. One theory they present is that small-cap stocks have already priced in all the "bad" news, with the P/E relationship between large-cap and small-cap stocks is at a two-decade low.
Of course, that assumes things have not change in the investment world over the past half-century. I tackle that point in my Portfolio strategy section later.
Schwab U.S. Small-Cap ETF review
Seeking Alpha describes this ETF as (emphasis added):
The Schwab U.S. Small-Cap ETF is an exchange traded fund launched and managed by Charles Schwab Investment Management, Inc. The fund invests in public equity markets of the United States. The fund invests in stocks of companies operating across diversified sectors. The fund invests in growth and value stocks of small-cap companies. The fund seeks to track the performance of the Dow Jones U.S. Small-Cap Total Stock Market Index . SCHA started in 2009.
Source: seekingalpha.com SCHA
SCHA has $13.4b in assets under management ("AUM") and sports a TTM yield of 1.3%. Schwab charges only 4bps in fees.
Index review
The Dow Jones U.S. Small-Cap Total Stock Market Index , a member of the Dow Jones Total Stock Market Indices family, is designed to measure the performance of small-cap U.S. equity securities. The Index includes the components ranked 751-2500 by full market capitalization. The index is a float-adjusted market capitalization weighted index, with rebalancing occurring quarterly. The following characteristics were provided.
When including the largest 750 stocks, the Mean rises to $9.5b and the Median drops to $715m.
SCHA holdings review
This ETF is the only one currently investing based on this Small-Cap Dow Jones index. The sectors allocations are:
schwabassetmanagement.com; compiled by Author
Unlike some Large-Cap ETFs, there is no one dominant sector, usually Technology, and five sectors are over 12% in weight. The largest 20 positions, out of over 1750, account for under 6% of the portfolio: no one stock, or group of stocks, have a major impact on performance.
schwabassetmanagement.com; compiled by Author
To keep cash invested, SCHA owns 6000 contracts of the March R2000 Emini futures.
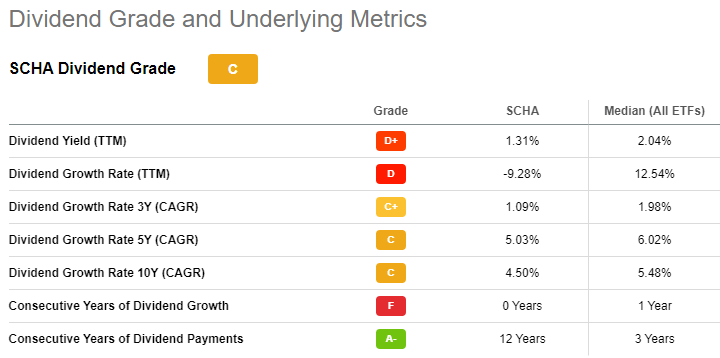
SCHA distribution review
As readers will see later, this payout pattern differs somewhat from what IJR has done, though the yield provided is just below IJR's. Seeking Alpha gives SCHA only a "C" grade for dividends.
seekinglpha.com SCHA scorecard
iShares Core S&P Small-Cap ETF review
Seeking Alpha describes this ETF as (emphasis added):
The IJR ETF invests in stocks of companies operating across diversified sectors. It invests in growth and value stocks of small-cap companies. The fund seeks to track the performance of the S&P SmallCap 600 Index . IJR started in 2000.
Source: seekingalpha.com IJR
IJR has $67.8b in AUM, or about 5X what SCHA has. Both the TTM yield (1.36%) and iShares fees (6bps) closely match SCHA.
Index review
S&P provides a PDF describing their Index:
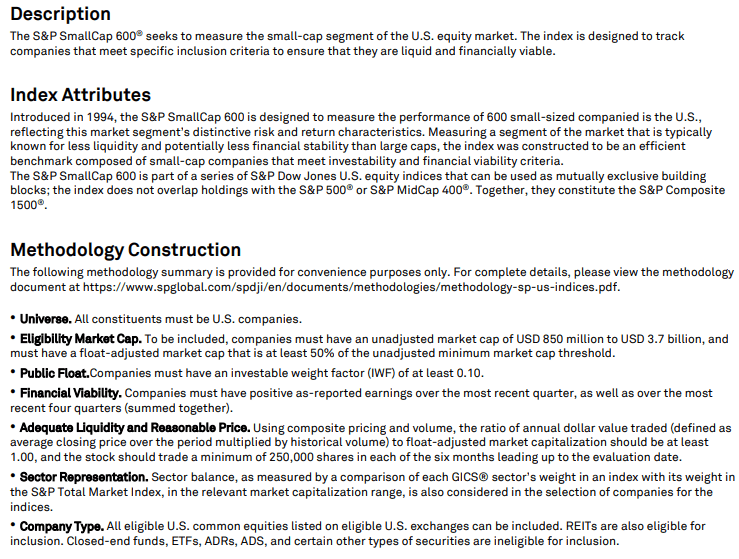
IJR holdings review
IJR holds a much lower number of securities, just under 700, almost a 1000 less than SCHA.
ishares.com; compiled by Author
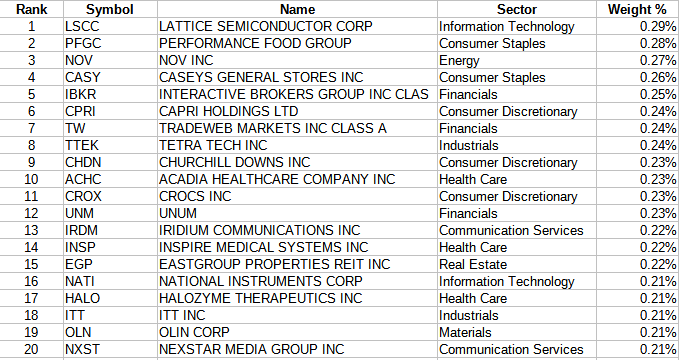
I will compare the sector allocations later. Ignoring the largest holding, cash, the next 20 stocks represent 10% of the portfolio; still, no stock is over 1% of the portfolio.
ishares.com; compiled by Author
IJR owns 2188 contracts of the R2000 Emini futures to stay fully invested.
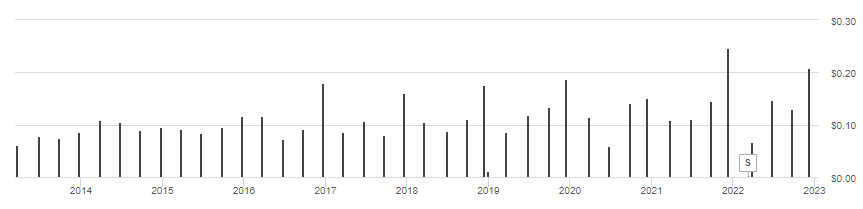
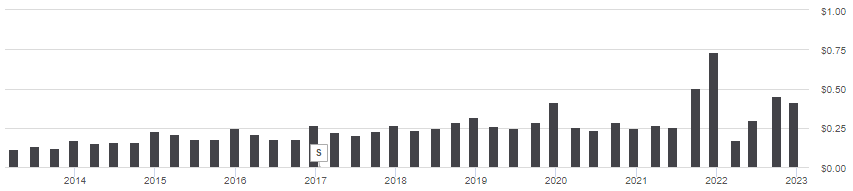
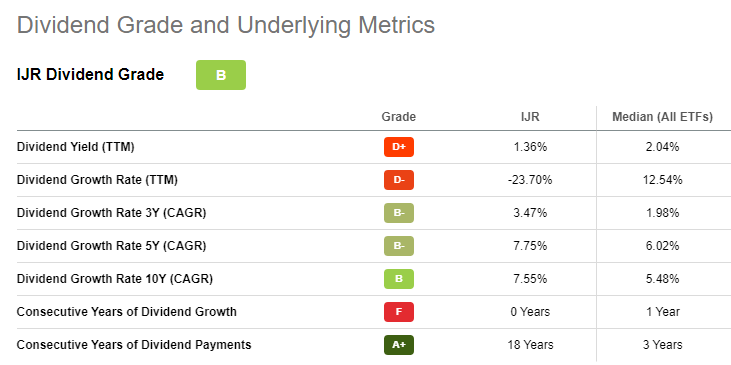
IJR distribution review
Until recently, payouts only fluctuated slightly, that has not been the case since late 2021. Considering the yield is under 1.4%, income is not a primary goal of IJR investors. Seeking Alpha gives IJR a "B" rating for dividends.
seekingalpha.com IJR scorecard
Comparing ETFs
I added data for the SPDR S&P 500 ETF ( SPY ) to see how "going small" might affect the holdings.
Fidelity.com; compiled by Author
Both Small-Cap ETFs have better Value ratios than SPY, whereas SPY has better growth ratios, which also favor SCHA over IJR. The above is a snapshot in time, the next two show what all three provided to investors, starting with returns.
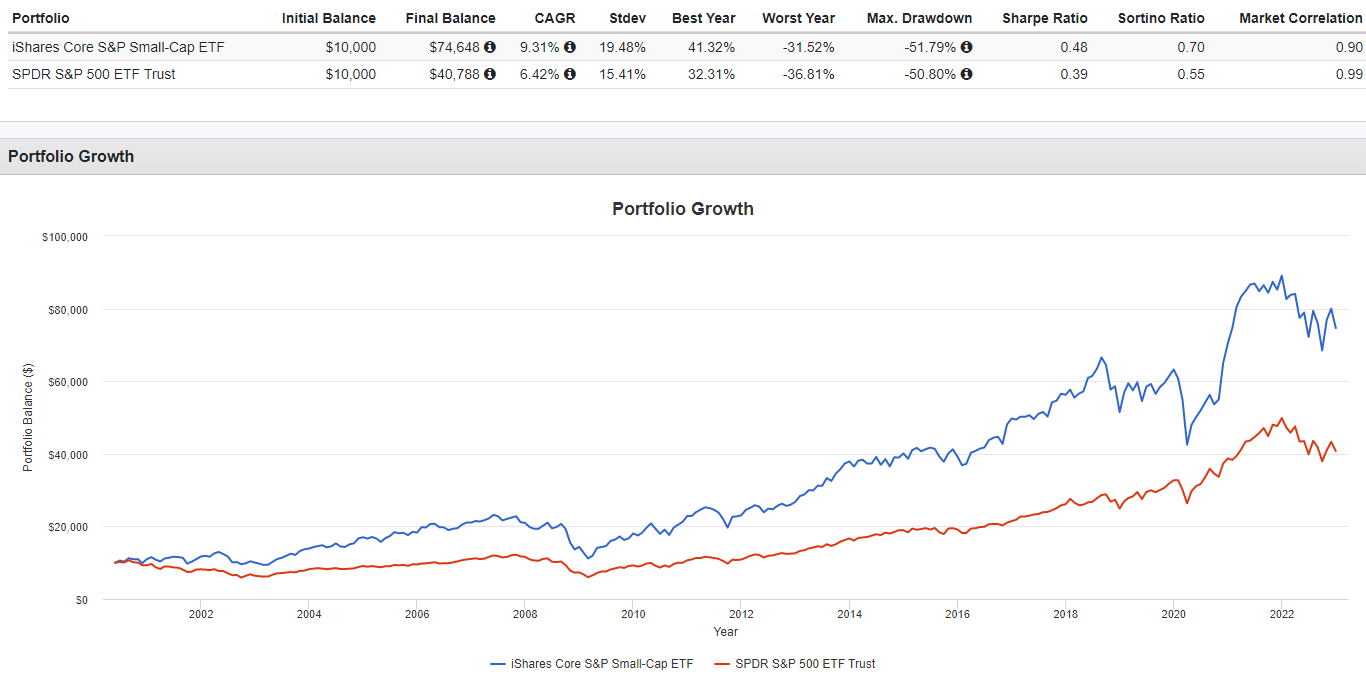
Here we see that the IJR ETF almost matches the SPY ETF total return since the date when SCHA started in 2009. SCHA lags behind both. Using PortfolioVisualizer data, we can compare risk statistics.
So along with having the lowest return, SCHA did that by experiencing the highest StdDev. On a risk ratio analysis, not owning some large-cap exposure would have added risk, though combining IJY and SPY shows some risk/reward benefits.
Seeking Alpha grades or ranks US ETF: SCHA is on the left, IJR on the right.
seekingalpha.com SCHA homepage seekingalpha.com IJR homepage
Portfolio strategy
Recent performance seems to indicate the rotation out of large-cap and into small-cap stocks has started. Even if that is correct, market-timing investors need to know if it will continue. Putting aside the economic reasons it might, I promised some thoughts on if the market itself has changed and whether that will affect the depth and length of any small-cap outperformance. Since the early 1970s, we have seen:
- The invention of index-based ETFs as major players on the demand side. While a few funds screen for negative P/E ratios, most just buy the market. All the largest U.S. equity ETFs are large-cap focused.
- While defined-pension percentage is down considerably, DC plans + IRAs more than make up for that decline. U.S. households now have more money invested in stocks within their retirement account than their taxable accounts. Most of that is invested in funds.
- Foreign ownership of U.S. stocks has gone from 5% to 35% since 1965. Logic says that is heavily weighted to what they know; large-cap stocks.
- Combining various factors, institutional ownership of U.S. stocks increased from 29% to 76% of the overall market from 1980 to 2015. Small-cap stocks are hard to own at a level that justifies the research cost of covering that market segment.
In short, there are ample reasons to believe the market environment might now favor larger stocks over smaller ones. Add the fact that many US stocks are already 80% owned by institutions, that limits what some call the "free float", which would drive their price higher if such buyers get an "itch" to own more. That last fact should provide more value in small-cap stocks.
I include the next chart to show how picking dates can alter the picture. By removing the SCHA ETF from the previous PV data, we get an extra nine years of data and a different outcome.
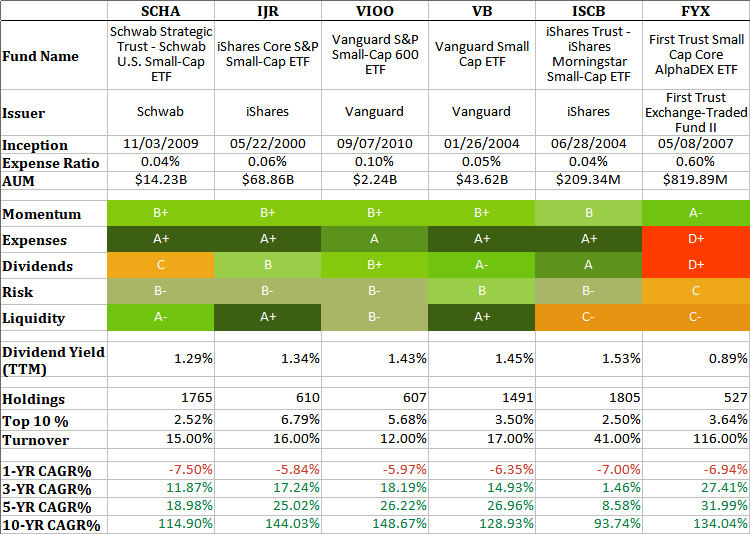
As important as being careful about the timeframe is reviewing a universe beyond what you might have started with within that asset class. Using the Seeking Alpha Peers functionality, I came up with this list of six small-cap ETFs.
seekingalpha.com Peers; compiled by Author
For two of the others, I did a recent comparison: VB Vs. VIOO: Comparing 2 Vanguard Small-Cap ETFs . Based solely on the 10-year CAGR, the VIOO ETF is worth some due diligence.
For further details see:
SCHA Vs. IJR: Schwab's Small-Cap ETF Underperforming The Big Dog