IJR - SCHA: Why You Should Sell Schwab's Small-Cap ETF
2023-05-01 07:51:55 ET
Summary
- SCHA tracks an Index of 1,750 small-cap stocks. The ETF has $13.34 billion in assets under management, likely due to its category-leading 0.04% expense ratio.
- However, SCHA consistently underperforms because it holds too many low- or non-profitable stocks. ETFs that select from a more narrow stock universe, like IJR and VB, are better choices.
- My fundamental analysis reveals SCHA shareholders aren't receiving an adequate discount on earnings or cash flow, either. Even when just including profitable stocks, IJR is cheaper.
- Given the abundance of evidence against SCHA's strategy and composition, I rate it a sell.
Investment Thesis
The Schwab U.S. Small-Cap ETF ( SCHA ) is a prime example of why selecting the fund with the lowest expense ratio in the category is only sometimes optimal. Since its 2009 inception, SCHA consistently lagged plain vanilla market-cap-weighted peers like the iShares Core S&P Small-Cap ETF ( IJR ), Vanguard Small Cap ETF ( VB ), and the iShares Russell 2000 ETF ( IWM ). The reason is that SCHA holds less-profitable stocks due to its larger selection universe. This article provides nearly 60 years of evidence supporting this view and presents an overview of SCHA's fundamentals at the industry level compared to IJR and VB. Ultimately, I'm confident you'll be convinced SCHA is not a strong fund, so I've rated it as a "sell."
SCHA Overview
Strategy and Performance
SCHA tracks the Dow Jones U.S. Small-Cap Total Stock Market Index, has a category-leading 0.04% expense ratio, and $13.34 billion in assets under management. The Index's methodology document lists the eligibility and selection criteria, which I've summarized below.
- common stock and REITs are eligible, while BDCs, LPs, ADRs, and other alternative share types are not.
- the security must have a primary listing on a U.S. exchange.
- after assigning the top 750 stocks by full market capitalization (with a 20% buffer rule for current constituents), stocks 751-2500 are assigned to the small-cap Index.
- the Index is float-adjusted market-cap-weighted.
IJR tracks the S&P SmallCap 600 Index, and though the selection universe is slightly different, stocks ranked 901-1500 in size qualify. VB tracks the CRSP US Small Cap Index, using dynamic breakpoints to select the bottom 2-15% of the investable U.S. market cap. Finally, IWM selects stocks ranked 1001-3000.
SCHA's universe tilts more toward smaller companies than IJR and VB, with IWM featuring the smallest of the small caps. However, the graph below highlights the best returns come from the ETFs with the larger holdings. SCHA lagged IJR and VB by 1.00% and 0.63% per year since November 2009 but outperformed IWM by an annualized 0.68%.
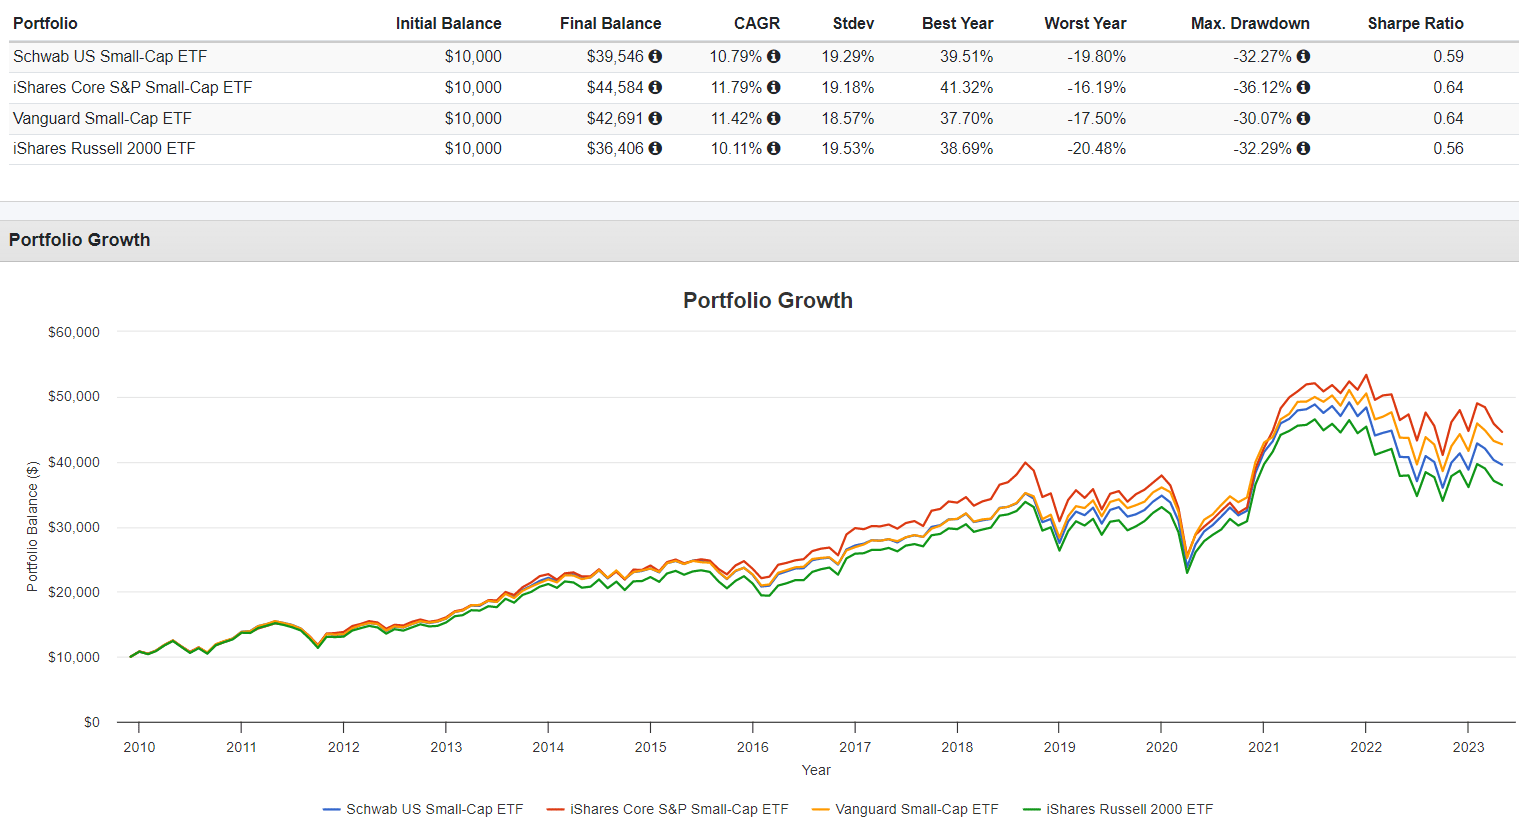
I will provide evidence that SCHA's underperformance is not limited to the last 14 years. But first, let's examine SCHA's composition.
Sector Exposures and Key Holdings
The following table highlights sector exposures for SCHA, IJR, VB, and IWM. There is a little to note here, which isn't surprising because all four have considerable overlap and are plain vanilla market-cap-weighted funds. However, there is a bias toward Health Care stocks with SCHA and IWM, and the primary source is increased Biotechnology exposure. About 50 holdings (1% of the weight) are pre-revenue, and the majority (4.42% of excess weight) is operating cash flow negative.
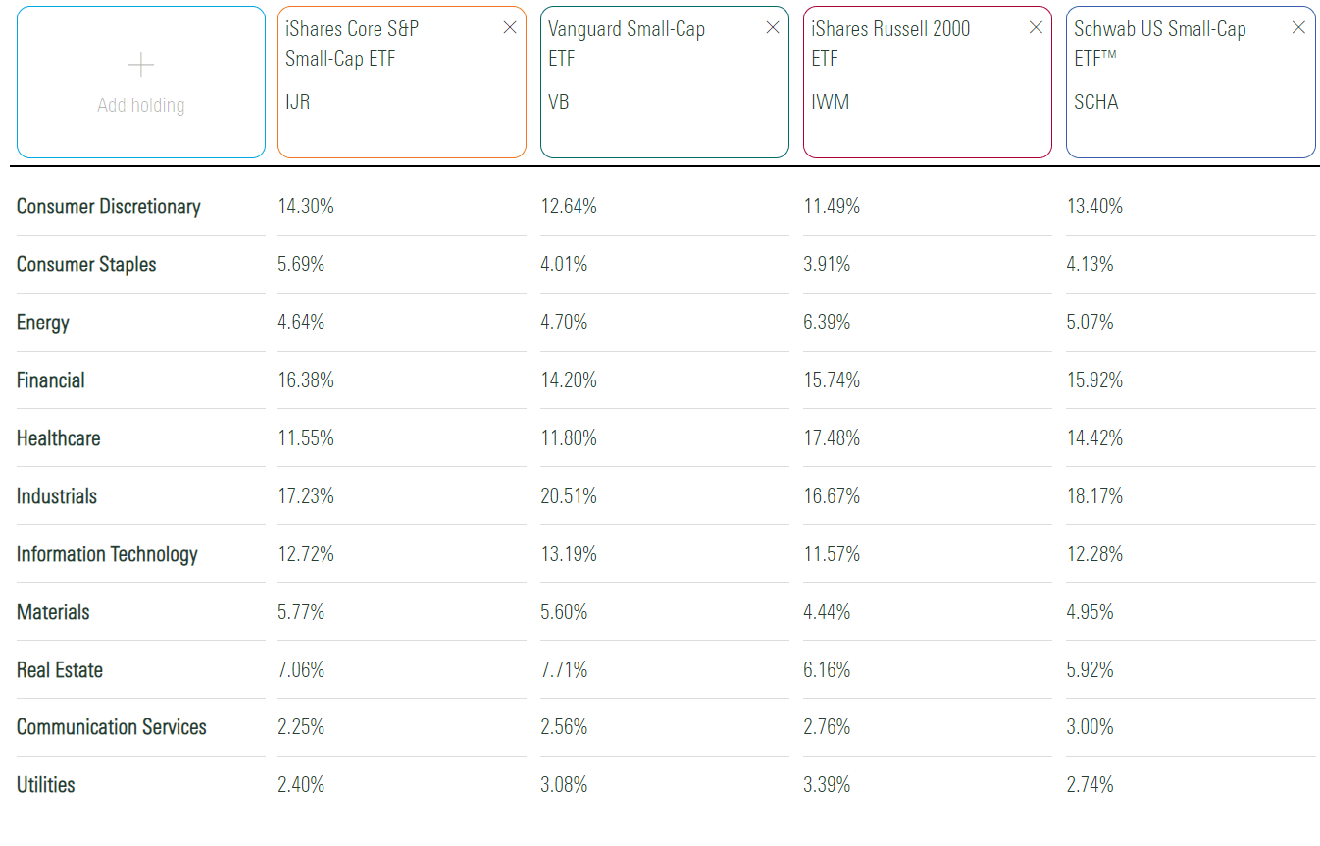
The top 25 industries comprise 51.36% of the fund. Here is a summary of the top three holdings in each. There are 1,750 holdings, so even the largest three ( LSCC , PFGC , CHDN ) total only 1.05%.
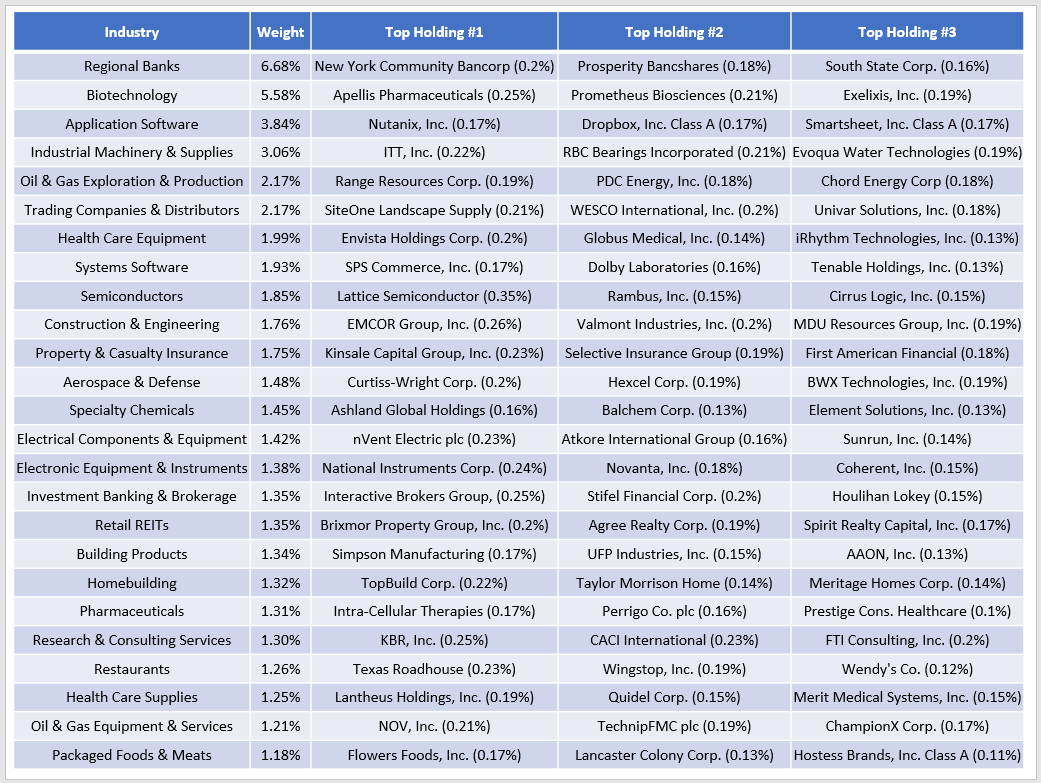
SCHA Analysis
Historical Returns: Portfolios Formed By Size & Profits
The Ken French Data Library provides historical return information for portfolios formed by size and operating profitability. It's one of several highlighted on the library's main page . We see that over the last twelve months through March 2023, the small robust (high profitability) portfolio declined by 5.23% compared to a 16.12% decline for the small weak (low profitability) portfolio. In March and the last three months, returns for the two portfolios were roughly equal.
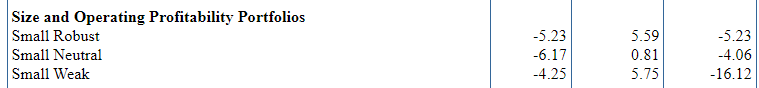
This linked file provides source data for the same value-weighted portfolios from 1964-2022. Here are some statistics I calculated:
- The robust portfolio was less volatile, with a 24.10% standard deviation vs. 26.34% for the small weak portfolio.
- The robust portfolio outperformed by 4.15% per year on average.
- The robust portfolio outperformed in 41/59 years.
- The robust portfolio last outperformed by over 10% in 2021 (32.84%) and beat by 10%+ in 13 more years by an average of 16.15%.
- The weak portfolio outperformed by 10%+ in 2018 (10.02%). It also beat in 1968, 1973, 1999, 2003, and 2020 (12.72%, 11.83%, 32.55%, 22.23%, 12.17%).
In addition, the following five-year rolling return statistics are helpful for buy-and-hold investors:
- The robust portfolio averaged a 110.22% five-year gain, ranging from a 50.80% decline (1970-1974) to a 406.48% gain (1975-1979).
- The weak portfolio averaged a 73.72% five-year gain, ranging from a 47.10% decline (1969-1973) to a 400.34% gain (1975-1979).
- The robust portfolio outperformed in 44/55 five-year periods.
Finally, over the last 25 years between 1998-2022:
- The robust portfolio averaged a 13.01% gain, ranging from a 31.14% decline (2008) to a 48.06% gain (2003).
- The weak portfolio averaged a 9.19% gain, ranging from a 41.67% decline (2008) to a 70.29% gain (2003).
- The robust portfolio outperformed in 16/25 years.
By now, the takeaway is clear. Selecting low-profitable small-cap stocks is not a winning strategy. At best, you will get lucky when market sentiment is high and substantially outperform. At worst, you'll hold it for several years before realizing your mistake. With this information in mind, let's examine the fundamentals for SCHA against its three peers.
SCHA Industry Fundamentals
The following table highlights selected fundamentals for SCHA's top 25 industries. These industries comprise 51% of the portfolio, and I want to pay particular attention to the profitability metrics in the last three columns.
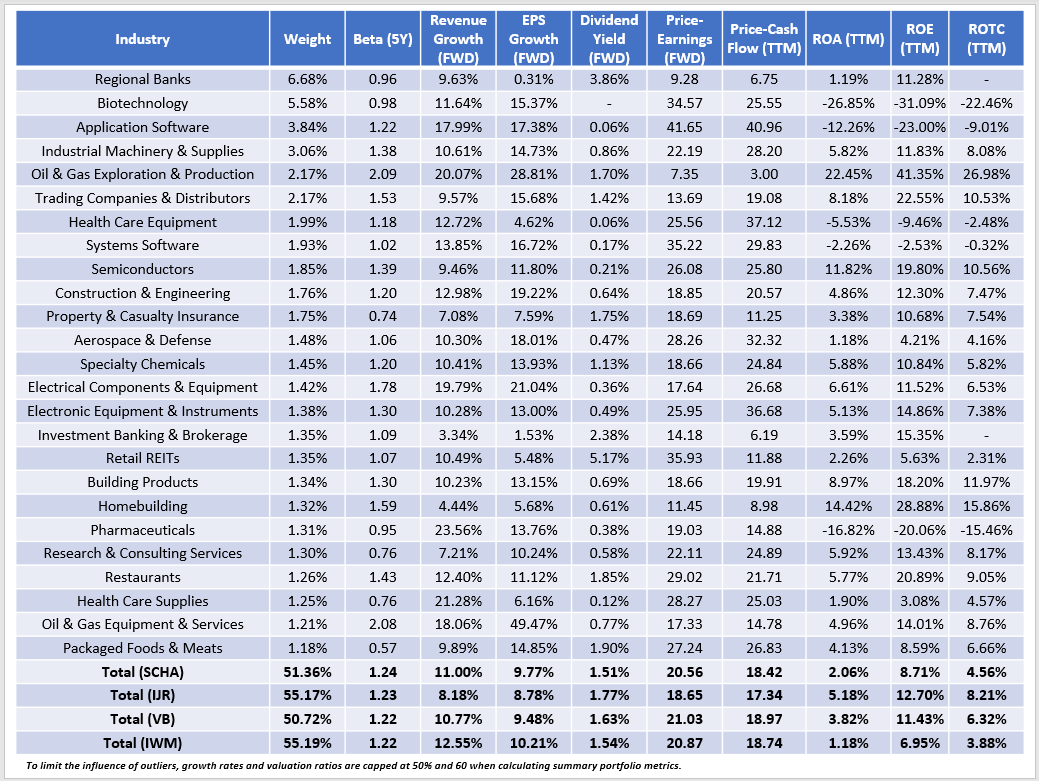
This data presents a clear pattern. On trailing twelve-month return on equity, return on assets, and return on total capital, SCHA's figures are second-worst behind IJR and VB. IWM is consistently the worst, and we've seen this pattern before. Higher profitability ETFs like IJR and VB outperformed SCHA and IWM since SCHA's launch in November 2009. The order was the same, too.
Overweighting Biotechnology stocks is problematic. As mentioned, many are cash flow negative, and the ones that aren't trade at an expensive 25.55x trailing cash flow. On forward earnings, SCHA trades at 20.56x forward earnings, but 18% of the ETF's weight is unprofitable. True to the pattern, IJR, VB, and IWM's unprofitable holdings total 11%, 13%, and 22%. When considering these figures, SCHA doesn't offer any valuation benefit.
Investment Recommendation
My analysis revealed a clear pattern: small-cap funds with less-profitable stocks underperform. The historical returns for SCHA, IJR, VB, and IWM confirm this pattern, as do the Ken French Data Library portfolios and the profitability metrics presented for each ETF. Therefore, I rate SCHA as a "sell" and predict it will continue to underperform.
For further details see:
SCHA: Why You Should Sell Schwab's Small-Cap ETF